The post Spices Adulterant Analysis appeared first on NIR-For-Food.
]]>Introduction
Spice adulteration goes back to ancient times and has been documented throughout history. Spices are considered a high value target and methods have evolved over time from the simple addition of undesirable components to increase mass to deliberate and calculated adulteration meant to mask the presence of adulterants in quality control tests. Some high-profile incidents in recent years have highlighted the need for fast and cost-effective monitoring of spice adulteration. Examples include lead oxide in paprika and Sudan I dye in chili powder, which was used in contaminated Worcestershire sauce. In the case of the withdrawn obesity medication sibutramine as an adulterant in herbal medicine, the sibutramine acts as an appetite suppressant but presents serious side effects and cardiovascular risks. While there are effective analytical methods for monitoring for spice adulteration, they are often expensive, time-consuming, and difficult to implement as a large-scale quality control method. One method that has been examined for spice adulteration monitoring is NIR spectroscopy and a summary of some research studies is presented below, including one study on herbal medicine adulteration.
Analytes
Products: Paprika, Chili Powder, Chinese Shanyao, Onion Powder, Black Pepper, Cinnamon, Goldenseal, Herbal Medicines
Adulterants: Sudan Dye, Tomato Skin, Brick Dust, Starch, Buckwheat, Millet, Papaya Seeds, Chili, Spent Material, Lower Grade Cinnamon, Exhaustively Extracted Material, Yellow Root, Yellow Dock, Oregon Grape, Coptis, Sibutramine
Scientific References and Statistics
Fast Detection of Paprika Adulteration Using FT-NIR Spectroscopy – Galaxy Scientific, Inc., Oct. 17, 2016
Spice adulteration goes back thousands of years and can take on different forms which are always evolving. Many forms of adulteration are relatively harmless in a health sense but have can have economic consequences, such as misrepresentation of the geographical origin of a product. However, when adulteration involves contamination with toxic products, the consequences can be deadly. One real-life incident was the discovery of the carcinogenic and banned food additive Sudan I dye in Worcestershire sauce, which was added by way of adulterated chili powder. Food adulteration is at the top of the list when it comes to safety concerns and there is a need for fast, non-invasive testing for adulterants as current methods are time-consuming, expensive, and often require the use of wet chemistry. One method that has been examined is NIR spectroscopy, offering the advantages of no sample preparation, high speed, and ease of use without chemicals.
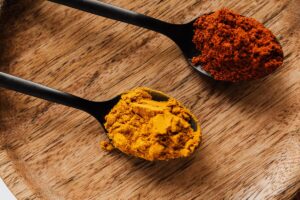 A study was conducted at Galaxy Scientific in Nashua, NH for the purpose of using FT-NIR spectroscopy to determine the presence of adulterants in paprika using tomato skin, red brick dust, and Sudan I dye. Four different paprika samples were purchased: McCormick Paprika, McCormick Gourmet Hot Hungarian Paprika, Morton & Bassett Paprika, and Spice Chain Pride of Szeged Hungarian Style Paprika. Sudan I with a dye content greater than 95% was purchased from Sigma Aldrich. Red brick was obtained from Home Depot and ground into fine powder. Tomato was purchased from a local market and the skin was peeled, dried, and ground into fine powder. Samples were mixed in the following concentrations of each adulterant:
| Sudan I Dye | 0.11 | 0.62 | 0.88 | 4.58 | 10.32 (% w/w) |
| Tomato Skin | 0.11 | 0.52 | 1.23 | 5.54 | 10.86 (% w/w) |
| Brick Dust | 0.1 | 0.68 | 1.04 | 4.77 | 14.12 (% w/w) |
Two different Galaxy Scientific QuasIR 3000 spectrometers were used to collect FT-NIR spectra of the adulterated samples as well as of each pure paprika and adulterant sample. Samples were stored in 25 X 95 mm glass vials and placed on top of the 23 mm sample window of the integrating sphere for scanning. FT-NIR spectra were collected from 10000 cm-1 to 4000 cm-1 using 4 cm-1 resolution and two hundred scans per average. Each sample was scanned twice using each spectrometer and the vial was shaken between each measurement. Spectra were averaged for each sample before visual examination and chemometric analysis.
Visual examination of the NIR spectra for all four paprika samples and all three adulterants showed distinct absorbance bands except in the case of brick dust, which was expected because it is an inorganic material. The main absorbance band in brick dust is an O-H band due to moisture. Sudan I dye has distinct absorbance bands around 4600 cm-1 and 6000 cm-1. Because both are natural organic products, the spectral features of tomato skin are very similar to paprika. The Advanced ID CLS algorithm was used to analyze the NIR spectra of the paprika and adulterant mixtures for chemometric analysis
| Sudan I Dye | R² > 0.95 for 0.11%, 0.62%, 0.88%, 4.58%, and 10.32% samples |
| Tomato Skin | R² > 0.93 for 0.52%, 1.23%, 5.54%, and 10.86% samples |
| Brick Dust | R² > 0.95 for 4.77% and 14.12% samples |
The Advanced ID algorithm extracts a spectrum from a mixture using the spectra of each individual component of the mixture. Clear differences were observed in the spectra of the paprika mixed with different concentrations of the Sudan I dye, especially in the distinctive absorbance region for Sudan I dye between 6200 cm-1 and 5800 cm-1. The high correlation coefficient shown by the algorithm indicates that Sudan I dye adulterant in paprika can be detected at a concentration as low as 0.1%. In the case of tomato skin, first derivative processing of the spectra was used because the absorbance spectra are so similar. Good correlation was shown if the tomato skin concentration was above 0.5% and this is the sensitivity for detecting tomato skin adulterant in paprika. The lack of distinctive absorbance features in NIR spectra of brick dust made it more difficult to detect low concentrations of adulteration, but results still showed good correlation for samples with 5% or higher amounts of brick dust adulterant. In practice, any real adulteration contamination will be at a high concentration to make sense economically, so the FT-NIR spectra and Advanced ID algorithm can be used as a fast screening tool to detect adulteration in Paprika with no sample preparation or use of wet chemistry.
FULL PAPER: https://galaxy-scientific.com/wp-content/uploads/2016/10/GS-A-Paprika-1.1EN.pdf
Galaxy Scientific QuasIR and Other Products: https://galaxy-scientific.com/products/
The Feasibility of Using Near Infrared and Raman Spectroscopic Techniques to Detect Fraudulent Adulteration of Chili Powders with Sudan Dye – Haughey, Galvin-King, Ho, et al., Food Control 48 (2015) 75-83
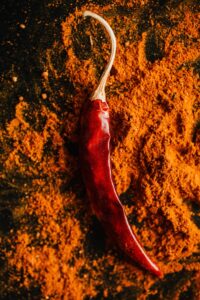 Chili powder is a valuable and globally traded commodity which has been found to be adulterated with Sudan I dye. Sudan I dye is classified as a Class 3 carcinogen and banned as a food additive. One known incident was the discovery of contaminated Worcestershire Sauce, which was made from chili powder adulterated with Sudan I Dye. Methods of adulteration are continually evolving and thus there is a demand for new testing methods that are fast and require little or no sample preparation. Both NIR and Raman spectroscopy were examined as screening tools for detecting the adulteration of chili powder with Sudan I dye. Commercial chili powder samples were purchased from local markets for the study. Different samples were spiked with Sudan I dye at the following w/w concentrations: 0.1%. 0.2%. 0.5%, 1%, 2.5%, and 5%. Pure unadulterated samples were used as well and in total, one hundred and twelve samples were procured for the study. NIR spectra were collected using a FT-NIR spectrometer operating in reflectance mode. Samples were scanned from 12000 cm-1 to 4000 cm -1 at 8 cm-1 resolution. Sixty-four scans were collected per reading and averaged into one spectrum. This process was repeated three times for each sample. In order to make the Raman spectrometer suitable for sample collection, a custom sample compartment was constructed that allowed a longer focal length collection lens to be fitted and a larger area of the sample to be scanned using a rotating sample holder. Spectra were acquired with an integration time of 5 seconds from 2000 cm-1 to 200 cm-1 at 10 cm-1 resolution. Two different chemometric software packages were used for both qualitative and quantitative multivariate analysis of both sets of spectra. Various pretreatments were applied to the NIR and Raman spectra before chemometric analysis. Principle Component Analysis (PCA) and Partial Least Squares Discriminate Analysis (PLS-DA) were used for qualitative analysis while Principal Components Regression (PCR) and Partial Least Squares (PLS) were used for quantitative analysis. The results shown below are the best obtained from the different pre-treated spectral data.
PCA (NIR and Raman)
Clear scores plot separation between pure and adulterated samples
| PLS-DA (NIR) | R² = 0.883 | |
| PLS (NIR) | R² = 0.993 | RMSEP= 0.141% |
| PCR (Raman) | R² = 0.971 | RMSEP= 0.592% |
The scores plot of a PCA shows grouping between data points and separation between two groups indicates the spectral data can be used to distinguish between the two groups. Likewise, PLS-DA uses an arbitrary grouping number for both sets of data and quantitatively predicts the number to choose the proper grouping from the data. PLS analysis of the NIR spectra showed the best results with Standard Normal Variate (SNV) and first derivative pre-processing, with high correlation and a very low RMSEP. PCR analysis of the Raman spectra showed the best results with Standard Normal Variate (SNV) and second derivative pre-processing. Correlation was still high but the RMSEP was over four times higher than the prediction error from the NIR spectra model. Results for both sets of spectra are considered good enough to use these models for screening for Sudan I Dye adulterant in chili powder, but the NIR method would be better applied in a real-time setting because of the lower prediction error and no need for a modified sample presentation method, which was the case when using the Raman instrument.
https://www.sciencedirect.com/science/article/pii/S0956713514001728
Rapid Authentication of Starch Adulterations in Ultrafine Granular Powder of Shanyao by Near-Infrared Spectroscopy Coupled with Chemometric Methods – Ma, Wang, Chen, et al., Food Chemistry 215 (2017) 108-115
Shanyao is a Chinese yam (not to be confused with the American and Canadian misnomer for sweet potato) rich in many nutritional properties. In herb form, it is used as a dietary supplement as well as a traditional Chinese medicine. Consumption of the ultrafine granular powder of Shanyao (UGPSY) is extensive and has high market demand, subjecting it to adulteration with cheaper materials such as cornstarch and wheat starch. Such adulteration degrades nutritional, physiochemical, and medicinal properties as well as creating economic loss and potential health hazards. Current methods for detecting adulteration in UGPSY include microscopic identification, HPLC, mass spectrometry, and DNA-based marker systems. These methods are often laborious, expensive, time-consuming, destructive, and difficult to implement on a large scale. NIR spectroscopy was examined as a method for determining the presence of cornstarch and wheat starch adulterants in UGPSY. Two batches of forty samples of UGPSY and locally purchased cornstarch and wheat starch were procured for the study. All samples were dried in an oven overnight and adulterated samples were prepared after drying. Adulterated samples were prepared using both types of starch and UGPSY at w/w% ranging from 10% to 95% adulterant. Pure samples were also set aside and all samples were sieved through a mill to make them homogenous. In total, one hundred and ninety-two samples were prepared. NIR spectra were collected in reflectance mode from 1100 nm to 2300 nm at 2 nm intervals. Thirty-two scans were collected for each reading and averaged into one spectrum. Various pre-processing treatments were applied to the NIR spectra before chemometric analysis. Discriminant analysis was performed using Principle Component Analysis (PCA) and Orthogonal Partial Least Squares Discriminant Analysis (OPLS-DA). Quantitative analysis of starch adulterant was performed using Partial Least Squares (PLS), Interval PLS (iPLS), and Synergy Interval PLS (siPLS). All types of samples were separated into a training set and test set in order to validate the models.
| OPLS-DA | ||
| siPLS (Cornstarch) | R² = 0.998 | RMSEP= 1.634% |
| siPLS (Wheat Starch) | R² = 0.997 | RMSEP= 2.045% |
PCA was unable to distinguish between pure samples and those adulterated with both cornstarch and wheat starch, especially at lower concentration. OPLS-DA helps interpret discriminant variation by selective wavelength analysis that removes wavelength ranges that are not correlated to class separation. The model showed that not only pure and adulterated UGSPY samples could be separated using the NIR spectra, but the cornstarch and wheat starch adulterated groups can be separated as well. Analysis of the test set samples showed that 100% correct classification was achieved from the OPLS-DA model. Both iPLS and siPLS use interval and selective wavelength analysis to improve results from a normal PLS model. The best results were shown using siPLS from the wavelengths that were chosen from the OPLS-DA model. Good correlation and low prediction error were shown for both adulterant models and the validity of the models was proven from prediction results using the test set samples. Overall, the results of this study prove the feasibility of detecting both cornstarch and wheat starch adulterants in UGSPY using NIR spectra and calibration models. These models show potential to replace the current expensive and time-consuming methods used for adulterant detection.
https://www.sciencedirect.com/science/article/pii/S030881461631189X
Detection of Starch Adulteration in Onion Powder by FT-NIR and FT-IR Spectroscopy – Lohumi, Lee, Kim, et al., Journal of Agricultural and Food Chemistry, 2014, 62, 9246-9251
Current methods that are used to authenticate spices are based on morphological, microscopic, chemical, or DNA-based characteristics. These methods are often inconvenient for routine sample analysis and can be time-consuming, expensive, and require a degree of expertise to perform the analysis. Chemical standards that are used for such analysis can be difficult to obtain or lack identifiable markers. Both FT-NIR and FT Mid-IR spectroscopy were examined to determine the feasibility of detecting starch adulteration in onion powder. Pure onion powder and 95% cornstarch were procured for the study. Before mixing, samples were dried in an oven for two hours to equilibrate the moisture since spectroscopic measurement is highly sensitive to differences in moisture. Pure samples of onion powder were set aside and adulterated mixtures were prepared by w/w% ranging from 1% to 35% starch adulterant. Ten samples of each of the pure and adulterated samples were prepared, making a total of one hundred and eighty samples. NIR spectra were collected in reflectance mode from 10000 cm-1 to 4000 cm-1 at 4 cm-1 intervals. Thirty-two scans were collected for each reading and averaged into one spectrum. Mid-IR spectra were collected using an ATR background from 4000 cm-1 to 650 cm-1 at 4 cm-1 intervals. Thirty-two scans were collected for each reading and averaged into one spectrum. Various pre-processing treatments were applied to both sets of spectra. Principle Component Analysis (PCA) was applied to determine wavelengths of interest and Partial Least Squares (PLS) analysis was performed to correlate the spectral data to the amount of starch adulterant in onion powder. Before chemometric analysis, seven types of each sample were separated into a calibration set and the remaining three types of each sample were set aside as a training set for validation analysis.
| PLS (FT-NIR) | R² = 0.98 | RMSEP= 1.18% |
| PLS (FT-IR) | R² = 0.90 | RMSEP= 3.12% |
Examination of PCA proved that the basis for visual differences in both sets of spectra were related to wavelengths known to absorb in chemical regions that make up the composition of starch. Likewise, the relevant wavelengths for the PLS regression models were contained in the same regions. Predictive analysis of the training set sample proved the validity of the models. The model from NIR spectra showed a much better predictive ability than the model from the Mid-IR spectra as well as much higher correlation and a lower RMSEP. The likely reasons for this is the ability of NIR light to penetrate far deeper into a sample than light in the Mid-IR region and a larger sampling area when using NIR. NIR light can penetrate several millimeters into a sample while Mid-IR penetration is typically measured in micrometers. The results here prove the feasibility of using spectroscopic data to monitor starch adulteration in onion powder, with NIR spectroscopy proving to be more accurate than Mid-IR spectroscopy. Similar models could be created for other types of spices using the same process to create calibrations, as it was shown that changes in starch clearly have an effect on both NIR and Mid-IR absorption that can be used to monitor for starch adulteration.
https://pubs.acs.org/doi/abs/10.1021/jf500574m
Near Infrared and Mid-Infrared Spectroscopy for the Quantification of Adulterants in Ground Black Pepper – McGoverin, September, Geladi, and Manley, Journal of Near Infrared Spectroscopy, 20, 521-528 (2012)
 The development of reliable methods to detect adulterants in food has received considerable interest in recent years. Spices in particular are considered economically worthwhile targets for adulteration due to both a high value per unit mass and specific desired flavor attributes. Vibrational spectroscopic methods are considered attractive techniques for detecting adulteration as they are information rich, fast, require little sample preparation, and are environmentally friendly. Both NIR and Mid-IR spectroscopy were examined as methods for determining the adulteration level of both buckwheat and millet in powdered black pepper. Four different batches of whole black pepper kernels were obtained from four different spice companies for the study. Whole kernels of buckwheat and millet were obtained as well. Before mixing, all samples were milled and oven dried. Each separate batch of black pepper was mixed with nineteen amounts of buckwheat and nineteen amounts of millet at 5% w/w intervals, resulting in samples from 5% to 95% of each type of adulterant. Pure amounts of each sample type were set aside as well. NIR hyperspectral data were collected using an imaging system. Images were acquired from 1000 nm to 2500 nm at 6.3 nm intervals and a spatial resolution of 300 µm x 300 µm. The images of all samples were examined to determine the heterogeneity. The spectra from each sample were averaged, resulting in a data set of one hundred and sixty-four samples with one spectrum per sample. Mid-IR spectra were collected using a diamond crystal background from 3999 cm-1 to 550 cm-1 using a spectral resolution of 4 cm-1 and a sampling interval of 1.42 cm-1. Thirty-two scans were collected per reading and averaged into one spectrum. Two duplicate spectra were collected per sample and averaged into a single spectrum. Various pre-processing treatments and selective wavelength ranges were used for both the NIR and Mid-IR spectra during chemometric analysis. Partial Least Squares (PLS) regression models were created correlating the spectral data to the percentage of adulterant in black pepper. All samples using three of the types of black pepper were used as a training set to create the calibration models and the fourth set was kept out of the model for a test set that was used to validate the models.
| NIR | R² = 0.99 | RMSEP= 2.70% |
| Mid-IR | R² = 0.96 | RMSEP= 7.25% |
The results shown above were the best obtained for each set of spectra and show that NIR spectroscopy is a much better suited technique to detect adulteration in black pepper than Mid-IR. The NIR PLS model used the wavelength range from 1100 nm to 2500 nm with Standard Normal Variate (SNV) and first derivative pre-processing. The Mid-IR model used the wavenumber ranges from 3050 cm-1 to 2800 cm-1 and 1770 cm-1 to 550 cm-1 with Multivariate Scatter Correction (MSC) pre-processing. The poorer correlation and prediction error in the Mid-IR model are a direct result of low light penetration, sample heterogeneity, and insufficient sampling area. The NIR modeling results are good enough to be used for process control purposes. NIR spectroscopy and calibration models can be used as a real-time, fast, and accurate tool for detecting both buckwheat and millet adulteration in ground black pepper requiring no sample preparation. This method has the potential to replace the time-consuming and expensive methods that are currently used for such analysis.
The Feasibility of Applying NIR and FT-IR Fingerprinting to Detect Adulteration in Black Pepper – Wilde, Haughey, Galvin-King, and Elliott, Food Control 100 (2019) 1-7
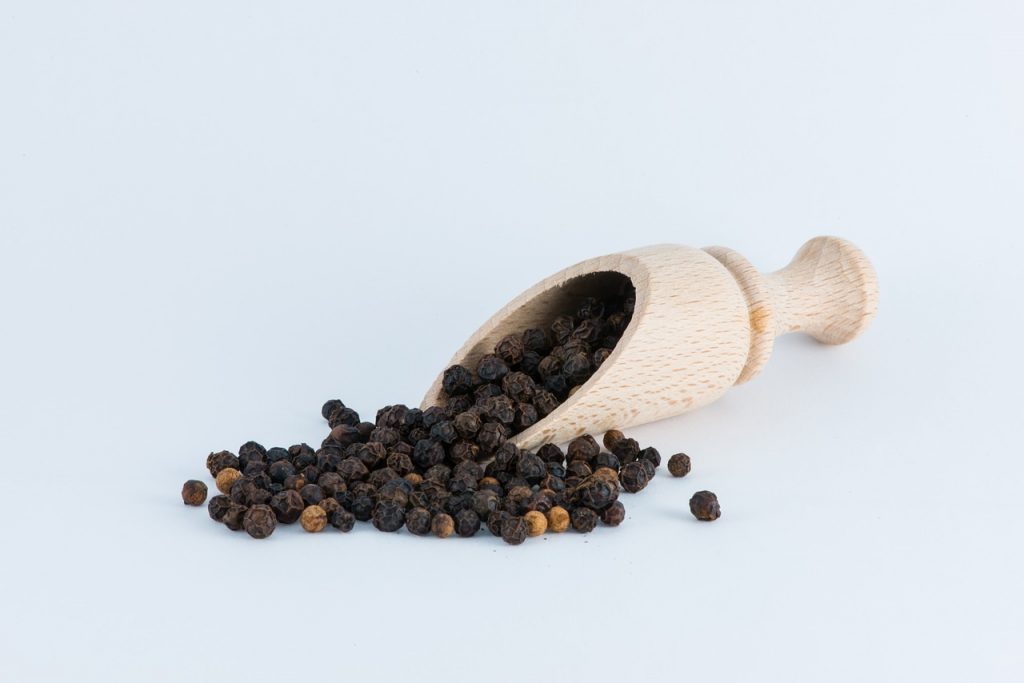
Black pepper is the most widely used spice in the world. It is cultivated in approximately twenty-six tropical countries, with India, Vietnam, and Indonesia being the main producers. It is estimated that in 2016, 430,000 tons were consumed worldwide with about 63,000 tons of that exported to Europe. The high value and complex supply chain of black pepper makes it especially vulnerable to adulteration. Two possible black pepper adulterants are papaya seeds and chili. Papaya seeds are cheap, widely available, and structurally resemble black pepper. Chili was discovered in market samples of black pepper during one study. Another form of adulteration that has been pointed out by the FDA in their guidance on authenticity of herbs and spices is extraneous matter from the same plant, referred to as spent, defatted, and depleted material. Current testing methods for black pepper adulterants are not only expensive and time-consuming, they lack the scope to adequately detect multiple forms of adulteration in the large global black pepper market. Spectroscopic methods have been shown to be low-cost, rapid, and comprehensive compared to traditional methods. The feasibility of using NIR and Mid-IR spectroscopy to detect economically motivated adulteration of black pepper was examined. After research and discussion with industry insiders, papaya seeds, chili, black pepper husk, and black pepper spent material were chosen as the adulterants for the study. A total of one-hundred and fifteen black pepper samples from six different countries were procured for the study. At least two different types of each adulterant were acquired. All samples were ground to a homogeneous powder before mixing. Three separate pepper pools were prepared by mixing different combinations of the black pepper samples. For each pool, pure samples were set aside and the remaining samples were spiked with each of the four adulterants from 10 g/100 g to 40 g/100 g to make the spiked samples. For both methods, spectra were collected of the pure black pepper samples, pure adulterant samples, and spiked samples. NIR spectra were collected from 12000 cm-1 to 4000 cm-1 at 8 cm-1 resolution. Thirty-two scans were collected per reading and averaged into one spectrum. Three replicates of each sample were scanned and averaged before data pre-processing. Mid-IR spectra were collected from 4000 cm-1 to 400 cm-1 using an ATR accessory. Thirty-two scans were collected per average at 4 cm-1 resolution. Different pre-processing methods were applied to both sets of data before chemometric analysis. Principle Component Analysis (PCA) was first conducted to analyze the differences in spectra of pure black pepper with different geographical origins as well the differences in pure black pepper vs. adulterated samples. The pure black pepper and pure adulterant spectra were used to create a binary classification Orthogonal Projections to Least Structures Discriminant Analysis (OPLS-DA) model. Forty-eight spectra of the spiked samples and thirty spectra of the pure black pepper samples were used as a test set to validate the model.
| NIR | R² = 0.93 |
| Adulteration 0% | Correct Classification: 90% |
| All Adulterants 10-40% | Correct Classification: 100% |
| Spent/Husk 10-20% | Correct Classification 100% |
| Spent/Husk 20-30% | Correct Classification 100% |
| Papaya/Chili 10-20% | Correct Classification 100% |
| Papaya/Chili 20-30% | Correct Classification 100% |
| Mid-IR | R² = 0.83 |
| Adulteration 0% | Correct Classification: 93% |
| All Adulterants 10-40% | Correct Classification: 98% |
| Spent/Husk 10-20% | Correct Classification 100% |
| Spent/Husk 20-30% | Correct Classification 100% |
| Papaya/Chili 10-20% | Correct Classification 92% |
| Papaya/Chili 10-30% | Correct Classification 100% |
Classification results for the test set data were excellent for the NIR model, with a lower correlation and higher prediction error for the Mid-IR model but still good. The analysis above shows the threshold of sensitivity that the predictivity of the model could reasonably be expected to meet. In practice, an adulteration level less than 10% would provide little economic benefit while a level higher than 40% would be high enough to risk the discovery of the adulterant by visualization alone. The most important conclusion is that the classification will work simply from a model created from pure black pepper samples and pure adulterants. In practice, many more types of black pepper and adulterants would need to be added to make a universal model robust enough to accurately detect and classify any adulterants. The research here shows great potential for finding adulterants in black pepper using spectroscopic methods.
https://www.sciencedirect.com/science/article/pii/S095671351830639X
Rapid Authentication and Quality Evaluation of Cinnamomum Verum Powder Using Near-Infrared Spectroscopy and Multivariate Analyses – Shawky, Selim, Planta Med 2018: 84: 1380-1387
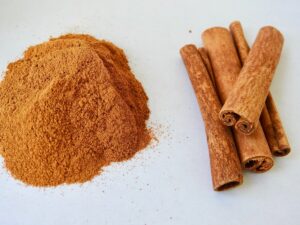 Ceylon Cinnamon is the inner bark of the tree of Cinnamomum Verum and is often referred to as “true cinnamon”. As well as being one of the tree species used for manufacture of high-quality cinnamon spice, it is widely incorporated in the medicinal and cosmetic industry. The bioactive content of cinnamon-based products has been of great interest to both manufacturers and consumers in recent years. Because Ceylon cinnamon is such a valuable product, it is often subjected to adulteration. Cinnamomum Cassia, known as Chinese Cassia, is closely related to Ceylon cinnamon but has a rougher, thicker, and less aromatic bark, making it a cheaper and lower quality product. Another method of adulteration is to add exhaustively extracted Ceylon cinnamon to genuine Ceylon cinnamon. In the case of Chinese Cassia, adulteration can be dangerous for human consumption because it contains high amounts of coumarin, a blood-thinning agent that can be toxic if consumed in excessive amounts. The only known methods that can distinguish between Ceylon cinnamon and Chinese Cassia are expensive and time-consuming, such as HPLC-MS. NIR spectroscopy was examined as a method for detecting both Chinese Cassia and exhaustively extracted Ceylon cinnamon adulterants in pure Ceylon cinnamon. Twenty-seven authenticated samples each of Ceylon cinnamon and Chinese Cassia were procured for the study. Samples were dried, powdered, and passed through a sieve. Exhaustively extracted samples were prepared by hydrodistillation from cinnamon barks and were subsequently dried and powdered. For both types of adulterant, samples were prepared by mixing with the pure samples from 5% to 95% at 5% intervals. Triplicate samples at each value were prepared in this fashion. NIR spectra were collected using an FT-NIR spectrometer from 8000 cm-1 to 4000 cm-1 at 16 cm-1 resolution. Sixty-four scans were collected per reading and averaged into one spectrum. This process was repeated three times for each sample and the three spectra were averaged into one spectrum before chemometric analysis. Standard Normal Variate (SNV) and first derivative pre-processing methods were used to eliminate baseline drift and enhance differences between the spectra. Principle Component Analysis (PCA) was used to analyze differences in the spectra between groups. A SIMCA classification model was created to determine the feasibility of separating pure Ceylon cinnamon, both adulterants, and the Ceylon cinnamon samples mixed with both adulterants. Partial Least Squares (PLS) regression models were created to correlate the NIR spectra to the amount of adulterant in the Ceylon cinnamon.
SIMCA:
100% correct classification of all samples
PLS:
| Chinese Cascia | R² = 0.988 | RMSEP= 0.041 %/g |
| Exhaustively Extracted | R² = 0.9871 | RMSEP= 0.048 %/g |
The results for the SIMCA model and both PLS models were excellent and proved the feasibility of using NIR spectra to identify and quantify both types of adulterants. Validation of the SIMCA model correctly classified all samples at a 95% confidence level. Cross validation of the PLS models provided independent predictions for all samples and confirmed the validity of the models. Most predictions had an error lower than 1% and no prediction had an error greater than 2%. NIR spectroscopy shows great potential for use as a screening tool to replace the current expensive and time-consuming methods for determining the presence of adulterant in the valuable Ceylon cinnamon.
FT-NIR Characterization with Chemometric Analyses to Differentiate Goldenseal from Common Adulterants – Liu, Finley, Betz, Brown, Fitoterapia 127 (2018) 81-88
Goldenseal is a native North American herb that has been popular since the 1970s and is mostly used for the antimicrobial properties of the roots and rhizomes. It is found in a wide range of products including eardrops, feminine cleansing products, cold and flu remedies, allergy relievers, laxatives, and digestion aids. In 2016, goldenseal had global sales over $31 million in the Nutrition Industry sector. It exists in both wild and cultivated form. The demand has led to a sharp reduction in wild goldenseal, even placing it on the endangered species list in some states, while cultivated goldenseal is both resource intensive and more expensive for both the producer and consumer. International trade requires a CITES (Convention for International Trade in Endangered Species of Wild Fauna and Flora) permit to ensure the plant is four years old and was legally obtained. Adulteration with visually similar but cheaper and more accessible plants has become prevalent. One test of market samples discovered that one in three goldenseal materials was mixed with the following plants: Oregon grape, yellow dock, yellow root, and coptis, all similar in morphology and phytochemistry to goldenseal. Visual inspection is often insufficient for discovering these adulterants, especially when the materials in trade have already been processed as biomass or extracts. Tests for some alkaloids that are unique to goldenseal are effective but expensive and time-consuming while requiring skilled technicians to implement them. NIR spectroscopy was examined as a method for detecting the presence of common adulterants in goldenseal. Plant materials of goldenseal, coptis, Oregon grape, yellow dock, and yellow root were purchased from the American Herbal Pharmacopeia and Chromadex. All varieties were authenticated using at least two methods outlined by authoritative references and verified by a Professor of Horticulture. All samples were ground into powder and twenty grams of each material was homogenized for the test. 1.5 grams were removed from each pool, sent for FT-NIR analysis, and returned to the pool. This process was replicated five times for each type of plant. NIR spectra were collected using an FT-NIR spectrometer from 8998 cm-1 to 4200 cm-1 using 8 cm-1 resolution and thirty-two scans per average. A theoretical adulteration was created using the goldenseal spectra and spectra of each adulterant. The 100% goldenseal spectrum was used with the 100% adulterant spectrum to create desired ratios. For example, 2% adulteration was calculated by the sum of 0.98 of the goldenseal spectrum and 0.02 of the adulterant spectrum. For each adulterant, this process created five spectra each at the following adulterant levels: 2%, 5%, 10%, 15%, 20%, 25%, 50%, 75%, and 95%. Various pre-processing algorithms were performed on the spectra before chemometric analysis. Three types of chemometric models were created for the purpose of differentiating pure goldenseal from the pure four adulterants and detecting the presence of an adulterant in goldenseal: Partial Least Squares (PLS), Soft Independent Modeling of Class Analogy (SIMCA), and Moving Window Principle Component Analysis (MW-PCA).
| All Three Models: | Successful separation of pure goldenseal and an adulterant amongst all adulterants |
| PLS: | Unable to accurately predict whether or not the tested materials were 100% target material or accurately quantify percentages of mixed materials |
| SIMCA: | Best results for detection of yellow root and Oregon grape – can detect both at 10% or higher |
| MW-PCA | Best results for detection of yellow dock and coptis – can detect yellow dock at 15% or higher and coptis at 5% or higher |
Analysis of all three models showed that they could successfully discriminate between the spectra of pure goldenseal and each adulterant. However, the results varied based on model type when attempting to classify an adulterated sample of goldenseal. PLS proved to be poor for quantifying the percentage of goldenseal and adulterant in an adulterated sample. Independent predictions of pure goldenseal using PLS ranged from 66% to 104%. Similar poor results occurred for predictions of pure adulterants and in the case of yellow root, the amount of goldenseal predicted was almost 20% despite no goldenseal being present in the sample. It is possible that the results will improve with more goldenseal samples in the calibration set and with actual mixing of the samples rather than calculating ratios of adulterant using the pure spectra of goldenseal and the adulterant. The study also did not attempt to create individual PLS models for each adulterant and golden seal. This analysis could potentially improve the results as well. Better results were obtained using the classification algorithms SIMCA and MW-PCA. Both types of models were analyzed for all four adulterants and as shown above, SIMCA gave better results for yellow root and Oregon grape while MW-PCA gave better results for yellow dock and coptis. The potential was demonstrated in this study to use NIR spectroscopy and chemometric modeling to detect adulteration in goldenseal but the results warrant careful analysis. As demonstrated by the varying results from different algorithms, the specific approach for creating models must be carefully evaluated and selected on a case-by-case basis if the desired results are to be achieved. Such models must be validated carefully before implementing them for real-time analysis.
https://www.sciencedirect.com/science/article/pii/S0367326X17316970
Near Infrared Spectroscopy Detection and Quantification of Herbal Medicines Adulterated with Sibutramine – da Silva, Honorato, Pimental, et al., Journal of Forensic Sciences, September 2015, Vol. 60, No. 5
There is an increasing demand for herbal medicines to treat obesity. The impression on consumers is that such medicines are safer than synthetic drugs for weight loss and have minimal side effects. However, a number of incidents have shown the detection of synthetic chemicals as an adulterant in herbal medicines. One such substance is sibutramine, an inhibitor of the neurotransmitters serotonin and norepinephrine which decrease appetite. Side effects include an increase in blood pressure and pulse rate as well as elevated risk of heart attack and stroke. Sibutramine has a difficult history including reports of health issues, studies showing the cardiovascular risks, and US Senate hearings, eventually resulting in the withdrawal of the product in the US market by its manufacturer Abbott Laboratories in 2010. In 2008 and 2009, the FDA both issued alerts and recalled products marketed as “herbal supplements” and “dietary supplements” for containing sibutramine. Similar incidents occurred in other countries. Despite the withdrawal of the product in the US market, sibutramine has continued to be found in dietary supplements as recently as 2018. Analytical methods have been developed and proven to be effective in detecting sibutramine adulteration. These include liquid chromatography with mass spectrometry (LC-MS), capillary electrophoresis (CE), and nuclear magnetic resonance (NMR). While effective, these methods are expensive, time-consuming, require the use of chemical reagents, destroy the samples tested, and are ill-suited to implement on a large scale for routine analysis. NIR spectroscopy was examined as a method for detecting sibutramine adulterant in herbal medicines which are intended for use as a weight loss supplement. Thirteen different commercial herbal medicine samples and pure sibutramine were procured for the study. A standard liquid chromatography method was employed to test the herbal medicines and sibutramine was found in four of them at the following concentrations (w/w): 0.018%, 0.033%, 0.358%, and 0.44%. For the nine pure samples, a portion was set aside of each and the rest were spiked with sibutramine at concentrations ranging from 1% to 6%. Both the originally adulterated and spiked samples were ground and homogenized. In total, fifty-five samples were used: nine pure herbal medicines, the four commercial samples found to be adulterated, and forty-two spiked samples. A FT-NIR spectrometer was used to collect NIR reflectance spectra from 14000 cm-1 to 4000 cm-1 at 2 cm-1 nominal resolution. One hundred twenty-eight scans were collected per reading and averaged into one spectrum. Each sample was collected in triplicate and the vial was removed and placed back in the sample holder before collecting a new spectrum. Various pre-processing methods were applied to the NIR spectra before chemometric analysis. Three separate modeling algorithms were applied. Partial Least Squares Discriminant Analysis (PLS-DA) was used to classify samples based on being pure or having an adulterant present. Partial Least Squares (PLS) and Multiple Linear Regression (MLR) were used to quantify the amount of sibutramine present in a sample.
| PLS-DA | 100% classification of validation set samples | |
| PLS | R² = 0.996 | RMSEP= 0.22% |
| MLR | R² = 0.996 | RMSEP= 0.18% |
All modeling results were excellent and proved the feasibility of using NIR spectroscopy and calibration models to detect sibutramine adulteration. PLS-DA assigns an arbitrary number to two groups and uses those numbers to classify the groups from NIR spectra. Ten adulterated and three non-adulterated samples were pulled from the model and their spectra were used as a validation set. All samples were classified correctly. PLS correlates a reference value to the NIR spectra and likewise, independent prediction results proved the validity of the model. In the case of MLR, selective wavelengths are chosen for the regression and the selected algorithm chose four individual wavelengths. Results were very similar to the PLS model and the difference can be considered statistically insignificant. The potential was shown for using NIR spectroscopy and calibration models as a real-time tool for the detection of sibutramine adulteration in herbal medicines. This method offers an alternative to traditional methods that are time-consuming, expensive, require the use of chemical reagents and skilled labor, and are unsuitable for implementing for large-scale testing.
https://onlinelibrary.wiley.com/doi/abs/10.1111/1556-4029.12884
The post Spices Adulterant Analysis appeared first on NIR-For-Food.
]]>The post Spices Analysis appeared first on NIR-For-Food.
]]>Introduction
Spices are aromatic plant substances used primarily for flavoring, coloring, or preserving food. They are known for their strong flavoring and antimicrobial properties. Since they are often used in small quantities, spices add few calories to food when used normally but can contribute high amounts of vitamins and minerals to the diet when used in larger quantities. Most spices have substantial antioxidants, mostly due to phenolic compounds like flavonoids. Flavor comes mostly from volatile oils that are prone to oxidation and evaporation. In addition to food uses, spices have also been used in medicine, religious rituals, cosmetics, and perfume production. There are a total of one hundred and nine varieties listed by the International Organization for Standardization (ISO). Despite a large global market, a high percentage of spices are produced by small-scale farmers for both local trading and exporting. The market was valued at nearly $7 billion in 2017 and has projected growth at a CAGR over 7% in coming years. Factors driving market growth include increased availability of international cuisine, increased consumer consumption of natural products and convenience foods, and a larger scope of new and attractive taste creations to meet consumer demand. Because spices are such a valuable product with both expected high demand and increased production in coming years, there is a need for quality control testing methods that are fast, non-invasive, and cost-effective. Good testing methods are especially important for determining spice authenticity and detecting adulteration. Spice adulteration can range from relatively harmless misrepresentation of geographical origin to deliberate and intentional addition of non-toxic or toxic products with the intent of economic gain. Methods of contamination by adulteration are constantly evolving and are difficult to assess visually. Current methods for determining spice adulteration are morphological, microscopic, chemical, or DNA based. These tests are usually expensive, time-consuming, and difficult to use on a large scale to determine the authenticity of a spice. Other constituents of interest in spices that present challenges in quality control testing include moisture, essential oils, protein, and elemental & mineral analysis. Spice blending takes place on a large scale for many shelf products and determining both the proper blending and blending endpoint is of great interest as well. NIR spectroscopy offers the advantages of being fast, non-invasive, and having the ability to determine multiple parameters of interest from a single measurement. In the sections below, numerous studies using NIR spectroscopy for determining spice authenticity and the detection of adulteration as well as measuring quality control parameters of interest are summarized and analyzed. As of this writing, there are no known studies to determine the feasibility of monitoring spice blending using spectroscopic methods. However, large spice companies are interested in finding new methods to determine the endpoint of spice blending. It is likely that studies will be conducted in the future to see if NIR spectroscopy is a feasible method for such measurements.
Analytes
- Paprika Adulteration with Sudan I Dye, Tomato Skin, and Brick Dust
- Chili Powder Adulteration with Sudan I Dye
- Ultrafine Granular Powder of Shanyao (UGPSY) Adulteration with Cornstarch and Wheat Starch
- Onion Powder Adulteration with Starch
- Black Pepper Adulteration with Buckwheat, Millet, Papaya Seeds, Chili, and Extraneous Matter
- Ceylon Cinnamon Adulteration with Chinese Cassia and Exhaustively Extracted Ceylon Cinnamon
- Curcuminoid
- Moisture
- Water Activity
- Protein
- Minerals (Calcium, Iron, Potassium
- Elemental Analysis (Carbon, Hydrogen, Nitrogen, Sulfur)
- Volatile/Essential Oils
- Piperine
Summary of Published Papers, Articles, and Reference Materials
Measurement of chemical parameters in major constituents of spices for quality control purposes has been studied using NIR spectroscopy. The results of most studies have been promising. Numerous adulterants in different spices and herbs were examined for analysis using NIR spectroscopy. Spices and herbs of interest that were tested for the feasibility of detecting adulterants include paprika, chili powder, Ultrafine Granular Powder of Shanyao (UGPSY), onion powder, and Ceylon cinnamon. Adulterants include Sudan I dye, tomato skin, brick dust, cornstarch, wheat starch, buckwheat, millet, papaya seeds, chili, and Chinese Cassia. In the case of black pepper and Ceylon cinnamon, extraneous and exhaustively extracted material were examined as well. All studies showed that the potential exists to use NIR spectroscopy as a fast and non-invasive screening tool for adulterants requiring no use of wet chemistry. Key ingredients in any plant analysis include moisture, water activity, protein, minerals such as Ca, Fe, and K as well as elemental analysis for C, H, N, and S. These constituents were examined in leaf powders. The feasibility was proven for the water measurements and protein but the results for minerals and elemental analysis were not sufficient to use NIR spectroscopy as a real-time screening tool. This was not surprising as minerals often show very little light absorption in the NIR wavelength range. Elements can only be detected using NIR spectroscopy by their effect on other compounds. While an indirect correlation is acceptable for such analysis, it is often difficult and models require extensive validation to ensure that the calibrations are legitimate. Volatile and essential oils are crucial in spice, herb, and plant analysis as they often make up some of the valuable properties in them. Piperine, essential oil content and individual essential oils in both whole peppercorns and pepper oil were examined using three different spectroscopic methods: NIR, Mid-IR, and Raman. All three showed good correlation in the pepper oil models but only the NIR models were sufficiently robust to analyze individual essential oils in the whole peppercorns. One study compared the use of an FT-NIR laboratory spectrometer with a hand-held MEMS NIR spectrometer to measure essential oil content in oregano. The results from the FT-NIR spectrometer were much better and the handheld instrument proved insufficient for real-time application, most likely due to high noise and a limited wavelength range. Another study compared NIR and Mid-IR spectroscopy to analyze essential oils in thyme, oregano, and chamomile. Both spectroscopic methods showed excellent results. Mentha Haplocalyx is an important traditional Chinese medicine and has many other applications as well, including in the food and spice industries. Two separate modeling algorithms were examined for determining volatile oil content from the NIR spectra of Mentha Haplocalyx samples. The results were excellent and proved the feasibility of measuring volatile oil content from NIR spectra and a calibration model.
Scientific References and Statistics
Fast Detection of Paprika Adulteration Using FT-NIR Spectroscopy – Galaxy Scientific, Inc., Oct. 17, 2016
Spice adulteration goes back thousands of years and can take on different forms which are always evolving. Many forms of adulteration are relatively harmless in a health sense but can have economic consequences, such as misrepresentation of the geographical origin of a product. However, when adulteration involves contamination with toxic products, the consequences can be deadly. One real-life incident was the discovery of the carcinogenic and banned food additive Sudan I dye in Worcestershire sauce, which was added by way of adulterated chili powder. Food adulteration is at the top of the list when it comes to safety concerns, and there is a need for fast, non-invasive testing for adulterants as current methods are time-consuming, expensive, and often require the use of wet chemistry. One method that has been examined is NIR spectroscopy, offering the advantages of no sample preparation, high speed, and ease of use without chemicals.
A study was conducted at Galaxy Scientific in Nashua, NH, to use FT-NIR spectroscopy to determine the presence of adulterants in paprika using tomato skin, red brick dust, and Sudan I dye. Four different paprika samples were purchased: McCormick Paprika, McCormick Gourmet Hot Hungarian Paprika, Morton & Bassett Paprika, and Spice Chain Pride of Szeged Hungarian Style Paprika. Sudan I with a dye content greater than 95% was purchased from Sigma Aldrich. Red brick was obtained from Home Depot and ground into a fine powder. Tomato was purchased from a local market, and the skin was peeled, dried, and ground into a fine powder. Samples were mixed in the following concentrations of each adulterant:
| Sudan I Dye: | 0.11, 0.62, 0.88, 4.58, 10.32 (% w/w) |
| Tomato Skin: | 0.11, 0.52, 1.23, 5.54, 10.86 (% w/w) |
| Brick Dust: | 0.1, 0.68, 1.04, 4.77, 14.12 (% w/w) |
Two different Galaxy Scientific QuasIR 3000 spectrometers were used to collect FT-NIR spectra of the adulterated samples as well as of each pure paprika and adulterant sample. Samples were stored in 25 X 95 mm glass vials and placed on top of the 23 mm sample window of the integrating sphere for scanning. FT-NIR spectra were collected from 10000 cm-1to 4000 cm-1using 4 cm-1 resolution and two hundred scans per average. Each sample was scanned twice using each spectrometer and the vial was shaken between each measurement. Spectra were averaged for each sample before the visual examination and chemometric analysis.
Visual examination of the NIR spectra for all four paprika samples and all three adulterants showed distinct absorbance bands except in the case of brick dust, which was expected because it is an inorganic material. The main absorbance band in brick dust is an O-H band due to moisture. Sudan, I dye has distinct absorbance bands around 4600 cm-1 and 6000 cm-1. Because both are natural organic products, the spectral features of tomato skin are very similar to paprika. The Advanced ID CLS algorithm was used to analyze the NIR spectra of the paprika and adulterant mixtures for chemometric analysis.
| Sudan I Dye: |
| R2> 0.95 for 0.11%, 0.62%, 0.88%, 4.58%, and 10.32% samples |
| Tomato Skin: |
| R2> 0.93 for 0.52%, 1.23%, 5.54%, and 10.86% samples |
| Brick Dust: |
| R2> 0.95 for 4.77% and 14.12% samples |
The Advanced ID algorithm extracts a spectrum from a mixture using the spectra of each component of the mixture. Clear differences were observed in the spectra of the paprika mixed with different concentrations of Sudan I dye, especially in the distinctive absorbance region for Sudan I dye between 6200 cm-1 and 5800 cm-1. The high correlation coefficient shown by the algorithm indicates that Sudan I dye adulterant in paprika can be detected at a concentration as low as 0.1%. In the case of tomato skin, first derivative processing of the spectra was used because the absorbance spectra are so similar. Good correlation was shown if the tomato skin concentration was above 0.5%, and this is the sensitivity for detecting tomato skin adulterant in paprika. The lack of distinctive absorbance features in NIR spectra of brick dust made it more difficult to detect low concentrations of adulteration, but results still showed good correlation for samples with 5% or higher amounts of brick dust adulterant. In practice, any real adulteration contamination will be at a high concentration to make sense economically, so the FT-NIR spectra and Advanced ID algorithm can be used as a fast screening tool to detect adulteration in Paprika with no sample preparation or use of wet chemistry.
FULL PAPER: https://galaxy-scientific.com/wp-content/uploads/2016/10/GS-A-Paprika-1.1EN.pdf
Galaxy Scientific QuasIR and Other Products:https://galaxy-scientific.com/products/
Chili Powder Analysis
The Feasibility of Using Near-Infrared and Raman Spectroscopic Techniques to Detect Fraudulent Adulteration of Chili Powders with Sudan Dye – Haughey, Galvin-King, Ho, et al., Food Control 48 (2015) 75-83
Chili powder is a valuable and globally traded commodity which is adulterated with Sudan I dye. Sudan I dye is classified as a Class 3 carcinogen and banned as a food additive. One known incident was the discovery of contaminated Worcestershire Sauce, which was made from chili powder adulterated with Sudan I Dye. Methods of adulteration are continually evolving, and thus, there is a demand for new testing methods that are fast and require little or no sample preparation. Both NIR and Raman spectroscopy were examined as screening tools for detecting the adulteration of chili powder with Sudan I dye. Commercial chili powder samples were purchased from local markets for the study. Different samples were spiked with Sudan I dye at the following w/w concentrations: 0.1%. 0.2%. 0.5%, 1%, 2.5%, and 5%. Pure unadulterated samples were used as well, and in total, one hundred and twelve samples were procured for the study. NIR spectra were collected using an FT-NIR spectrometer operating in reflectance mode. Samples were scanned from 12000 cm-1 to 4000 cm-1 at 8 cm-1 resolution. Sixty-four scans were collected per reading and averaged into one spectrum. This process was repeated three times for each sample. To make the Raman spectrometer suitable for sample collection, a custom sample compartment was constructed that allowed a longer focal length collection lens to be fitted and a larger area of the sample to be scanned using a rotating sample holder. Spectra were acquired with an integration time of five seconds from 2000 cm-1 to 200 cm-1 at 10 cm-1 resolution. Two different chemometric software packages were used for both qualitative and quantitative multivariate analysis of both sets of spectra. Various pretreatments were applied to the NIR and Raman spectra before chemometric analysis. Principle Component Analysis (PCA) and Partial Least Squares Discriminate Analysis (PLS-DA) were used for qualitative analysis while Principal Components Regression (PCR) and Partial Least Squares (PLS) were used for quantitative analysis. The results shown below are the best obtained from the different pre-treated spectral data.
| PCA (NIR and Raman) | ||
|---|---|---|
| Clear scores plot separation between pure and adulterated samples | ||
| PLS-DA (NIR) | R² = 0.883 | |
| PLS (NIR) | R²= 0.993 | RMSEP = 0.141% |
| PCR (Raman) | R² = 0.993 | RMSEP = 0.592% |
The scores plot of a PCA shows grouping between data points and separation between two groups indicates the spectral data can be used to distinguish between the two groups. Likewise, PLS-DA uses an arbitrary grouping number for both sets of data and quantitatively predicts the number to choose the proper grouping from the data. PLS analysis of the NIR spectra showed the best results with Standard Normal Variate (SNV) and first derivative pre-processing, with high correlation and a very low RMSEP. PCR analysis of the Raman spectra showed the best results with Standard Normal Variate (SNV) and the second derivative pre-processing. The correlation was still high, but the RMSEP was over four times higher than the prediction error from the NIR spectra model. Results for both sets of spectra are considered good enough to use these models for screening for Sudan I Dye adulterant in chili powder, but the NIR method would be better applied in a real-time setting because of the lower prediction error and no need for a modified sample presentation method, which was the case when using the Raman instrument.
https://www.sciencedirect.com/science/article/pii/S0956713514001728
Shanyao Analysis
Rapid Authentication of Starch Adulterations in Ultrafine Granular Powder of Shanyao by Near-Infrared Spectroscopy Coupled with Chemometric Methods – Ma, Wang, Chen, et al., Food Chemistry 215 (2017) 108-115
Shanyao is a Chinese yam (not to be confused with the American and Canadian misnomer for sweet potato) rich in many nutritional properties. In herb form, it is used as a dietary supplement as well as traditional Chinese medicine. Consumption of the ultrafine granular powder of Shanyao (UGPSY) is extensive and has high market demand, subjecting it to adulteration with cheaper materials such as cornstarch and wheat starch. Such adulteration degrades nutritional, physiochemical, and medicinal properties as well as creating economic loss and potential health hazards. Current methods for detecting adulteration in UGPSY include microscopic identification, HPLC, mass spectrometry, and DNA-based marker systems. These methods are often laborious, expensive, time-consuming, destructive, and difficult to implement on a large scale. NIR spectroscopy was examined as a method for determining the presence of cornstarch and wheat starch adulterants in UGPSY. Two batches of forty samples of UGPSY and locally purchased cornstarch and wheat starch were procured for the study. All samples were dried in an oven overnight, and adulterated samples were prepared after drying. Adulterated samples were prepared using both types of starch and UGPSY at w/w% ranging from 10% to 95% adulterant. Pure samples were also set aside, and all samples were sieved through a mill to make them homogenous. In total, one hundred and ninety-two samples were prepared. NIR spectra were collected in reflectance mode from 1100 nm to 2300 nm at 2 nm intervals. Thirty-two scans were obtained for each reading and averaged into one spectrum. Various pre-processing treatments were applied to the NIR spectra before chemometric analysis. Discriminant analysis was performed using Principle Component Analysis (PCA) and Orthogonal Partial Least Squares Discriminant Analysis (OPLS-DA). Quantitative analysis of starch adulterant was performed using Partial Least Squares (PLS), Interval PLS (iPLS), and Synergy Interval PLS (siPLS). All types of samples were separated into a training set and test set to validate the models.
| OPLS-DA | R2=0.868 | |
| siPLS (Cornstarch) | R2=0.998 | RMSEP=1.634% |
| siPLS (Wheat Starch | R2=0.997 | RMSEP=2.045% |
PCA was unable to distinguish between pure samples and those adulterated with both cornstarch and wheat starch, especially at a lower concentration. OPLS-DA helps interpret discriminant variation by selective wavelength analysis that removes wavelength ranges that are not correlated to class separation. The model showed that not only pure and adulterated UGSPY samples could be separated using the NIR spectra, but the cornstarch and wheat starch adulterated groups can be separated as well. Analysis of the test set samples showed that 100% correct classification was achieved from the OPLS-DA model. Both iPLS and siPLS use interval and selective wavelength analysis to improve results from a normal PLS model. The best results were shown using siPLS from the wavelengths that were chosen from the OPLS-DA model. Good correlation and low prediction error were shown for both adulterant models, and the validity of the models was proven from prediction results using the test set samples. Overall, the results of this study prove the feasibility of detecting both cornstarch and wheat starch adulterants in UGSPY using NIR spectra and calibration models. These models show the potential to replace the current expensive and time-consuming methods used for adulterant detection.
https://www.sciencedirect.com/science/article/pii/S030881461631189X
Onion Powder Analysis
Detection of Starch Adulteration in Onion Powder by FT-NIR and FT-IR Spectroscopy – Lohumi, Lee, Kim, et al., Journal of Agricultural and Food Chemistry, 2014, 62, 9246-9251
Current methods that are used to authenticate spices are based on morphological, microscopic, chemical, or DNA-based characteristics. These methods are often inconvenient for routine sample analysis and can be time-consuming, expensive, and require a degree of expertise to perform the analysis. Chemical standards that are used for such analysis can be difficult to obtain or lack identifiable markers. Both FT-NIR and FT Mid-IR spectroscopy were examined to determine the feasibility of detecting starch adulteration in onion powder. Pure onion powder and 95% cornstarch were procured for the study. Before mixing, samples were dried in an oven for two hours to equilibrate the moisture since the spectroscopic measurement is highly sensitive to differences in moisture. Pure samples of onion powder were set aside, and adulterated mixtures were prepared by w/w% ranging from 1% to 35% starch adulterant. Ten samples of each of the pure and adulterated samples were prepared, making a total of one hundred and eighty samples. NIR spectra were collected in reflectance mode from 10000 cm-1 to 4000 cm-1 at 4 cm-1 intervals. Thirty-two scans were collected for each reading and averaged into one spectrum. Mid-IR spectra were collected using an ATR background from 4000 cm-1 to 650 cm-1 at 4 cm-1 intervals. Thirty-two scans were collected for each reading and averaged into one spectrum. Various pre-processing treatments were applied to both sets of spectra. Principle Component Analysis (PCA) was applied to determine wavelengths of interest and Partial Least Squares (PLS) analysis was performed to correlate the spectral data to the amount of starch adulterant in onion powder. Before chemometric analysis, seven types of each sample were separated into a calibration set, and the remaining three types of each sample were set aside as a training set for validation analysis.
| PLS (FT-NIR) | R2=0.98 | RMSEP=1.18% |
| PLS (FT-IR) | R2=0.90 | RMSEP=3.12% |
Examination of PCA proved that the basis for visual differences in both sets of spectra were related to wavelengths known to absorb in chemical regions that make up the composition of starch. Likewise, the relevant wavelengths for the PLS regression models were contained in the same regions. Predictive analysis of the training set sample proved the validity of the models. The model from NIR spectra showed a much better predictive ability than the model from the Mid-IR spectra as well as much higher correlation and a lower RMSEP. The likely reasons for this are the ability of NIR light to penetrate far deeper into a sample than light in the Mid-IR region and a larger sampling area when using NIR. NIR light can penetrate several millimeters into a sample while Mid-IR penetration is typically measured in micrometers. The results here prove the feasibility of using spectroscopic data to monitor starch adulteration in onion powder, with NIR spectroscopy proving to be more accurate than Mid-IR spectroscopy. Similar models could be created for other types of spices using the same process to create calibrations, as it was shown that changes in starch affect both NIR and Mid-IR absorption that can be used to monitor for starch adulteration.
https://pubs.acs.org/doi/abs/10.1021/jf500574m
Ground Black Pepper Analysis
Near Infrared and Mid-Infrared Spectroscopy for the Quantification of Adulterants in Ground Black Pepper – McGoverin, September, Geladi, and Manley, Journal of Near Infrared Spectroscopy, 20, 521-528 (2012)
The development of reliable methods to detect adulterants in food has received considerable interest in recent years. Spices, in particular, are considered economically worthwhile targets for adulteration due to both a high value per unit mass and specific desired flavor attributes. Vibrational spectroscopic methods are considered attractive techniques for detecting adulteration as they are information-rich, fast, require little sample preparation, and are environmentally friendly. Both NIR and Mid-IR spectroscopy were examined as methods for determining the adulteration level of both buckwheat and millet in powdered black pepper. Four different batches of whole black pepper kernels were obtained from four different spice companies for the study. Whole kernels of buckwheat and millet were obtained as well. Before mixing, all samples were milled, and oven-dried. Each separate batch of black pepper was mixed with nineteen amounts of buckwheat and nineteen amounts of millet at 5% w/w intervals, resulting in samples from 5% to 95% of each type of adulterant. Pure amounts of each sample type were set aside as well. NIR hyperspectral data were collected using an imaging system. Images were acquired from 1000 nm to 2500 nm at 6.3 nm intervals and a spatial resolution of 300 µm x 300 µm. The images of all samples were examined to determine the heterogeneity. The spectra from each sample were averaged, resulting in a data set of one hundred and sixty-four samples with one spectrum per sample. Mid-IR spectra were collected using a diamond crystal background from 3999 cm-1 to 550 cm-1 using a spectral resolution of 4 cm-1 and a sampling interval of 1.42 cm-1. Thirty-two scans were collected per reading and averaged into one spectrum. Two duplicate spectra were collected per sample and averaged into a single spectrum. Various pre-processing treatments and selective wavelength ranges were used for both the NIR and Mid-IR spectra during chemometric analysis. Partial Least Squares (PLS) regression models were created correlating the spectral data to the percentage of adulterant in black pepper. All samples using three of the types of black pepper were used as a training set to create the calibration models, and the fourth set was kept out of the model for a test set that was used to validate the models.
| NIR | R2=0.99 | RMSEP=2.70% |
| Mid-IR | R2=0.96 | RMSEP=7.25% |
The results shown above were the best obtained for each set of spectra and show that NIR spectroscopy is a much better-suited technique to detect adulteration in black pepper than Mid-IR. The NIR PLS model used the wavelength range from 1100 nm to 2500 nm with Standard Normal Variate (SNV) and first derivative pre-processing. The Mid-IR model used the wavenumber ranges from 3050 cm-1to 2800 cm-1and 1770 cm-1to 550 cm-1with Multivariate Scatter Correction (MSC) pre-processing. The poorer correlation and prediction error in the Mid-IR model is a direct result of low light penetration, sample heterogeneity, and insufficient sampling area. The NIR modeling results are good enough to be used for process control purposes. NIR spectroscopy and calibration models can be used as a real-time, fast, and accurate tool for detecting both buckwheat and millet adulteration in ground black pepper requiring no sample preparation. This method has the potential to replace the time-consuming and expensive methods that are currently used for such analysis.
https://journals.sagepub.com/doi/10.1255/jnirs.1008
The Feasibility of Applying NIR and FT-IR Fingerprinting to Detect Adulteration in Black Pepper – Wilde, Haughey, Galvin-King, and Elliott, Food Control 100 (2019) 1-7
Black pepper is the most widely used spice in the world. It is cultivated in approximately twenty-six tropical countries, with India, Vietnam, and Indonesia being the main producers. It is estimated that in 2016, 430,000 tons were consumed worldwide with about 63,000 tons of that exported to Europe. The high value and complex supply chain of black pepper make it especially vulnerable to adulteration. Two possible black pepper adulterants are papaya seeds and chili. Papaya seeds are cheap, widely available, and structurally resemble black pepper. Chili was discovered in market samples of black pepper during one study. Another form of adulteration that has been pointed out by the FDA in their guidance on the authenticity of herbs and spices is an extraneous matter from the same plant, referred to as spent, defatted, and depleted material. Current testing methods for black pepper adulterants are not only expensive and time-consuming, but they also lack the scope to adequately detect multiple forms of adulteration in the large global black pepper market. Spectroscopic methods are low-cost, rapid, and comprehensive compared to traditional methods. The feasibility of using NIR and Mid-IR spectroscopy to detect economically motivated adulteration of black pepper was examined. After research and discussion with industry insiders, papaya seeds, chili, black pepper husk, and black pepper spent material were chosen as the adulterants for the study.
A total of one-hundred and fifteen black pepper samples from six different countries were procured for the study. At least two different types of each adulterants were acquired. All samples were ground to a homogeneous powder before mixing. Three separate pepper pools were prepared by mixing different combinations of the black pepper samples. For each pool, pure samples were set aside, and the remaining samples were spiked with each of the four adulterants from 10 g/100 g to 40 g/100 g to make the spiked samples. For both methods, spectra were collected of the pure black pepper samples, pure adulterant samples, and spiked samples. NIR spectra were collected from 12000 cm-1 to 4000 cm-1 at 8 cm-1 resolution. Thirty-two scans were collected per reading and averaged into one spectrum. Three replicates of each sample were scanned and averaged before data pre-processing. Mid-IR spectra were collected from 4000 cm-1 to 400 cm-1 using an ATR accessory. Thirty-two scans were collected per average at 4 cm-1 resolution. Different preprocessing methods were applied to both sets of data before the chemometric analysis. Principle Component Analysis (PCA) was first conducted to analyze the differences in spectra of pure black pepper with different geographical origins as well as the differences in pure black pepper vs. adulterated samples. The pure black pepper and pure adulterant spectra were used to create a binary classification Orthogonal Projections to Least Structures Discriminant Analysis (OPLS-DA) model. Forty-eight spectra of the spiked samples and thirty spectra of the pure black pepper samples were used as a test set to validate the model.
| NIR: | R2= 0.93 | |
| Adulteration 0% | Correct Classification: | 90% |
| All Adulterants 10-40% | Correct Classification: | 100% |
| Spent/Husk 10-20% | Correct Classification: | 100% |
| Spent/Husk 20-30% | Correct Classification: | 100% |
| Papaya/Chili 10-20% | Correct Classification: | 100% |
| Papaya/Chili 20-30% | Correct Classification: | 100% |
Classification results for the test set data were excellent for the NIR model, with a lower correlation and higher prediction error for the Mid-IR model but still good. The analysis above shows the threshold of sensitivity that the predictivity of the model could reasonably be expected to meet. In practice, an adulteration level of less than 10% would provide a little economic benefit while a level higher than 40% would be high enough to risk the discovery of the adulterant by visualization alone. The most important conclusion is that the classification will work simply from a model created from pure black pepper samples and pure adulterants. In practice, many more types of black pepper and adulterants would need to be added to make a universal model robust enough to detect and classify any adulterants accurately. The research here shows great potential for finding adulterants in black pepper using spectroscopic methods.
https://www.sciencedirect.com/science/article/pii/S095671351830639X
Cinnamomum Verum Powder Analysis
Rapid Authentication and Quality Evaluation of Cinnamomum Verum Powder Using Near-Infrared Spectroscopy and Multivariate Analyses – Shawky, Selim, Planta Med 2018: 84: 1380-1387
Ceylon Cinnamon is the inner bark of the tree of Cinnamomum Verum and is often referred to as “true cinnamon.” As well as being one of the tree species used for the manufacture of high-quality cinnamon spice, it is widely incorporated in the medicinal and cosmetic industry. The bioactive content of cinnamon-based products has been of great interest to both manufacturers and consumers in recent years. Because Ceylon cinnamon is such a valuable product, it is often subjected to adulteration. Cinnamomum Cassia, known as Chinese Cassia, is closely related to Ceylon cinnamon but has a rougher, thicker, and less aromatic bark, making it a cheaper and lower quality product. Another method of adulteration is to add exhaustively extracted Ceylon cinnamon to genuine Ceylon cinnamon. In the case of Chinese Cassia, adulteration can be dangerous for human consumption because it contains high amounts of coumarin, a blood-thinning agent that can be toxic if consumed in excessive amounts. The only known methods that can distinguish between Ceylon cinnamon and Chinese Cassia are expensive and time-consuming, such as HPLC-MS. NIR spectroscopy was examined as a method for detecting both Chinese Cassia and exhaustively extracted Ceylon cinnamon adulterants in pure Ceylon cinnamon. Twenty-seven authenticated samples each of Ceylon cinnamon and Chinese Cassia were procured for the study. Samples were dried, powdered, and passed through a sieve. Exhaustively extracted samples were prepared by hydrodistillation from cinnamon barks and were subsequently dried and powdered. For both types of adulterant, samples were prepared by mixing with the pure samples from 5% to 95% at 5% intervals. Triplicate samples at each value were prepared in this fashion. NIR spectra were collected using an FT-NIR spectrometer from 8000 cm-1 to 4000 cm-1 at 16 cm-1 resolution. Sixty-four scans were obtained per reading and averaged into one spectrum. This process was repeated three times for each sample, and the three spectra were averaged into one spectrum before chemometric analysis. Standard Normal Variate (SNV) and first derivative pre-processing methods were used to eliminate baseline drift and enhance differences between the spectra. Principle Component Analysis (PCA) was used to analyze differences in the spectra between groups. A SIMCA classification model was created to determine the feasibility of separating pure Ceylon cinnamon, both adulterants, and the Ceylon cinnamon samples mixed with both adulterants. Partial Least Squares (PLS) regression models were created to correlate the NIR spectra to the amount of adulterant in the Ceylon cinnamon.
| SIMCA: |
| 100% correct classification of all samples |
| PLS: | ||
| Chinese Cascia | R2=0.988 | RMSEP=0.041 %/g |
| Exhaustively Extracted | R2=0.9871 | RMSEP=0.048 %/g |
The results for the SIMCA model and both PLS models were excellent and proved the feasibility of using NIR spectra to identify and quantify both types of adulterants. Validation of the SIMCA model correctly classified all samples at a 95% confidence level. Cross-validation of the PLS models provided independent predictions for all samples and confirmed the validity of the models. Most predictions had an error lower than 1% and no prediction had an error greater than 2%. NIR spectroscopy shows great potential for use as a screening tool to replace the current expensive and time-consuming methods for determining the presence of adulterant in the valuable Ceylon cinnamon.
Turmeric Analysis
Near-Infrared Reflectance Spectroscopy as a Rapid and Non-Destructive Analysis Tool for Curcuminoids in Turmeric – Kim, Lee, Shin, and Shin, Phytochemical Analysis, 2014, 25, 445-452
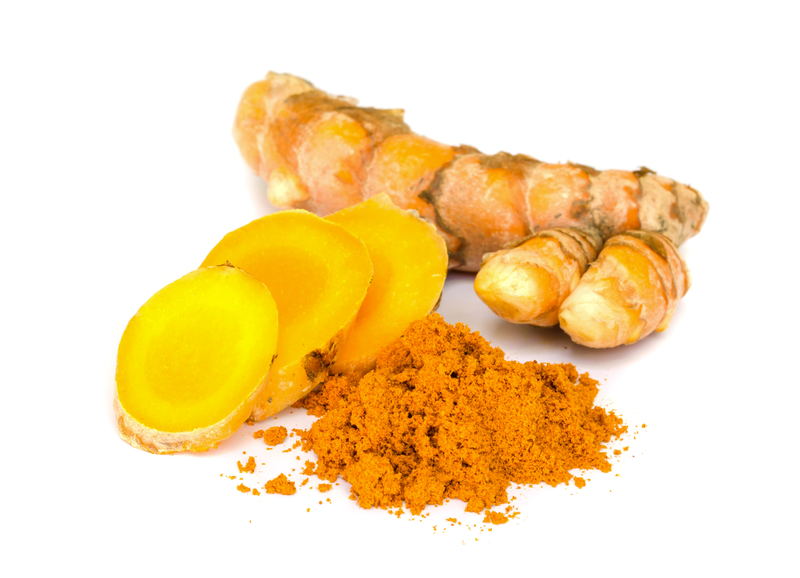
Tumeric has been widely used in curry powders as the main spice ingredient for centuries. It is mostly cultivated in India and is also cultivated in China, Indonesia, Jamaica, and Peru. Curcuminoids are the major components of turmeric. They are known to have a strong range of health benefits resulting from antioxidant activities. Curcumin is the major component with demethoxycurcumin and bidemethoxycurcumin as secondary components. Studies have shown that the antioxidant properties of curcumin have chemotherapeuric and chemopreventative effects, making it not only a valuable component of curry spice but a valuable medicine as well. Conventional methods such as HPLC for analyzing curcuminoids are time-consuming and expensive. NIR spectroscopy was examined as a method for determining total curcuminoid, curcumin, demethoxycurcumin, and bidemethoxycurcumin in crude turmeric powder. One hundred twenty-nine turmeric samples from India were procured for the study. HPLC was performed to determine each of the three curcumin components by weight, and total curcuminoids were expressed as the sum of them. After HPLC analysis, samples were scanned in reflectance mode using a NIR spectrometer from 1100 nm to 2500 nm at 2 nm intervals. Twenty-five scans were collected per reading and averaged into one spectrum. Various pre-processing treatments were performed on the data before the chemometric analysis. Both Partial Least Squares (PLS) and Principal Component Regression (PCR) were performed on all processed data to correlate the NIR spectra to the constituents of interest. Modeling results were better for PLS. Shown below are the best results for each constituent.
| PLS: | ||
|---|---|---|
| Total Curcuminoids: | R²=0.922 | RMSEP=0.178 g/100 g |
| Curcumin: | R²=0.929 | RMSEP=0.106 g/100 g |
| Demethoxycurcumin: | R²=0.917 | RMSEP=0.049 g/100 g |
| Bisdemethoxycurcumin: | R²=0.943 | RMSEP=0.025 g/100 g |
Modeling results for all constituents were good, and the validity of the models was confirmed by both cross-validation and an independent test set of samples that were predicted from their NIR spectra using the calibration models. The NIR method is a good alternative to the HPLC method and has many additional benefits. Samples can be analyzed in less than two minutes as opposed to hours for HPLC. No wet chemistry or extensive sample preparation is required. NIR spectroscopy also does not require highly skilled technicians to perform the analysis. Overall, it can be concluded that NIR spectroscopy is an excellent alternative to HPLC for analyzing curcuminoids in turmeric.
https://onlinelibrary.wiley.com/doi/abs/10.1002/pca.2514
Moringa Oleifera Leaf Powders (MOLP) Analysis
NIR Spectroscopy for the Quality Control of Moringa Oleifera Leaf Powders: Prediction of Minerals, Protein, and Moisture Contents – Rebufa, Pany, Bombarda, Food Chemistry 261 (2018) 311-321
Moringa Oleifera Leaf Powders (MOLP) come from a multipurpose tree that is grown in tropical countries around the world. Many parts of the tree are used for medicinal purposes, and the leaves are known to be rich in nutrients and have potential health benefits. They can be consumed either cooked or as a raw dried powder. In recent years, MOLP has been distributed globally and marketed as a green food supplement. India is the primary exporter, and it is well known that nutritional components vary depending on where it is grown. There are often marked differences in the concentration of proteins and minerals, and it is unclear why this happens. In addition, moisture content and water activity (partial vapor pressure of water in a substance divided by the standard state partial vapor pressure of water) are important in determining sorption isotherms, defined as water activity vs. moisture content. Sorption isotherms are a useful tool for predicting moisture changes & shelf life, optimizing drying processes, and establishing proper transportation and storage methods. NIR spectroscopy was examined as a method for determining moisture, water activity, protein, mineral analysis, and elemental analysis in MOLP. Fresh leaves from eight different countries and commercial MOLP from nine different countries were procured for the study. The fresh leaves were prepared as powder according to normal processing procedures. Reference tests were conducted on all samples for moisture, water activity, protein, mineral content (Ca, Fe, K), and elemental content (C, H, N, and S).
NIR spectra were collected using an FT-NIR spectrometer from 10000 cm-1to 4000 cm-1at 4 cm-1resolution. One hundred scans were obtained per reading and averaged into one spectrum. This process was repeated three times for each sample and the three spectra of each sample were averaged as well. The reference values and NIR spectra were used to create Partial Least Squares (PLS) regression models correlating the spectra to the parameters of interest.
| PLS: | ||
|---|---|---|
| Moisture: | R²=0.97 | RMSEP=2.0% |
| Water Activity: | R²= 0.95 | RMSEP=0.068 |
| Protein: | R²=0.97 | RMSEP=1.6% |
| Minerals (PLS1) | ||
| Ca: | R²=0.99 | RMSEP=10.7 mg/100 g |
| Fe | R²=0.99 | RMSEP=4.1 mg/100 g |
| K: | R²=0.80 | RMSEP=382 mg/100 g |
| Elemental (PLS2) | ||
| C: | R²= 0.88 | RMSEP=0.65% |
| H: | R²=0.90 | RMSEP=0.09% |
| N: | R²=0.96 | RMSEP=0.24% |
| S: | R²=0.73 | RMSEP=0.19% |
Two different types of PLS models were used for this study. PLS1 was used for moisture, water activity, protein, and minerals. PLS1 means that a single parameter is being correlated to the NIR spectra. In the case of elemental components, PLS2 was used, which means that more than one reference value is correlated to the NIR spectra in one model. PLS2 can often emphasize the differences when reference values are directly related to each other. Validation analysis showed that the moisture, water activity, and protein could reliably be predicted from the NIR spectra and calibration models. In the case of minerals and elemental analysis, the validation and independent predictions showed a large error. Minerals show minimal light absorption in the NIR wavelength range. Their effects on other compounds can only measure elements. An indirect correlation is acceptable but must be carefully validated and in this case, the PLS2 calibration model for elements did not prove robust enough to make accurate measurements. While the models could be used as a screening tool, the results obtained here for minerals and elements are inadequate to be implemented as the primary method of analysis in a real-time setting. Calculation of sorption isotherms calculated from the calibration model predictions and reference method proved the calibrations to be a viable method for determining the critical water values.
https://www.sciencedirect.com/science/article/pii/S0308814618306927
Peppercorn, Pepper Oil, and Pepper Oleoresin
Characterization of Peppercorn, Pepper Oil, and Pepper Oleoresin by Vibrational Spectroscopy Methods – Journal of Agricultural and Food Chemistry, 2005, 53, 3358-3363

The most important exporters of black pepper are India, Indonesia, Brazil, and Malaysia. India is the primary exporter of black pepper while the most important source of white pepper is the Indonesian island of Bangka. The major pungent principle in the green berries of pepper is piperine. There are also at least five other alkaloids present in smaller amounts. Black pepper is obtained from unripe green berries by sun-drying, while fully ripe dried fruits devoid of pericarp form white pepper. The composition of essential oil primarily determines the aroma of pepper. Three different spectroscopic methods were examined to assess piperine and primary oil content in both ground peppercorn and pepper oil: NIR, Mid-IR, and Raman. Fifty-one pepper samples were obtained from three German spice companies.
All samples were ground and a portion was set aside for hydrodistillation to receive the isolated oil. NIR spectra were collected from 12000 cm-1 to 4000 cm-1 averaging twelve scans per spectrum. A sampling cup was used for the powder and a quartz cuvette in transflection mode was used for the oil. Mid-IR spectra were collected from 4000 cm-1 to 700 cm-1 using a portable spectrometer and ATR background. Raman spectra were collected from 2000 cm-1 to 200 cm-1 at 4 cm-1 resolution averaging four scans per spectrum. After all spectra were collected, HPLC was performed to determine piperine content and GC was used to determine the contents of essential oil. All spectral data were pre-processed and Partial Least Squares (PLS) regression models were created for all three sets of spectral data correlating the parameters of interest to the spectra.
Black and White Pepper:
Analytes: Piperine (mg/100 g), Essential Oil, α-pinene, β-pinene, sabinene, myrcene, α-phellandrene, δ-3-carene, limonene, β-caryophyllene, caryophyllene oxide (All in mL/100 g)
| NIR: | R² | Piperine: | 0.83 | RMSEP | Piperine: | 0.21 |
| Essential Oil | 0.91 | Essential Oil: | 0.27 | |||
| Oils Range | 0.82 – 0.97 | Oils Range | 0.007 – 0.102 | |||
| Mid-IR: | R² | Piperine: | 0.86 | RMSEP | Piperine: | 0.19 |
| Essential Oil | 0.88 | Essential Oil: | 0.32 | |||
| Oils Range | 0.65 – 0.97 | Oils Range: | 0.008 – 0.134 | |||
| Raman: | R² | Piperine: | 0.84 | RMSEP | Piperine: | 0.23 |
| Essential Oil | 0.82 | Essential Oil: | 0.40 | |||
| Oils Range | 0.32 – 0.84 | Oils Range: | 0.015 – 0.174 |
Hydrodistilled Pepper Oils:
Analytes: α-pinene, β-pinene, sabinene, myrcene, α-phellandrene, δ-3-carene, limonene, β-caryophyllene, caryophyllene oxide (All in mL/100 g)
| NIR | R2 Range: | 0.65 – 1.00 | RMSEP Range: | 0.12 – 1.65 |
| Mid-IR: | R2 Range: | 0.92 – 1.00 | RMSEP Range: | 0.05 – 1.73 |
| Raman: | R2 Range: | 0.95 – 1.00 | RMSEP Range: | 0.08 – 1.03 |
The results from these models show that all three spectroscopic methods can be applied to the pepper oils for essential oil analysis, but only the NIR models present sufficient reliability to adequately determine the specific essential oil content in the black and white peppercorn samples. The likely reason for this is because of issues with the sampling methods for Mid-IR and Raman. A much deeper penetration area in the samples occurs when using NIR compared to Mid-IR. In the case of Raman, the laser sampling focuses on a small area and covers the very little volume of the sample as compared to NIR, which has a much larger focal area from the light source. The potential exists to apply spectroscopic methods as a quality control tool for peppercorns, pepper extracts, and pepper oil, replacing the current time-consuming and expensive methods like gas chromatography.
https://pubs.acs.org/doi/abs/10.1021/jf048137m
Oregano Essential Oil Analysis
Prediction of Essential Oil Content of Oregano by Hand-held and Fourier Transform NIR Spectroscopy – Camps, Gerard, Quennox, et al., J Sci Food Agric 2014; 94: 1397 – 1402
Several species of oregano over two separate harvests encompassing a wide range of essential oil content (EOC) were procured for the study. Samples were scanned using both a MEMS-based handheld spectrometer and an FT-NIR spectrometer. The MEMS instrument scanned through a glass vial from 1000 nm to 1800 nm using a resolution of 8 nm and thirty scans per average. Multiple spectra were collected per sample, and the vial was slightly rotated between each spectrum collection. The FT-NIR instrument scanned from 1000 nm to 2500 nm using a resolution of 12 cm-1. Spectra were collected in reflectance mode and the samples were rotated in a glass dish. Six spectra were collected per sample. After all the data were collected, the spectra for both instruments were split into calibration and validation sets.
| Handheld: | |
| EOC | R2=0.58 |
| FT-NIR: | |
| EOC | R2=0.91 |
The correlation was much better for the FT-NIR model than the handheld model. The FT-NIR instrument showed validated results, proving an accurate model for prediction and can be used in a practical real-time setting. The handheld instrument did not show accurate enough results for real-time use, especially when considering that a bias correction was necessary to achieve decent prediction results. One likely reason for the poorer correlation when using the handheld instrument is the limited spectral range. C-H combination bands in oil are prevalent in the wavelength range from 2300 nm to 2500 nm. The FT-NIR model contained this range while the handheld model did not. However, the handheld approach shows promise and more work should improve the calibration model.
https://www.ncbi.nlm.nih.gov/pubmed/24114845
Analysis of Thyme, Oregano, and Chamomile Essential Oils
Rapid Evaluation and Quantitative Analysis of Thyme, Oregano, and Chamomile Essential Oils by ATR-IR and NIR Spectroscopy – Schulz, Quilitzsch, Kruger, Journal of Molecular Structure 661-662 (2003) 299-306

In addition to use as spices and herbs, many plants have also been processed for their valuable essential oils since the development of distillation and solvent extraction. Three examples of this are thyme, oregano, and chamomile. Thyme is an aromatic perennial evergreen herb and is closely related to oregano. Both are in the mint family. Chamomile is a plant that resembles daisies and is used to make tea as well as herbal use for traditional medicine. Both the plant and essential oil forms of these three species are used in the food sector. The oils have become vital constituents in many cosmetic perfumes and phytopharmaceutical products. Different chemotypes of these species that vary in individual essential oil composition can change in aromatic properties and their ideal use. Current test methods rely heavily on gas chromatography, often in conjunction with mass spectroscopy. Since these techniques are time-consuming and expensive, alternative methods such as infrared spectroscopy have been studied for determining essential oil composition. NIR and Mid-IR spectroscopy were examined for analyzing essential oil composition of thyme, oregano, and chamomile. Most of the plants used in the study were cultivated in the experimental garden of the Federal Centre of Breeding Research on Cultivated Plants in Quedlinburg, Germany. These plants were hydrodistilled according to standard methods. Manufacturers directly provided some samples of essential oil. GC was performed on all samples to obtain reference values for the essential oil composition. NIR spectra were collected from 1100 nm to 2500 nm in transflection mode using quartz cuvettes, and a diffuse gold reflector. 2 nm resolution was used. Mid-IR spectra were collected from 4000 cm-1 to 650 cm-1 using a portable instrument with an ATR background. Both sets of data were imported for chemometric analysis. The full wavelength range was used for the NIR spectra and the Mid-IR spectra were reduced to 3200 cm-1 to 750 cm-1 before model composition, most likely because of noise at either end of the scanned wavelength range. Partial Least Squares (PLS) regression models were created correlating the essential oil composition to the spectral data.
| Thyme: |
| Oils Analyzed: Carvacrol, Linalool, Myrcene, ρ-Cymene, ϒ-Terpinene, Thymol |
| Mid-IR: | R2Range: 0.90 -0.98 | RMSEP Range: 0.21% – 0.83% |
| Oregano: |
| Oils Analyzed: Carvacrol, Ocimene, ρ-Cymene, Sabinene, α-Terpinene ϒ-Terpinene, Terpinene-4-ol Thymol |
| Mid-IR: | R2Range: 0.97 -0.99 | RMSEP Range: 0.4% – 1.2% | |
| NIR: | R2Range: 0.99 -1.00 | RMSEP Range: 0.2% – 0.6% |
| Chamomile: |
| Oils Analyzed: α-Bisabolol, Bisabolol oxide B, Chamazulene,cis-Spiroether, β-Farnesene |
| Mid-IR: | R2Range: 0.91 -0.99 | RMSEP Range: 0.5% – 2.3% | |
| NIR: | R2Range: 0.99 for all | RMSEP Range: 0.4% – 2.6% |
Good correlation and reasonable prediction error were shown for the PLS models in both sets of data. Most oils showed a correlation above 0.97 and the standard error for the most important oil components was in the range of the applied GC reference method. Real-time information on essential oil components has numerous potentially useful applications in the industry. These include the evaluation of wild plants collected from natural habitats, prediction of optimal harvest time, selection of high-quality single plants for breeding research, and continuous control of the distillation and blending processes of essential oils.
https://www.sciencedirect.com/science/article/abs/pii/S0022286003005179
Mentha Haplocalyx Analysis
Rapid Detection of Volatile Oil in Mentha Halpocalyx by Near-Infrared Spectroscopy and Chemometrics – Yan, Guo, Shao, Ouyang, Pharmacognosy Magazine, 19-07-2017
Mentha Haplocalyx is a traditional Chinese medicine made from the dried stems of origanum. It has a wide range of applications, including foods, spices, cosmetics, and tobacco. Demand for it is steadily increasing and the selection of cultivation areas is primarily based on the experience of farmers, which can lead to quality issues as the quality can vary significantly from area to area. Per Chinese standards, the sole evaluation index of Mentha Haplocalyx is the content of volatile oil. The mandatory requirement is not less than 0.80% mL/g. The conventional method for determining volatile oil is hydrodistillation, which is tedious and takes over three hours. NIR spectroscopy was examined as a method for rapid determination of volatile oil in Mentha Haplocalyx. Fifty-seven batches of Mentha Haplocalyx were collected from nine different provinces in China for the study. The nine areas represented the major growing regions and were chosen to ensure good applicability of the model from the samples. Samples were dried, crushed, and passed through a sieve to create powdered form. Volatile oil reference values were obtained by hydrodistillation. NIR spectra were collected from 10000 cm-1 to 4000 cm-1 with thirty-two scans averaged per spectrum. Each sample was scanned three times and the average of those three spectra was averaged into one spectrum. Different preprocessing methods were applied to the NIR spectra before chemometric analysis. Two-thirds of the spectra were selected to build the calibration model and the other one-third was used as a test set for model validation. Two different algorithms were selected to correlate the NIR spectra to volatile oil content: Partial Least Squares (PLS) and Support Vector Machine (SVM).
| PLS (Standard Normal Variate and First Derivative) | |
| R2= 0.8805 | RMSEP = 0.097% |
| SVM | |
| R2= 0.9232 | RMSEP = 0.082% |
The results shown above are excellent and prove the feasibility of measuring volatile oil content in Mentha Haplocalyx using NIR spectra and a calibration model. PLS was performed first and analysis of the wavelengths used for the calibration showed that the relevant range was from 5500 cm-1to 4000 cm-1. The NIR spectra in this range were used as an input for the SVM model. The SVM algorithm can risk an “over-fit” of the model if the number of input variables exceeds the number of samples. On the surface, the correlation fit can look good, but in practice, the independent prediction will be poor. In this case, the relevant wavelengths for the PLS model also showed excellent correlation when applying the SVM algorithm. The validity of the SVM model was confirmed by independent predictions of the test set data, which showed a good match with the reference values obtained by hydrodistillation. There is great potential to implement NIR spectroscopy as a real-time analytical tool for determining volatile oil content in Mentha Haplocalyx.
Commercial Reference
The post Spices Analysis appeared first on NIR-For-Food.
]]>The post Spices appeared first on NIR-For-Food.
]]>Introduction
The global spice and herbs market was estimated to be valued at approximately $6.91 billion in 2017. It is expected to grow at a CAGR of 7.1% from 2018 to 2023. Spices are aromatic plant substances used primarily for flavoring, coloring, or preserving food. While many uses of spices are interchangeable with herbs, spices are made from seeds, fruits, roots, or the bark portion of a plant while herbs are made from either leaves, flowers, or stems.
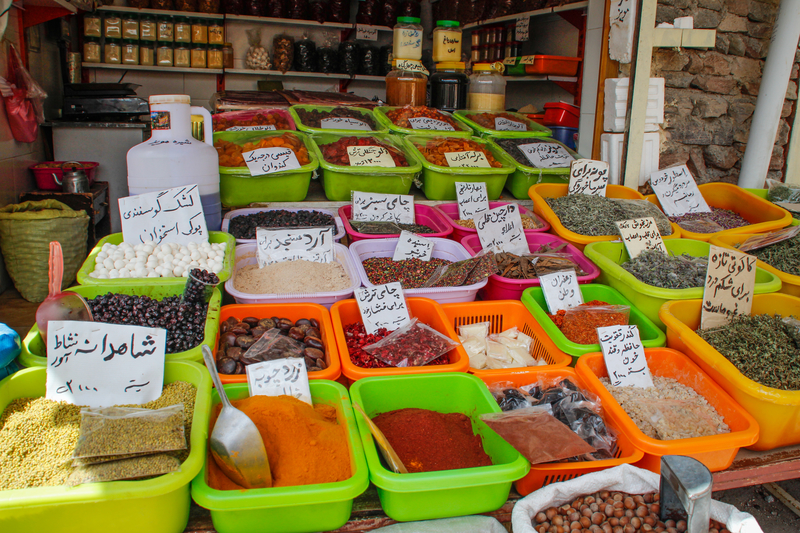
Spices are known for their strong flavoring and antimicrobial properties. Since they are often used in small quantities, spices add few calories to food when used normally but can contribute high amounts of vitamins and minerals to the diet when used in larger quantities. Most spices and herbs also have substantial antioxidants, mostly due to phenolic compounds like flavonoids. Antioxidants also act as natural preservatives, which help increase nutritional content in stored food. Before the advent of modern cooling and storage methods for shipped meats, spices were the primary method for preventing spoilage. Spices are available in fresh, whole dried, and pre-ground dried forms. Spices are normally dried and ground for convenience but grinding increases surface area, thus increasing oxidation and evaporation rates. Spice flavor comes mostly from volatile oils that are prone to oxidation and evaporation. Whole spices have a stronger flavor and longer shelf life than ground spices. In general, whole spices have a shelf life of two years, and ground spices have a shelf life of six months. Fresh spices are more flavorful than dried form but are more expensive and have a much shorter shelf life. In addition to food uses, spices have also been used in medicine, religious rituals, cosmetics, and perfume production. The market is large and diversified with one hundred and nine varieties listed by the International Organization for Standardization (ISO). India is the world’s largest producer and exporter of spices, producing about seventy-five of the ISO varieties. Numerous spice blends exist in different parts of the world. Notable spice blends include Masala (India), Curry (India), Berbere (Ethiopia), Jerk (Caribbean), Adobo (Latin America), Mitmita (Africa), Ras El Hanour (Morocco), Chinese Five-Spice Powder (China), Old Bay (United States), and Mixed Spice (England). Trade potential is strong, especially in areas with favorable climatic conditions with significant local demand like Asia-Pacific. A high percentage of spices and herbs, whether traded locally or exported, are produced by small-scale farmers. Factors driving the market growth include increased availability of international cuisine, increased consumer consumption of natural products and convenience foods, and a larger scope of new and attractive taste creations to meet consumer demand. Increased demand and production of spices have created a need for new testing methods for spice analysis, especially for determining spice authenticity and adulteration. One such method that has been examined is NIR spectroscopy.
History

The history of spices and herbs goes back to ancient times and is almost as old as human civilization. It is believed that early hunters and gatherers wrapped meat in the leaves of bushes, discovering that this enhanced taste. Over time, nuts, seeds, berries, and bark were also shown to enhance the taste as well as masking unpleasant tastes and odors. As early as 3500 BC, ancient Egyptians were using spices for flavoring, cosmetics, and embalming their dead. Spices were used as a food preservative in early times as well. Chinese writings around 2700 BC mention the use of plants for medicinal purposes. Eventually, the use of spices spread from the Middle East and China to the Eastern Mediterranean and Europe. For thousands of years, spices were transported by donkey or camel caravan from China, Indonesia, India, and Ceylon (present-day Sri Lanka) through the Middle East to Europe. Spice trade played a crucial role in history in many civilizations, including Egyptian, Roman, Greek, and Arabian. During the Middle Ages, spices were considered as valuable as gold and gems in Europe and were a driving force in the world economy. Competition and demand for spices among European nations led to the colonization of India and other parts of Asia. Marco Polo mentioned spices frequently in his travel memoirs, which were written around 1300 AD. The demand for spices also led to the Age of Exploration, eventually resulting in the discovery of the New World. Christopher Columbus’ journey in 1492 was a search for a sea route to the land of spices. In 1497, Vasco de Gama was more successful in finding India by sea by sailing around the southern tip of Africa.
Spices have played an essential role in American history as well. Plant-based medicine was the primary source of medicine in the United States from early colonization until about 1930. Even today, many modern medicines are derived from plant-based medicine, such as aspirin from willow tree bark. After the American Revolution, the United States entered the world spice trade without British taxes and trade restriction. American agricultural and manufactured products were traded all over the world for spices. In modern times, the world spice trade has become more decentralized. While spices are no longer as prevalent when used for medicine or as a preservative, the demand for their use for flavoring and their health benefits is stronger than ever.
Spice Processing, Manufacturing, Blending, and Packaging
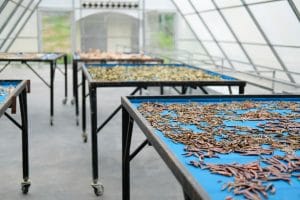 While there is a large variety of spices and herbs, the general procedure for processing and manufacturing is similar for all types. The first step is to ensure good raw material for harvesting. Premature harvesting of crops will result in a lower quality product. Crops can be harvested early by farmers for fear of theft, urgency for money, or fear of bad weather.
The localized nature of the spice industry can make these things difficult to monitor. Crops must be cleaned and washed before harvesting. Dust and dirt are removed using either a winnowing basket or cleaning machine. After cleaning, crops are washed in potable water before the drying stage. The drying stage for spice and herb crops is crucial for good quality products. If crops are not adequately dried, mold can grow and can reduce the sale price of spices by over 50%. In extreme cases, bacteria can grow on some spices and present a health risk. The drying procedure can differ based on whether the crops are harvested during the dry or wet season. During the dry season, sun drying is adequate for drying crops. This must be done carefully to avoid dust and dirt contamination as well as the threat of rain. Larger farms may use solar dryers to avoid these problems. During the wet season or times of high humidity, dryers using wood are often used. It is important to not overheat or over dry the crops. Specifications for the proper moisture content vary among different spices and herbs but generally vary from 6% to 13%. Some spices require special conditions for drying, such as being dried in the dark to maintain color.
If the spice is to be ground, this occurs after drying. Manual grinders can be used for small scale production. Larger scale production uses grinding mills which must be monitored carefully. Grinding mills create large amounts of dust requiring ventilation and spices can overheat during grinding if the temperature is not kept cool. Ground spices need to be checked for uniformity as well. There are many well-known spice blends and blending occurs after grinding. Ensuring completion of blending and a uniform mixture presents a big challenge for large spice producers. Packaging requirements can vary in different ways, such as different requirements for ground or whole spice, for the type of spice, and need to account for the humidity level. Boxes and sacks are adequate for whole spices if the humidity is not high. Ground spices are typically stored in a barrier film like polypropylene to avoid flavor loss and contamination.
Adulteration, Monitoring, and NIR Spectroscopy
Adulteration is a huge problem in the food industry for both economic and safety reasons. The history of spice adulteration goes back thousands of years and can present different forms. Some adulteration can be defined as incidental, meaning foreign substances can be incorporated into food from negligence or ignorance. This can occur during harvesting. Harvesting at the wrong time can also create adulteration by reducing nutritional value or having a product with an improper moisture level. Farmers may do this out of fear of theft or because they need money quickly. Intentional adulteration occurs with the intent to cause harm or create economic gain. One form of adulteration is mispresenting the geographical origin of a product, which is relatively harmless but still can have economic consequences. A more dangerous and intentional form of adulteration is contaminating spices with other products, both non-toxic and toxic. Examples of non-toxic spice adulteration include tomato skins in paprika, buckwheat and millet in black pepper, and starch in onion powder. Adulteration with toxic substances has led to illnesses and death. One such incident occurred with Hungarian ground paprika which was contaminated with lead oxide, leading to several deaths and dozens of illnesses. Lead oxide can dissolve in hydrochloric acid in the stomach, making it toxic upon ingestion. Another example is Sudan I dye, a known rodent carcinogen and banned food additive, which has been used as an adulterant in both chili powder and paprika. Other dyes that are not approved for use in food have been discovered in ground capsicum. There are inherent challenges to testing for spice adulteration. Methods of contamination by adulteration are constantly evolving and are difficult to assess visually. Current methods for determining spice adulteration are morphological, microscopic, chemical, or DNA based. These tests are usually expensive, time-consuming, and difficult to use on a large scale to determine the authenticity of a spice.
There is a need for fast, non-invasive, and reliable testing methods for spices. In addition to adulteration, moisture and blending tests would be very useful to the spice industry. One potential method that has been examined for spice testing is NIR spectroscopy. Studies have been conducted that use NIR spectroscopy to detect adulterants in spices as well as in other types of food. Many studies have shown excellent results and prove the feasibility of spectroscopic methods as an alternative to traditional testing. Moisture is a well-known measurable constituent using NIR spectroscopy because water is highly absorbing of NIR light. Using NIR spectroscopy as a method to determine drying time should be a feasible application for spices. In the case of blending, determining blending end time presents a difficult challenge. While blending is a proven application in the pharmaceutical industry, blending of pharmaceuticals occurs under controlled conditions and with the same type of ingredients. Building calibrations using natural products can show variability in NIR spectra that are not because of changes in the parameter of interest. In the case of spice blending, differences in raw materials might make it difficult to use NIR spectroscopy as a method. As of this writing, there are no known studies to determine the feasibility of monitoring spice blending using spectroscopic methods. However, large spice companies are interested in finding new methods to determine the endpoint of spice blending. It is likely that studies will be conducted in the future to see if NIR spectroscopy is a feasible method for such measurements.
Process Analytical Technology (PAT) & On-Line Measurements
Process Analytical Technology (PAT) is a framework for innovative process manufacturing and quality assurance. Critical points and parameters during manufacturing of a product are defined and the process is designed in a way that such points and parameters can be measured using analytical tools and instruments for real-time process feedback and control. Such instruments must be able to measure on-line and in a non-invasive manner. Many vendors have developed instruments that are able to measure multiple points in a process with a single instrument, usually using optical fibers and probes. PAT has become an important part of pharmaceutical as well as chemical manufacturing and is beginning to acquire a hold in the food & beverage industry. One such analytical tool with great potential for use in PAT is NIR spectroscopy.
There are significant challenges to implementing PAT in a spice manufacturing environment. NIR spectroscopy has been proven as a useful tool for measuring parameters of interest in the spice industry. Vendors are coming up with new and innovative ways to make on-line measurements a feasible solution for companies. Advances such as improved fiber-optics, in-situ sampling, a transition to integrated automation, improved data management systems, and communication systems in the Internet and Cloud age have all contributed to implementing PAT. The beverage and food industries also present particular challenges due to natural product variability. In the case of pharmaceuticals and chemicals, the manufacturing process is usually conducted in a controlled environment with constituents that rarely show variability in spectral data over time. For foods and particularly agricultural products, there can be marked differences in products due to many factors, such as temperature variability, seasonal variation, differences in soil and nutrients, and different breeds of the same product. Such variability is especially important to account for when performing spice analysis. Such differences can create variability in spectral data that must be incorporated into calibration models when calibrating NIR spectrometers and other analytical PAT tools. This is known as making models “robust” and often requires a larger and more incorporative sample set to achieve the desired results.
Calibration studies have been conducted for monitoring parameters in the spice industry in-line as well as in the laboratory. Results have been good and show that in-line measurements are a feasible tool for spice analysis using PAT. Parameters of interest for quality control of spices include adulteration detection and quantification, moisture, protein, volatile/essential oils and blending endpoint. Full adoption of PAT in the spice industry will require a collaborative effort from process engineers, food scientists, and other contributors to provide the industry with a manufacturing framework for the 21th century.
References
Spice Market – Global Industry Analysis: Size, Share, Growth, Trends, and Forecast 2016-2024
https://www.transparencymarketresearch.com/spice-market.html
Spice and Herb Extracts Market – Growth, Trends, and Forecasts (2019-2024)
https://www.mordorintelligence.com/industry-reports/spice-and-herb-extracts-market
McCormick Science Institute
https://www.mccormickscienceinstitute.com/resources/culinary-spices
VLC Spices: Manufacturing and Exporting
https://www.vlcspices.com/
The Spice Trader: History of Spices
https://www.thespicetrader.co.nz/history-of-spice/
Process Analytical Technology for the Food Industry -O’Donnell, Fagan, Cullen, et al., Springer, Food Engineering Series (2014)
Commercial Reference
The post Spices appeared first on NIR-For-Food.
]]>