The post Meat Adulterant Analysis appeared first on NIR-For-Food.
]]>Introduction
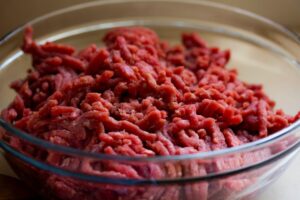
Meat products are a valuable and large portion of the worldwide food market. The quality and market pricing of different grades of meat can vary greatly, making meat a prime target for adulteration with lower-quality products. An incident in England where horsemeat was found in burgers at a prominent supermarket chain resulted in a large drop in market value for the company. Minced meat is difficult for adulteration detection by visual inspection, especially when the adulterant is in a low quantity, although any adulteration of a meat product is likely to be fairly high in order to obtain economic benefit. Lamb, veal, and certain grades of beef are some of the more valuable meat products. Potential adulterants of meat products include pork, chicken, cattle meat, foal meat, and turkey. NIR spectroscopy has been examined as a method for determining the presence of adulteration in meat products and the results of some studies are documented below.
Analytes
Products: Lamb, Beef, Veal Adulterants: Pork Meat, Pork Fat, Chicken, Lidia Breed Horsemeat, Foal Meat, Turkey
Scientific References and Statistics
Detection of Minced Lamb and Beef Fraud Using NIR Spectroscopy – Lopez-Maestresalas, Insausti, Jaren, Food Control 98 (2019) 465-473
Food fraud and adulteration have presented a significant challenge to both industry and government. Meat products especially present a challenge because it is not easy to identify fraud or incorrect labeling, both of which can result in severe consequences for manufacturers and the market. In some cases, these things can constitute a health risk as well. In 2013, an incident with the discovery of horsemeat in burgers led to a significant hit in profits and reputation of the UK supermarket chain Tesco, which suffered a 300€ million drop in market value. Typical cases of meat adulteration usually result in the substitution of a cheaper species in a higher quality and more expensive meat. While numerous studies have been conducted using NIR spectroscopy to identify adulteration in meat products, most of these have reported results for levels of adulteration over 2%. In this study, NIR spectroscopy was examined for detecting low levels of adulteration in both pure lamb and pure beef. Samples of lamb, beef, pork, Lidia breed cattle, foal meat, and chicken breast were procured for the study. All individual samples were trimmed to remove remaining skin and fat, minced, and homogenized before mixing. Each prepared sample weighed 4 g. For both pure lamb and pure beef, each adulterant was mixed with the pure meat at the following ratios by weight: 0%, 1%, 2%, 5%, and 10%. Replicates were made of all samples and after all the samples were mixed, there were two hundred total lamb samples (forty pure and one hundred sixty adulterated) and one hundred eighty-six total beef samples (thirty pure and one hundred fifty-six adulterated). NIR reflectance spectra were collected from 1100 nm to 2300 nm at 2 nm intervals. Fifty scans were collected per reading and averaged into one spectrum. This process was repeated five times for each sample, moving the sample each time before scanning. The five acquired spectra for each sample were then averaged, making one single spectrum per sample. Various pre-processing methods were applied to the NIR spectra. Principle Component Analysis (PCA) was performed to explore the structure of the data and identify any separation among the groups of samples. For each pure meat and adulterant, Partial Least Squares Discriminant Analysis (PLS-DA) was performed to classify pure meat and adulterated samples. Each group was separated into a training set to create the classification model and a test set for model validation.
PLS-DA
| Lamb and pork meat | Correct Classification – 90% |
| Lamb and chicken | Correct Classification – 79.16% |
| Lamb and Lidia breed cattle | Correct Classification – 86.36% |
| Lamb and foal meat | Correct Classification – 85% |
| Beef and pork meat | Correct Classification – 80% |
| Beef and chicken | Correct Classification – 78.95% |
| Beef and Lidia breed cattle | Correct Classification – 95.24% |
| Beef and foal meat | Correct Classification – 100% |
PLS-DA assigns an arbitrary value of 0 and 1 to two groups for classification purposes and predicts a value for the number from the model and NIR spectra. In this case, the best results were obtained for the pure beef adulterated with cattle meat and foal meat. The analysis in the study did not make it clear whether the incorrect classifications were obtained for the pure meat, lower level of adulterant, or higher level of adulterant. Despite the homogenized samples, in practice it is quite difficult to fully mix a small amount of adulterant in a meat sample. However, the results certainly prove the feasibility of detecting both cattle and foal meat adulterants in beef products and could be used as a screening tool for pork and chicken in beef and all four adulterants in lamb. Since an adulteration level of less than 20% is impractical for economic purposes and higher levels of adulteration would likely improve the results shown here, the study does show that NIR spectroscopy can be used as a method for detecting adulterants in lamb and beef products.
https://www.sciencedirect.com/science/article/pii/S0956713518306030
Methods for Detection of Pork Adulteration in Veal Product Based on FT-NIR Spectroscopy for Laboratory, Industrial, and On-Site Analysis – Schmutzler, Beganovic, Bohler, Huck, Food Control 57 (2015) 258-267
 In today’s food market, controls are essential to check authenticity and protect from harmful frauds. Adulteration can have tough consequences for market confidence, especially in the high price segment. Regulations exist but testing methods are often expensive and time-consuming as well as ill-suited to implement on a large scale. There is a need for new and feasible analytical methods that can continually evolve to meet the changes and challenges that are presented when monitoring for food fraud and adulteration. One such method that has been examined is NIR spectroscopy in numerous verticals in the food and beverage markets. NIR spectroscopy offers numerous advantages over traditional analytical methods, such as speed, ease-of-use, little or no sample preparation, non-invasive measurements, and the ability to measure multiple parameters of interest with one reading once the proper calibrations are created. One consideration when using NIR spectroscopy is the proper location and ideal point of product creation and manufacturing for implementing measurements. This study compared methods for detecting pork adulteration in veal sausage using NIR spectroscopy and three separate sampling methods: laboratory, industrial, and on-site. The same FT-NIR spectrometer was used for the laboratory and industrial methods. The laboratory setting used a measurement cup for sampling and the industrial setting used a fiber optic probe. A laboratory instrument can be expected to optimize performance while an industrial instrument offers the advantage of non-contact measurements and the potential to measure in an on-line setting. The on-site setting used a handheld portable spectrometer, making it suitable for quick inspections and spot testing in shops and markets. The portability of handheld instruments offers advantages but they can have several drawbacks as well. A pure veal sausage product and both pork and pork fat as adulterants were procured for the study. The pork was added in 10% w/w increments up to 50% pure veal and 50% pork. The same process was repeated for the pork fat. Since the sausages contain 76% veal meat and 14.4% veal fat, there is a substantial difference in the actual weight added for the % adulterant between pork and pork fat. Samples were homogenized, divided into multiple portions, and a portion of each sample was placed in polymer packaging to be used in the industrial and on-site settings. For the FT-NIR spectrometer used in both the laboratory and industrial settings, scanning parameters were the same: 12500 cm-1 to 4000 cm-1, 8 cm-1 resolution, and thirty-two averaged scans per spectrum. Quartz cuvettes were used for the laboratory and no extra preparation was needed for the industrial. Seventy-two samples were scanned in total for the laboratory and eighty-four for the industrial. The additional twelve samples for the industrial were scanned through the polymer packaging. For the on-site setting, the following scanning parameters were used: 6267 cm-1 to 4173 cm-1, 21 cm-1 resolution, and six scans per average. Both the quartz cuvettes prepared for the laboratory and the polymer packaged samples were scanned using the handheld spectrometer. Various pre-processing treatments were applied to all NIR spectra before chemometric analysis. Both Principle Component Analysis (PCA) and Support Vector Machine (SVM) were developed to analyze the feasibility of classifying adulterated veal samples from all three sets of NIR spectra.
Pork Adulterant:
| Laboratory | 100% Correct Classification from 10% to 50% adulterant |
| Industrial with Quartz Cuvette | 100% Correct Classification from 10% to 50% adulterant |
| Industrial with Polymer Packaging | 100% Correct Classification from 20% to 50% adulterant, 91.7% Correct Classification for 10% Adulterant |
| On-site with Quartz Cuvette | 100% Correct Classification from 10% to 50% adulterant |
| On-site with Polymer Packaging | 100% Correct Classification from 20% to 50% adulterant, 83.3% Correct Classification for 10% Adulterant |
Pork Fat Adulterant:
| Laboratory | 100% Correct Classification from 10% to 50% adulterant |
| Industrial with Quartz Cuvette | 100% Correct Classification from 10% to 50% adulterant |
| Industrial with Polymer Packaging | 100% Correct Classification from 10% to 50% adulterant |
| On-site with Quartz Cuvette | 100% Correct Classification from 20% to 50% adulterant, 83.3% Correct Classification for 10% adulterant |
| On-site with Polymer Packaging | 91.7% Correct Classification for 50% and 40% adulterant, 83.3% Correct Classification for 30% Adulterant, 75% Correct Classification for 20% and 10% adulterant |
The results shown above warrant analysis to determine the advantages and disadvantages of using all three sampling methods to determine pork and pork fat adulteration in veal sausages. Both the laboratory and industrial settings showed 100% correct classification for both pork and pork fat adulterants, with the exception of the polymer packaging in pork with a 91.7% correct rate. Results were similar for pork for on-site but considerably worse for pork fat for on-site, especially when using the polymer packaging. In practice, the advantages gained from using a handheld spectrometer would not be applicable if the sample was placed in a cuvette. The poor results can be attributed to a much shorter wavenumber range and lower spectral resolution and signal-to-noise ratio. It also must be noted that the composition of the sausages is about 76% veal and 14.4% veal fat, meaning that a 10% w/w adulteration for the meat is considerably more than the same for fat, requiring a much higher sensitivity for detection of fat adulteration. Despite the poorer results with the handheld instrument, a real-life veal adulteration incident is likely to have a very high percentage of adulterant present and a handheld spectrometer could work as a screening tool. The results may improve for the handheld instrument with more samples and model optimization. Overall, the advantages and disadvantages of all three sample setups must be considered but it is clear that the FT-NIR spectrometer can provide much better results than a handheld spectrometer.
https://www.sciencedirect.com/science/article/pii/S0956713515002364
Identification and Quantification of Turkey Meat Adulteration in Fresh, Frozen-Thawed, and Cooked Minced Beef by FT-NIR Spectroscopy and Chemometrics – Alamprese, Amigo, Casiraghi, Engelsen, Meat Science 121 (2016), 175-181
Turkey Adulteration in Fresh, Frozen-Thawed, and Cooked Minced Beef Samples
In the past, meat was usually marketed as fresh and contained recognizable cuts, making adulteration difficult. With the advent of processing and mincing, meat has become a target for adulteration. Mincing, freezing, and cooking modify the morphological characteristics of meat, making it difficult to distinguish a mixed adulterant from the proper meat. NIR spectroscopy was examined as a method for determining turkey adulteration in fresh, frozen-thawed, and cooked minced beef samples. Eleven different batches of beef bottom round meat and eleven batches of turkey breast meat were minced separately and used to prepare mixtures with different percentages of turkey meat. All mixtures were scanned as well as the pure beef and turkey. All samples were frozen for six months, thawed, and scanned. After thawed, the samples were cooked in a microwave, cooled, and scanned once again.
| Fresh | R² = 0.925 | RMSEP = 8.09% |
| Frozen-Thawed | R² = 0.898 | RMSEP = 9.39% |
| Cooked | R² = 0.916 | RMSEP = 8.46% |
Both Partial Least Squares (quantification) and PLS-DA (classification) models were used for this study. Results show the potential of using NIR spectroscopy as a reliable tool for the rapid identification and quantification of turkey adulteration in all three types of samples. The classification model can distinguish between adulteration levels less than & greater than 20%. While the quantification models are unable to measure the adulteration level if it is less than 20%, this is not of practical importance in a real-time setting because any adulteration that is economically worthwhile is very likely to exceed 20% turkey meat.
https://www.sciencedirect.com/science/article/abs/pii/S0309174016301826
The post Meat Adulterant Analysis appeared first on NIR-For-Food.
]]>The post Ground Beef Analysis appeared first on NIR-For-Food.
]]>The post Ground Beef Analysis appeared first on NIR-For-Food.
]]>The post Poultry Analysis appeared first on NIR-For-Food.
]]>The post Poultry Analysis appeared first on NIR-For-Food.
]]>The post Sausage Analysis appeared first on NIR-For-Food.
]]>The post Sausage Analysis appeared first on NIR-For-Food.
]]>