The post Dairy Adulterant Analysis appeared first on NIR-For-Food.
]]>Introduction
Dairy products have been the target of some high-profile incidents of adulteration, resulting in sickness and deaths by the addition of melamine to milk and infant formula. Melamine detection is difficult because it mimics high protein content in routine quality tests. While it can be detected by more advanced tests, those tests are expensive and difficult to implement on a large scale. Other adulterants of milk include non-fat solids and inorganic salts in milk powder as well as representation of a lower quality milk as a higher quality product. Some cheeses are strictly regulated by manufacturing standards and designation. Products that do not meet standards are considered to be adulterated. Butter and yogurt can also be targets for adulteration, often by impurities containing fat and protein that can cheat routine quality tests. There is a need for fast, non-invasive testing for adulteration of dairy products that can replace current methods. NIR spectroscopy has been examined for this purpose and the results of some studies are summarized below.
Analytes
Products:
- Milk
- Milk Powder
- Cheese
- Butter
- Yogurt
Adulterants:
- Melamine
- Cow Milk in Camel Milk
- Dicyandiamide
- Aminotriazole
- Biuret
- Soy Protein Isolate
- Pea Protein Isolate
- Calcium Carbonate
- Maltodextrin, Sucrose
- Authentic Origin Designation
- Tallow
- Edible Gelatin
- Industrial Gelatin
- Soy Protein
Scientific References and Statistics
Milk
 Melamine Detection by Mid- and Near-Infrared (MIR/NIR) Spectroscopy: A Quick and Sensitive Method for Dairy Products Analysis Including Liquid Milk, Infant Formula, and Milk Powder – Balabin, Smirnov, Talanta 85 (2011) 562-568
Melamine (2,4,6-triamino-1,3,5-triazine) is a nitrogen-rich chemical most frequently used in making plastics. In routine quality tests like the Kjeldahl and Dumas methods, the high nitrogen content increases the apparent protein content, making it a chemical that can be used for food adulteration mimicking high protein content. Melamine contamination has been reported in liquid and powdered milk, infant formula, frozen yogurt, pet food, biscuits, candy, and coffee drinks. Two high profile incidents resulted in recalls of pet and human food in 2007 and infant formula in 2008, creating a widespread global food safety scare. Ingestion of melamine may lead to reproductive damage, bladder or kidney stones, and bladder cancer. The current FDA method for detecting melamine in infant formula is liquid chromatography-triple-quadrupole tandem mass spectroscopy (LC-MS/MS). While effective with a limit of detection as low as 0.25 ppm, it requires extensive sample preparation and cleanup, skilled labor, and is time-consuming and expensive, making it ill-suited for testing large numbers of samples. Vibrational spectroscopy offers a cost-effective and fast alternative to current methods and both NIR and Mid-IR spectroscopy were examined for detecting melamine adulteration in infant formula, milk powder, and liquid milk.
The initial sample set consisted of sixty infant formula samples and seventy-two each of milk powder and liquid milk. All samples were first checked for the absence of melamine using HPLC. After verifying the samples to be absent of contamination, they were mixed in random proportions to create six hundred ninety infant formula samples and six hundred sixty milk powder and liquid milk samples. Four separate melamine brands from three different producers were used as the adulterant. The range of melamine concentration was set to be very low (0.11 ppm) to very high (2000 ppm). Between one gram to five grams were prepared for each sample and all samples were homogenized before spectra collection. Samples were scanned right after preparation to minimize experimental errors. NIR spectra were collected from 9000 cm-1 to 4500 cm-1 using 8 cm-1 resolution. Sixty-four scans were collected per reading and averaged into one spectrum. An 8 mm in diameter cylindrical glass cell was used and five spectra were collected per sample, rotating the cell between each collection. These five spectra were then averaged into a single spectrum per sample. Mid-IR spectra were collected from 4000 cm-1 to 500 cm-1 using 2 cm-1 resolution. Thirty-two scans were averaged per spectrum and an ATR background was used. This collection process was repeated between five to seven times for each sample and all spectra from each sample were averaged into a single spectrum per sample. Before calibration modeling, nine different preprocessing methods were applied to both sets of spectra. Fairly poor results were obtained using Partial Least Squares (PLS) and Orthogonal Projections to Latent Structures (OPLS), indicating the possibility that a non-linear relationship existed between both sets of spectra and melamine concentration. The non-linear regression methods Polynomial-PLS (Poly-PLS), Artificial Neural Network (ANN), Support Vector Regression (SVR), and Least Squares Support Vector Machine (LS-SVM) were analyzed. In order to keep the model unbiased towards the accurate prediction of samples with high melamine content, the data sets were split into a low set and high set. The low data set used samples with a melamine concentration of 17.3 ppm or lower and the high set used samples with a melamine concentration of 17.3 ppm to the highest concentration of 2000 ppm. The results listed below are averaged results for both NIR and Mid-IR.
Low Melamine Concentration (Infant Formula, Milk Powder, Liquid Milk):
| Average Error (PLS & OPLS) | RMSEP = 1.31 +/- 0.07 ppm |
| Average Error (Poly-PLS, ANN, LS-SVM, SVR) | RMSEP = 0.28 +/- 0.05 ppm |
High Melamine Concentration (Infant Formula, Milk Powder, Liquid Milk):
| Average Error (PLS, OPLS, Poly-PLS) | RMSEP = 15.0 +/- 6.0 ppm (Estimated) |
| Average Error (ANN, LS-SVM, SVR) | RMSEP = 6.1 +/- 0.9 ppm |
The desired detection threshold for melamine adulteration is 1.0 ppm or less for lower concentrations. Analysis of the non-linear calibration models showed that the threshold of detection was 0.76 +/- 0.11 ppm, making both NIR and Mid-IR acceptable methods in practice for determining melamine concentration in all three types of milk products. In the case of the high melamine concentration, prediction error was much higher for Mid-IR than NIR. The results of both sets of models were verified by an independent validation set chosen from the samples. Overall, statistics from the calibration models showed an ability to measure infant formula, milk powder, and liquid milk with equal efficiency. The results here appear good enough to use NIR spectroscopy as a screening tool to detect adulterated samples that can be passed on for more advanced tests if melamine is detected. However, these models would require more validation before being used in a real setting. NIR spectroscopy rarely has a threshold of sensitivity low enough to measure parameters at a ppm level, even in the case of water which is known to be a very strong absorber in the NIR. It is possible that the change in melamine is colinear with other changes in the dairy product, thus creating an indirect correlation in the calibration models. However, while an indirect correlation is acceptable in NIR spectroscopy, such models require careful validation and the wavelength ranges used for the correlation must be carefully examined. Such analysis was not presented in this study. With such low concentrations and a non-linear relationship between NIR spectra and melamine concentration, careful calibration work must be done to use NIR spectroscopy for melamine detection in other products. The potential was demonstrated in this study to use NIR spectroscopy and calibration models to measure melamine adulteration in milk products but more careful examination of the results is required. If properly validated, NIR spectroscopy offers a much quicker and less expensive alternative to traditional reference methods for monitoring melamine adulteration.
https://www.sciencedirect.com/science/article/pii/S0039914011003407
Detection of Melamine Adulteration in Milk by Near-Infrared Spectroscopy and One-Class Partial Least Squares – Chen, Tan, Lin, Wu, Spectroschimica Acta Part A: Molecular and Biomolecular Spectroscopy 173 (2017) 832-836
Melamine is a nitrogen containing compound that has been implicated in global food scares involving milk products. It contains 66.7% nitrogen by mass and is used as an adulterant to increase the apparent protein content. The traditional Kjeldahl test for protein does not measure protein directly but determines protein from the nitrogen content without considering the source. High doses of melamine in dairy products can result in kidney stones, renal failure, and has resulted in deaths of babies after consuming melamine-adulterated infant formula. The publicity from incidents of adulterated dairy products has resulted in the development of a number of testing methods. However, these tests are often expensive, time-consuming, require skilled labor and the use of toxic solvents, and are ill-suited to use as a large-scale quality assurance tool. An ideal analytical method to verify the quality and authenticity of food products requires speed with little sample preparation and low cost. NIR spectroscopy was examined as a method for determining melamine adulteration in milk. Milk powder was procured from a local supermarket for the study and was confirmed to be free of melamine. Sixty-two 100 ml samples of milk liquor were prepared over two days with a week interval in between. Forty-two of these samples were set aside as pure samples and the remaining twenty-two were prepared as adulterated samples. 99% pure melamine was procured from a vendor and different concentrations of melamine were dissolved in the remaining twenty samples of milk liquor. Melamine concentration ranged from 0.001 g/100 ml to 0.29 g/100 ml, which is the upper limit of solubility of melamine in water. NIR spectra were collected using an FT-NIR spectrometer from 10000 cm-1 to 4000 cm-1 at 3.856 cm-1 intervals. Thirty-two scans were collected per reading and averaged into one spectrum. One spectrum was collected for each pure milk sample. Three spectra were collected for each adulterated sample, making a total of one hundred two NIR spectra. A One-Class Partial Least Squares (OC-PLS) classification model was created by assigning a value of 0 to all pure milk spectra and 1 to all adulterated samples. A Variable Importance (VI) index was used to select the forty most important input variables for the classification. Samples were split into a training set to create the model and a test set for model validation.
OC-PLS
| Accuracy 89% | Sensitivity 90% | Specificity 88% |
The results shown above were determined from predictions using the test set spectra and prove the feasibility of using NIR spectroscopy and a classification model as a screening tool to determine the presence of melamine adulterant in milk. Future work should include more types of milk and different concentrations of melamine in order to increase the robustness of the model. Implementing NIR spectroscopy as a method for detecting melamine adulteration offers a less expensive and time-consuming alternative to current methods and can be used as a screening tool to find adulterated samples that can be sent for more advanced testing if melamine is detected.
https://www.sciencedirect.com/science/article/pii/S1386142516306473
FT-NIRS Coupled With Chemometric Methods As A Rapid Alternative Tool for the Detection & Quantification of Cow Milk Adulteration in Camel Milk Samples – Mabood, Jabeen, Hussain, et al., Vibrational Spectroscopy 92 (2017) 245-250
Camel milk is considered to have high nutritional value in comparison to milk produced by cows. It is a rich source of Vitamin A and C, has a high content of potent immunoglobins, and does not contain lactoglobulin and A1 casein, making it suitable for consumption by people with bovine dairy allergies. Thus, it sells for a higher market price and is subject to adulteration using cheaper forms of milk. FT-NIR spectroscopy was examined as a method for determining cow milk adulteration in samples of camel milk. Three samples of camel milk were procured for the study and prepared in triplicate form. Each separate camel milk sample was adulterated with different percent levels of cow milk adulterant: 2%, 5%, 10%, 15%, and 20%. Including the three pure samples, a total of fifty-four samples were created. 70% of the samples were used as a calibration set to create the model and the remaining 30% was used as a validation set. All samples were scanned from 700 nm to 2500 nm at 2 cm-1 spectral resolution using a 0.2 mm pathlength sealed cell. Two calibration models were created: Partial Least Squares Discriminant Analysis (PLS-DA) to determine the presence of the cow milk adulterant and Partial Least Squares (PLS) to quantify the amount of adulterant present.
PLS-DA
| Presence of Adulterant | R² = 0.973 | RMSEP= 0.0801 |
PLS
| Amount of Adulterant | R² = 0.926 | RMSEP= 1.32% |
Both calibration models showed good results and proved the feasibility of the measurement. In the case of PLS-DA, an arbitrary value of 0 was assigned to the pure camel milk samples and 1 to samples spiked with 10% cow milk adulterant. The model predicts a number and a threshold of 0.5 was chosen to determine the presence of adulterant. A predicted value less than 0.5 indicates no adulterant and a predicted value greater than 0.5 indicates an adulterant is present in the sample. The high correlation and low RMSEP show that this model can be used to determine the presence of cow milk adulterant in camel milk. In the case of PLS, the results show that the model can predict the amount of adulterant present within an accuracy of 1.32%. It must be noted that while the models showed good results, using them in a practical setting for different kinds of milk and adulterants would require a much larger sample set. Natural products often show variability in NIR spectra due to many factors, such as region of origin, different types of food fed to animals, different soil for plant growing, and so forth. Incorporating different samples encompassing any potential variability is important when building calibration models. Predictions performed on the validation set proved that the models could work in a real-time setting, using the PLS-DA model as a detection tool and the PLS model as a quantification tool, providing information that would be very difficult to find using conventional methods for adulteration detection.
https://www.sciencedirect.com/science/article/abs/pii/S0924203117300668
Non-Targeted NIR Spectroscopy and SIMCA Classification for Commercial Milk Powder Authentication: A Study Using Eleven Potential Adulterants – Karunathilaka, Yakes, He, et al., Heliyon 4 (2018) e00806.
NIR spectroscopy was evaluated as a method for rapid screening of commercial milk powder products as authentic or being mixed with known and unknown adulterants. Milk powder is a known target of adulteration, ranking only second to olive oil according to the USP database on food fraud and economic adulteration. Milk powder adulteration can cause adverse health effects, as highlighted by two incidents of milk and wheat gluten adulteration with melamine. One incident was linked to renal failure in cats and dogs due to pet food adulteration in the United States. The other was linked to infant formula in China, causing thousands of cases of renal complications in children as well as at least six confirmed deaths. A number of commercially available milk powder samples were procured for the study, representing manufactured products in sixteen different states and twenty-four different companies and brands. Eleven different milk powder adulterants were selected for the study based on their history or potential use as adulterants. These can be divided into four categories: 1. Low Molecular Weight, Nitrogen-Rich Compounds, 2. Plant Proteins, 3. Inorganic Salts, 4. Non-Fat Solids. Some of the adulterants were blended as well to increase the scope of the potential adulterants that could be used. Different levels of all adulterants were mixed with the pure milk powder samples before NIR spectra were collected. Three different spectrometers were used for the study: Two benchtop FT-NIR instruments and a handheld NIR device. Principle Component Analysis (PCA) was performed on all three sets of data and SIMCA classification models were created for determining the presence of an adulterant in the milk powder. After model creation, separate test sets of both pure and adulterated samples were scanned for model validation.
FT-NIR Spectrometer #1
Instrument Parameters:
12500 cm-1 to 4000 cm-1, sixty-four scans per average, 16 cm-1 spectral resolution
100% Correct Adulterant Classification and Concentration (%w):
| Melamine | 0.6% to 2.0% |
| Dicyandiamide | 2% |
| Aminotriazole | 0.4% to 2.0% |
| Biuret | 0.2% to 2.0% |
| Soy Protein Isolate | 5% to 20% |
| Pea Protein Isolate | 5% to 20% |
| Calcium Carbonate | 2% |
| Maltodextrin | 2% to 20% |
| Sucrose | 7% to 50% |
FT-NIR Spectrometer #2
Instrument Parameters:
10000 cm-1 to 4000 cm-1, thirty-two scans per average, 16 cm-1 spectral resolution
100% Correct Adulterant Classification and Concentration (%w):
| Melamine | 0.4% to 2.0% |
| Aminotriazole | 0.4% to 2.0% |
| Biuret | 0.2% to 2.0% |
| Cyanuric Acid | 2% |
| Soy Protein Isolate | 5% to 20% |
| Pea Protein Isolate | 2% to 20% |
| Maltodextrin | 5% to 20% |
| Sucrose | 10% to 50% |
Handheld Spectrometer
Instrument Parameters:
6266 cm-1 to 4167 cm-1, 10 scans per average, 11 nm optical resolution
100% Correct Adulterant Classification and Concentration (%w):
| Biuret | 0.4% to 2.0% |
Results for all three spectrometers are shown above. Both FT-NIR benchtop spectrometers showed 100% specificity and accuracy for determining the presence of an adulterant in milk powder if the adulterant was at a sufficiently high percentage, which varied based on the type of adulterant present. In the case of the handheld NIR device, results were much worse. This is most likely due to a narrower wavelength range and lower resolution than the benchtop FT-NIR instruments. The results here prove the feasibility of using FT-NIR spectrometers as a tool for determining the presence of adulterant in milk powder and show that FT-NIR spectrometers are much better suited for such analysis than handheld NIR spectrometers.
https://www.heliyon.com/article/e00806/pdf
Cheese
Screening of Grated Cheese Authenticity by NIR Spectroscopy – Cevoli, Fabbri, Gori, et al., Journal of Agricultural Engineering 2013; volume XLIV(s2):e53
 Parmigiano-Reggiano (PR) cheese is one of the oldest traditional cheeses produced in Europe and has a Protected Designation of Origin in Italy. It is manufactured exclusively from whole PR wheels that correspond to the production standard. Grated PR cheese must be matured for a period of twelve months and characterized by a rind content of less than 18%. NIR spectroscopy was examined as a method for determining the authenticity of PR grated cheese. Four hundred samples were procured for the study with the following classifications: Compliance PR, Non-Compliance PR, PR with Rind Content > 18%, and Competitors (various commercial brands of grated cheeses obtained from local markets). NIR spectra were collected using an FT-NIR spectrometer in diffuse reflectance mode from 12500 cm-1 to 4000 cm-1. Thirty-two scans were averaged per spectrum and 8 cm-1 spectral resolution was used. Three replicate spectra were collected per sample. Various pre-processing treatments were performed on the NIR spectra. Principle Component Analysis (PCA) was first performed as an exploratory tool to define discrimination between Compliance and Non-Compliance PR samples or Competitors. Artificial Neural Network (ANN) models were created using software to test the feasibility of predicting each specific class from the spectral data. Reference values of Rind % and Months of Ripening were used with the NIR spectra to create Partial Least Squares (PLS) regression models for predicting these values from the spectra.
ANN:
| Compliance PR Classification | 100% for Training Set | 100% for Validation Set |
| Competitors Classification | 100% for Training Set | 95.5% for Validation Set |
| Non-Compliance PR Classification | 100% for Training Set | 100% for Validation Set |
| Rind Content > 18% Classification | 100% for Training Set | 100% for Validation Set |
PLS:
| Rind % | R² = 0.982 | RMSEP= 1.473% |
| Months of Ripening | R² = 0.986 | RMSEP= 0.805 |
The results obtained in this study for both types of models were excellent and confirmed the ability of NIR spectroscopy to be used as a screening tool for determining grated cheese authenticity. The ANN model was able to 100% predict compliance or non-compliance in PR samples and detect competitor grated cheese at an accuracy above 95%. More competitor samples in the model will likely improve these results. In the case of PLS, the results were especially good considering there was some question in the reference values for rind %. A regression model can only predict within the error of the reference method and these results should improve as well with more accurate reference testing. Ripening can be predicted to within an accuracy of less than one month. NIR spectroscopy can be used as a fast, non-destructive screening tool for determining the authenticity of grated cheese.
Butter
Robust New NIRS Coupled With Multivariate Methods for the Detection and Quantification of Tallow Adulteration in Clarified Butter Samples – Mabood, Abbas, Jabeen, et al., Food Additives & Contaminants: Part A, 35:3, 404-411
Food adulteration has become a big problem on a global scale during recent years. Increased population, higher supply and demand for food, and less detectable methods of adulteration have all contributed to the problem. Food authenticity and detection of adulteration have become a priority for both food producers and consumers, as adulteration results in reduced profits, bad publicity, and in some cases, presents a health risk to the public. Dairy products are no exception to the adulteration issue and one potential adulterant in butter is tallow, an animal fat material which causes increased serum cholesterol and triglycerides levels when consumed. Tallow is even used to make candles and soap and is obviously an unsuitable substitute for butter at any concentration. Visual examination is difficult for determining the presence of adulterants and wet chemistry methods are time-consuming and expensive. NIR spectroscopy was examined as a fast method requiring little sample preparation for determining the presence of tallow adulterant in butter. Nine portions of pure butter samples with no tallow adulteration were set aside. Tallow was prepared by melting animal fat and collecting the oil portion poured out from the solid residue. Nine samples of each of the following tallow concentrations by weight in butter were prepared: 1%, 3%, 5%, 7%, 9%, 11%, 13%, 15%, 17%, and 20%. Including the nine samples with no tallow adulteration, a total of ninety-nine samples were used for the study. NIR spectra were collected in reflectance mode from 10000 cm-1 to 4000 cm-1 using 2 cm-1 resolution. A transflectance sample accessory with a total pathlength of 0.5 mm was used for collection. Various pre-treatments were performed on the NIR spectra, after which Principle Component Analysis (PCA), Partial Least Squares-Discriminant Analysis (PLS-DA), and Partial Least Squares (PLS) chemometric methods were used to build the models.
PLS-DA
| Predict Value (0 = no tallow, 1 = presence of tallow) | R² = 0.95 | RMSEP= 0.062 |
PLS
| Tallow % | R² = 0.973 | RMSEP= 1.537% |
The results presented were excellent and proved the feasibility of using NIR spectroscopy to determine the presence of tallow adulterant in butter as well as quantitatively measure the amount of tallow with reasonable prediction error. After various pre-treatments were performed, the wavenumber range from 7500 cm-1 to 4000 cm-1 using first derivative with fifteen smoothing points was used for the calibration models. Examination of the scores plot after PCA showed clear classification and separation between each group of samples, proving that changes to the NIR spectra occur as more tallow is added to the samples. PLS-DA uses the arbitrary values of 0 and 1 for classification purposes between two groups. The model generates a number based on NIR spectra. A number less than 0.5 classifies as the group assigned to 0 and a number greater than 0.5 classifies as the group assigned to 1. In this case, the RMSEP of 0.062 is more than accurate enough to classify the sample as non-adulterated or adulterated. PLS predicts a quantitative value from NIR spectra and a calibration model. The RMSEP shows a prediction accuracy with error slightly greater than 1.5% tallow, which is accurate enough for real-time use. In order to properly validate the model, 30% of the samples were removed from the PLS model, a new model was created without those samples, and the NIR spectra of those samples were used with the new model to predict the percentage of tallow adulteration. These results proved the validity of the model and all predictions showed an error of less than 2% tallow. More samples over the range of values encompassing different types of butter will improve the results and make the model robust enough for universal application for tallow adulteration screening of butter.
https://tandfonline.com/doi/abs/10.1080/19440049.2017.1418090?journalCode=tfac20
Yogurt
The Feasibility of Using Near-Infrared Spectroscopy and Chemometrics for Untargeted Detection of Protein Adulteration in Yogurt: Removing Unwanted Variations in Pure Yogurt – Xu, Yan, Cai, et al., Journal of Analytical Methods in Chemistry, Volume 2013, Article ID 201873
 In recent years, scandals involving dairy product adulteration have led to the development of new targeted analytical methods to detect the presence of adulterants. Melamine has especially been examined as a milk adulterant but new types of adulterants are being reported all the time. One such adulterant is different types of non-milk proteins in yogurt. Because of the evolving nature of adulterants, new types of untargeted analyses are needed to determine whether or not a product is pure and unadulterated, with the focus being on not necessarily identifying the specific adulterant but rather determining the presence of one. If a product is determined to be impure, further testing can be done to identify the adulterant. NIR spectroscopy was examined as a method for protein adulteration identification in yogurt. Yogurt was manufactured from milk and bacteria cultures using the standard method specifically for the study. The yogurt was divided into nineteen portions. Three portions were kept pure with no adulterant. Six portions were adulterated with edible gelatin ranging from 1% to 8% by weight. Five portions were adulterated with industrial gelatin ranging from 0.5% to 5% by weight. Five portions were adulterated with soy protein powder ranging from 0.5% to 5% by weight. In order to keep the thickness uniform in all the samples, pure water was added which is the common practice in protein adulteration. NIR spectra of both the pure and adulterated samples were collected from 12000 cm-1 to 4000 cm-1 in diffuse reflectance mode. Spectral resolution was 8 cm-1, scanning interval was 3.857 cm-1, and sixty-four scans were collected per reading and averaged into one spectrum. In total after dividing the portions, sixty spectra of pure samples and one hundred ninety-seven spectra of adulterated samples were collected. Spectrum of pure water was collected by averaging five measurements of water film on the reflectance background. In order to remove the influence of water variation, all NIR spectra of the pure and adulterated yogurt samples were orthogonally projected (OP) on the complement space of water spectrum using an algorithm, minimizing the influence of the water difference on the classification. Standard Normal Variate (SNV) processing was used as well to reduce scattering effects and correct interference caused by variations. The groups were divided into a training set and test set and the OCPLS class modeling algorithm was used to classify samples using the following sets of NIR spectra: raw spectra, OP, and SNV.
OCPLS Classification:
| Raw Spectra Test Set | 17/20 |
| Raw Spectra Training Set | 163/197 |
| SNV Spectra Test Set | 18/20 |
| SNV Spectra Training Set | 181/197 |
| OP Spectra Test Set | 18/20 |
| OP Spectra Training Set | 181/197 |
The results showed that both pre-processing methods had a positive effect on the models, with the OP spectra classification showing slightly better results than the SNV spectra classification. Because water has such a strong absorbance in the NIR wavelength range, it is possible that without pre-processing, the results for the raw spectra and SNV may be classifying based on the differences in water and not the presence of an adulterant. Careful analysis of the wavelength ranges used to determine the classification will show this, but such analysis was not performed in this study. One purpose of analyzing the classification in this manner was to determine the minimum threshold for each adulterant that could be detected from the NIR spectra. None of the non-adulterated samples were incorrectly classified as having an adulterant present. For the samples that were incorrectly classified as being pure while having an adulterant present, the concentration was 0.5% for edible gelatin, 1% for industrial gelatin, and 1% for soy protein powder. All samples with an adulterant concentration of 1% edible gelatin, 2% industrial gelatin, and 2% soy protein powder (or higher) were correctly classified. These can be considered the safe thresholds of detection that the models can accurately use to detect protein adulteration in yogurt. The potential was demonstrated to use NIR spectroscopy as a method for protein adulteration in screening of yogurt and further work with a larger sample set at lower concentrations of protein adulterants should improve the results.
The post Dairy Adulterant Analysis appeared first on NIR-For-Food.
]]>The post Cocoa & Chocolate Analysis appeared first on NIR-For-Food.
]]>Introduction
Cocoa beans are the raw material for making cocoa powder, cocoa butter, and chocolate. They are seeds from the tropical cacao tree and are grown in areas of the world within 20° latitude of the Equator. Cocoa powder is the leftover component after cocoa butter has been extracted from chocolate liquor, which is made by grinding roasted cocoa beans into a liquid state. Chocolate is made from the chocolate liquor and cocoa butter after removing the cocoa powder. Other ingredients are added as well, including sugar, milk in milk chocolate, and vanilla in some types of chocolate. World production of cocoa was 3,455,622 metric tons in 2013 and is projected to grow to a $2.1 billion value with a CAGR of 3.1% by the end of 2019. The chocolate market is projected to grow to $131.7 billion with a CAGR of 2.3% by the end of 2019. Factors driving growth include larger markets in developing countries, increasing urbanization and widespread availability, new applications in food and confectionary products, and increased sales of seasonal, festive, and niche chocolate products. Proper quality control at all stages of the cocoa & chocolate manufacturing process is essential for a good finished product. Parameters of interest in cocoa beans include protein, fat, moisture, ash, carbohydrates, and color measurements. It is important to properly classify varieties of beans as well as different varieties have a large impact on the physical and chemical properties of the final product. Fermentation level of beans is a strong indicator for evaluating dry cocoa quality. Mixtures and formulas during the chocolate manufacturing process are proprietary and are always kept as a closely guarded secret by chocolate makers. The final stage in chocolate manufacturing is tempering, which entails heating and cooling the chocolate to change different cocoa butter crystallization patterns that form into the desired final crystallization structure. The physical parameters that need to be monitored for optimization of this process cannot be monitored in real-time by current methods. Current methods for testing parameters of interest in cocoa and chocolate are expensive, laborious, and time-consuming, especially when implemented in a process setting. In-line monitoring is impractical and sometimes impossible. There is a need for fast, cost-effective, and real-time monitoring of parameters at all stages of the cocoa & chocolate manufacturing process. One such method that has been examined is NIR spectroscopy.
Analytes
- Protein
- Moisture
- Fat
- Ash
- Carbohydrates
- Color (Lightness, Redness, Yellowness)
- Varietal Classification
- Fermentation Index
- pH
- Total Polyphenols
- Ammonia Nitrogen
- Viscosity
- Enthalpy
- Slope (Second point of inflection of a temper curve)
Summary of Published Papers, Articles, and Reference Materials
 Measurement of chemical parameters in major constituents of cocoa and chocolate for quality control purposes has been studied using NIR spectroscopy. The results of most studies have been promising. One study examined measuring various chemical and physical parameters in cocoa beans as well as classifying them based on variety. The study also compared results for calibration models made from both intact and ground beans. Results show classification of cocoa beans is feasible using differences in NIR spectra and that protein, moisture, fat, ash, carbohydrates, and color parameters could all be quantitatively measured from NIR spectra and calibration models. Another study assessed using both NIR spectroscopy and Electronic Tongue (ET) sensor measurements in combination to classify cocoa beans. 100% correct classification of beans was achieved using data from both technologies and modeling algorithms. Two separate studies evaluated measuring quality and fermentation parameters in cocoa beans using NIR spectroscopy. The first study assessed three important quality parameters: fermentation index, pH, and total polyphenols. Fermentation index and pH are direct fermentation measurements while total polyphenols are a good indicator of antioxidants. Results were good enough for screening purposes but would likely improve with a larger sample set and wider range of values. The second study measured ammonia nitrogen in cocoa beans, considered a good indicator of fermentation time. Results were excellent and showed high correlation between the NIR spectra and calibration model, showing the potential to replace the expensive and time-consuming Conway reference method with NIR spectroscopy. Tempering is one of the most crucial parts of the chocolate making process and NIR spectroscopy was examined as a method for measuring physical parameters related to rheological data that are directly affected by input variables of the crystallizer. Good correlations were obtained for viscosity, enthalpy, and slope (a measurement related to the temper curve), indicating that NIR spectroscopy has the potential to be used as a real-time process control tool for optimizing the tempering process.
Scientific References and Statistics
Classification and Compositional Characterization of Different Varieties of Cocoa Beans by Near Infrared Spectroscopy and Multivariate Statistical Analysis – Barbin, Maciel, Bazoni, et al., Journal of Food Science and Technology, July 2018 55(7): 2457-2466
Cocoa beans of different varieties present inherent challenges in assessing compositional information for quality control and monitoring of processing activities after harvesting. The use of genetic breeding to develop high resistance to plant diseases has made the assessment of compositional information even more challenging. NIR spectroscopy was examined as a method for differentiating varieties of cocoa beans and assessing chemical and physical parameters of interest. Parameters in the study were protein, fat, moisture, ash, carbohydrates, and three different color measurements (lightness – L*, redness – a*, and yellowness – b*). Five different varieties of cocoa beans ranging from fourteen to eighteen fruits each were procured for the study. All samples were processed through the standard procedure of breaking the pod, fermentation for five days, and sun-drying for seven days before analysis. NIR spectra were collected in reflectance mode on the intact beans from 400 nm to 2498 nm at 2 nm intervals. A portion of each sample was ground and the NIR spectra collection process was repeated. Standard methods were used to determine reference values for the parameters of interest. Chemometric models were created using the NIR spectra for both the intact bean and ground samples for comparative purposes. Principle Component Analysis (PCA) was first performed to assess the feasibility of classifying the different varieties of cocoa beans from the NIR spectra. Partial Least Squares (PLS) regression models were created to correlate the NIR spectra to each individual parameter of interest. For the color parameters, only the ground bean NIR spectra were used for PLS analysis. Various pre-processing methods were applied to the NIR spectra before modeling and the results below show the best models obtained for classification and each individual parameter.
PCA
Intact Beans: 98% of Variance Explained by Three Principle Components
Ground Beans: 98% of Variance Explained by Three Principle Components
PLS
Intact Beans:
| Protein | R² = 0.99 | RMSEP= 0.18% |
| Moisture | R² = 0.98 | RMSEP= 0.17% |
| Fat | R² = 0.98 | RMSEP= 0.42% |
| Ash | R² = 0.97 | RMSEP= 0.05% |
| Carbohydrates | R² = 0.96 | RMSEP= 0.36% |
Ground Beans:
| Protein | R² = 0.98 | RMSEP= 0.14% |
| Moisture | R² = 0.98 | RMSEP= 0.17% |
| Fat | R² = 0.99 | RMSEP= 0.25% |
| Ash | R² = 0.96 | RMSEP= 0.06% |
| Carbohydrates | R² = 0.99 | RMSEP= 0.22% |
| L* | R² = 0.87 | RMSEP= 0.79 |
| a* | R² = 0.88 | RMSEP= 0.37 |
| b* | R² = 0.96 | RMSEP= 0.56 |
Modeling results were excellent for all parameters and proved the feasibility of using NIR spectroscopy as a method for classifying cocoa beans and measuring parameters of interest for quality control. Principle Components in a PCA model are iterations that use differences in the data set to see if variation can be explained. In this case, 98% of the variance is explained using three Principle Components in both PCA models proves that enough difference exists in NIR spectra of different bean varieties to use the spectra to classify them. In the case of the PLS models, the difference in the results between the ground bean and intact bean models was statistically insignificant. In a real-time setting, a sampling system requiring no grinding of the samples is preferable and would keep sample preparation of the beans to a minimum. In the case of the color measurement models, the results were worse than the chemical parameter models but this is likely due to a lack of homogeneity in the color of the samples, even when ground. In order to use these models on a universal level for cocoa beans, more samples and varieties must be added, but the potential for using NIR spectroscopy for cocoa bean analysis and quality control was shown in this study.
https://link.springer.com/article/10.1007/s13197-018-3163-5
Integrating NIR Spectroscopy and Electronic Tongue Together with Chemometric Analysis for Accurate Classification of Cocoa Bean Varieties – Teye, Huang, Takrama, Haiyang, Journal of Food Process Engineering 37 (2015) 560-566
NIR spectroscopy and Electronic Tongue (ET) were examined together as a method for classifying cocoa bean varieties. An ET sensor uses seven potentiometric chemical sensors that all differ in the five tastes: sourness, saltines, sweetness, bitterness, and savory. One gram of each sample is weighed and 100 mL of boiled distilled water is added. Samples are cooled, filtered, and the filtrate is used for ET analysis. Five varieties of twenty samples each of cocoa beans were procured for the study. All samples were ground and sieved before both NIR and ET analysis. NIR spectra were collected from 10000 cm-1 to 4000 cm-1 at 3.856 cm-1 interval using 8 cm-1 resolution. Thirty-two scans were collected and averaged into one spectrum for each sample. After ET analysis, different algorithms were performed on both the NIR and ET data. Standard Normal Variate (SNV) treatment was performed on the NIR spectra to remove slope variation and scatter effects. After SNV transformation, the wavenumber range from 9500 cm-1 to 7500 cm-1 was chosen for further analysis. Principle Component Analysis (PCA) was performed for the selection of optimum variables from both the NIR spectra and ET data. Support Vector Machine (SVM) is a non-linear supervised pattern recognition method that was used to create classification models from the NIR spectra, ET data, and the combination of NIR spectra and ET data after data fusion. Data fusion was performed after PCA on both sets of data to choose the optimum variables. Both sets were scaled by normalization and merged as one input for the SVM model. Out of the one hundred total samples, sixty-five were used for the classification models and thirty-five were used for a validation set.
SVM:
| NIR Data Correct Classification | 92.0% |
| ET Data Correct Classification | 80.0% |
| Combined NIR and ET Data Correct Classification | 100.0% |
The best results were shown using the combined data set after PCA and SVM modeling. SVM is particularly used for non-linear techniques and reference values obtained on samples for protein, ash, pH, and moisture showed a marked difference in those values for the different varieties of samples. The potential was shown in this study for an accurate and rapid solution to classification problems in cocoa beans using both NIR spectroscopy and ET analysis. Such analysis could be a useful tool in both quality assurance of beans and development of breeding programs.
https://onlinelibrary.wiley.com/doi/abs/10.1111/jfpe.12109
Non-Destructive Determination of Cocoa Bean Quality Using FT-NIR Spectroscopy – Sunoj, Igathinathane, Visvanathan, Computers and Electronics In Agriculture 124 (2016) 234-242
Adulteration is a big problem in the food industry and cocoa beans are no exception. Assessing bean quality and variety is important as beans can vary in their chemical composition. Misrepresenting a higher quality bean variety with a lower quality bean is one potential form of adulteration. Another form of adulteration is to mix under-fermented beans with ones that are fermented to the proper state. Three important quality parameters are fermentation index, pH, and total polyphenols. Fermentation index directly measures degree of fermentation. Unfermented beans have a pH of 5.5-5.8 while properly fermented beans have a pH of 4.75-5.19. Polyphenols serve as an antioxidant, adding to the nutritional value of beans as well as imparting astringency and bitterness. NIR spectroscopy was examined a method for determining these three quality parameters in cocoa beans. Ripe cocoa pods were directly procured after harvesting for the study. Four portions of fifty pods each were stored at ambient temperature and relative humidity for a period of zero, seven, fourteen, and twenty-one days. At the end of each period, the fifty pods were split open and fermentation was initiated. For each day of fermentation (over six days), 150 g of sample was pulled for collecting NIR spectra and reference test analysis. NIR spectra were collected using an FT-NIR spectrometer from 12500 cm-1 to 3600 cm-1 averaging sixty scans per spectrum at 8 cm-1 resolution. Various pre-treatments were performed on the NIR spectra before Partial Least Squares (PLS) chemometric analysis and standard reference methods were used to obtain values for fermentation index, pH, and total polyphenols.
| Fermentation Index | R² = 0.88 | RMSEP= 0.06 |
| pH | R² = 0.76 | RMSEP= 0.26 |
| Total Polyphenols | R² = 0.84 | RMSEP= 0.93 mg/g |
The study demonstrated the potential for measuring fermentation index, pH, and total polyphenols using NIR spectra and PLS calibration models. While correlation coefficients for the models was not particularly high, independent predictions using cross-validation generally agreed with the reference values. Results should improve with more samples and a larger range of reference values. The small range of values for pH very likely contributed to poorer results than those shown for fermentation index and total polyphenols. It is estimated that performing reference tests for these three parameters would take approximately twenty-eight hours. Using NIR spectroscopy to measure them would take approximately a minute, justifying continued work and study of the feasibility of the NIR method.
https://www.sciencedirect.com/science/article/pii/S0168169916301284
Near Infrared Spectroscopy as a New Tool to Determine Cocoa Fermentation Levels Through Ammonia Nitrogen Quantification – Hue, Gunata, Bergounhou, et al., Food Chemistry 148 (2014) 240-245
Fermentation is a key step in producing quality cocoa. In the experience of cocoa and chocolate manufacturers, a direct correlation exists between the level of ammonia nitrogen (NH3) and fermentation level, making ammonia nitrogen a good fermentation marker. It has also been demonstrated that ammonia nitrogen level varies in beans of different geographical origin. Because of this, manufacturers must refer to their own background knowledge to determine the fermentation level when assessing proper conditions for optimum fermentation of beans. The current reference test used for determining ammonia nitrogen is the Conway method, which is expensive and time-consuming. A fast, non-invasive technique for determining ammonia nitrogen would be useful for manufacturers and NIR spectroscopy was examined for this purpose. Over thirty total micro-fermentation trials were carried out in seven different countries for the study. The standard fermentation technique for cocoa beans was implemented over six days for each trial. Samples were stirred at various points during fermentation and pulled from various sections of the fermentation boxes. Temperature was monitored for most of the samples. In total, seven hundred eighteen samples were created during the trials. Of these, one hundred and ninety were chosen for wet chemistry and NIR analysis according to a design of experiment conducted to determine the optimum sample set encompassing different variables such as temperature and box positioning. NIR spectra were collected in reflectance mode from 400 nm to 2500 nm in 2 nm intervals averaging 32 scans per spectrum. The Conway method was used to obtain reference values for ammonia nitrogen, with samples ranging from 25 ppm to 441 ppm. A Partial Least Squares (PLS) model was created using the NIR spectra and reference values.
| Ammonia Nitrogen | R² = 0.975 | RMSEP= 16 ppm |
 The model results showed excellent correlation between the NIR spectra and reference values for ammonia nitrogen, indicating that NIR spectroscopy can be used as a reliable and efficient method for determining ammonia nitrogen content in cocoa beans. Statistical analysis confirmed that ammonia nitrogen is produced during fermentation of the beans. The amount produced is a function of fermentation, sum of temperatures, and geographical origin. The robust design of this study obtained a good picture of fermentation heterogeneity. However, it must be noted that because of the small concentration of ammonia nitrogen, it is likely that the PLS model is using an indirect correlation with another physiochemical change related to the change in ammonia nitrogen. It is also possible that this indirect correlation is a direct measurement of fermentation. While indirect correlations in regression models are acceptable in NIR spectroscopy, such models must be carefully examined and validated to prove that the correlation is reliable. Adding more samples from different parts of the world to the study will increase the robustness of the model and give farmers a tool to manage fermentation in real-time as well as provide a quality control screening tool for cocoa and chocolate manufacturers when purchasing cocoa beans.
https://www.sciencedirect.com/science/article/pii/S0308814613014374
In-Line Measurement of Tempered Cocoa Butter and Chocolate by Means of Near-Infrared Spectroscopy – Bolliger, Zeng, Windhab, JAOCS, Vol. 76, no. 6 (1999)
Tempering is one of the main process steps for determining product quality in chocolate manufacturing. The objective is to produce cocoa butter crystal nuclei in the preferred modification for ideal texture and melting point. It has been shown that in a shear crystallizer, the mechanical energy input has a significant influence on viscosity, enthalpy, and slope (defined as the second point of inflection of a temper curve). Defined relationships exist between rheological data and temper curve measurements but obtaining this rheological data in real-time is impractical. NIR spectroscopy was examined as a method for determining viscosity, enthalpy, and slope in pre-crystallized cocoa butter. A crystallizer was set up using the standard tempering method for the study. Mass flow, rotor speed, and outlet temperature were all set and monitored through the process. The constant cooling temperature was varied during the runs. Samples were pulled directly from the process and NIR spectra were immediately collected after a crystal had nucleated. Samples were scanned from 1000 nm to 2500 nm using a reflectance probe. There was a 5 mm gap between the end of the probe and reflection surface where the samples were placed. After the NIR spectra were collected, viscosity, enthalpy, and temper curve values were obtained using standard reference methods. Partial Least Squares (PLS) regression models were created using the NIR spectra and reference values for the parameters of interest.
| Viscosity | R² = 0.970 |
| Enthalpy | R² = 0.975 |
| Slope | R² = 0.945 |
Correlation for all three parameters was excellent and the models were tested in a new set of experiments using a constant outlet temperature of 25°C. Both the viscosity and enthalpy were shown to increase as the rpm of rotor speed accelerated during the tempering process, which is the expected result. At 700 rpm, a peak was reached. Similar results were shown for the slope measurements. It is suggested that the results here indicate that NIR spectra can be correlated with microstructural information related to the size, shape, and quantity of cocoa butter crystals. Further statistical analysis such as selective wavelength ranges correlating to the known regions for overtone vibrations of cocoa butter molecules would help further prove the validity of the correlation. The results here do show the potential for monitoring the tempering process in chocolate manufacturing using NIR spectroscopy.
https://link.springer.com/article/10.1007%2Fs11746-999-0157-5
The post Cocoa & Chocolate Analysis appeared first on NIR-For-Food.
]]>The post Cheese Analysis appeared first on NIR-For-Food.
]]>Introduction
Cheese is a dairy product derived from milk and is produced in a variety of flavors and textures. It comprises proteins and fat from milk and forms by coagulation of the milk fat casein. The milk is often acidified and the addition of the enzyme rennet causes the coagulation. Most cheeses are made from whole cow milk, with worldwide production of 18.7 million metric tons in 2014. The United States accounts for approximately 29% of this production, with various European countries accounting for most of the rest. Other types of milk used for cheese are skimmed cow, goat, sheep, and buffalo milk. There are approximately five hundred different varieties of cheese recognized by the International Dairy Federation and strict standards are often applied to these different varieties based on many factors. While cheese manufacturing methods can vary greatly for different types of cheese, the constituents and parameters of interest during the manufacturing process are usually similar. Parameters such as fat, protein, moisture, dry matter, and acidity are critical in nearly all types of food manufacturing and these are very important in cheese as well. Cheesemaking is a highly selective skill and the cheesemaker is often reliant on sensory skills and chemical analysis to determine if the cheese being made is going to meet quality standards. After the manufacturing process, aging is also critical for many types of cheese as many physical parameters and flavor are finalized with age. In the case of fresh cheese, proper transport, temperature, and handling are critical as the shelf-life for such cheeses is often very short. Adulteration and authenticity are issues with cheese as well, especially in cheese manufactured in specific regions according to strict standards. Current methods for testing these parameters are expensive, laborious, and time-consuming, especially when implemented in a process setting. The timing aspect is especially critical for cheese because the time of steps as the process progresses can be quite short and there is often little time to make adjustments if needed. There is a need for fast, cost-effective, and real-time monitoring of parameters at all stages of the cheese manufacturing process. One such method that has been examined is NIR spectroscopy.
Analytes
- Dry Matter (DM)
- Fat
- Crude Protein (CP)
- pH
- Penetration
- Protein
- Moisture
- Total Solids
- Sodium Chloride (Salt)
- Total Nitrogen
- Tyrosine
- Tryptophan
- Shelf Life
- Adulteration and Authenticity
- Rind %
- Months of Ripening
Summary of Published Papers, Articles, and Reference Materials
Measurement of chemical parameters in major constituents of cheese for quality control purposes has been studied using NIR spectroscopy. The results of most studies have been promising. One study examined monitoring the following important parameters of processed cheese manufacturing: dry matter (DM), fat, crude protein (CP), pH, and the rheological property penetration. Results were excellent for DM, fat, and CP and are considered good enough for real-time analysis. pH and penetration results are considered good enough for screening purposes. Fat, protein, and moisture are essential components in food manufacturing and cheese is no exception. These parameters were examined in ricotta cheese for NIR spectroscopic analysis, showing excellent results for fat and protein. Results for moisture were not as good but this is likely due to all samples having a high moisture content and a wider range in the sample set will improve results, as moisture is well-known to be a measurable constituent using NIR spectroscopy because of high absorption from water. Curd formation and cutting is an important step in cheese manufacturing. NIR spectroscopy was examined to compare results between regression models for total solids and protein in both non-homogenized and homogenized samples of cheese curds. The results were excellent and comparable for both models, indicating the potential to use NIR spectroscopy as a method for real-time measurements of these parameters in an industrial setting. Another comparative study was conducted to measure fat, protein, and sodium chloride (NaCl) in processed cheese that was both unwrapped and wrapped in polyethylene (PE) film. As was the case with the cheese curd study, the results showed little difference in performing these measurements between the wrapped and unwrapped samples and proved the feasibility of measuring these constituents in processed cheese wrapped in PE film. Aging of cheese is important and many of the main parameters that are measured during cheese manufacturing do not change discernably during the aging process. Total nitrogen and amino acids are two parameters that change with aging and NIR spectroscopy was examined to measure total nitrogen, tyrosine, and tryptophan. Results were good for total nitrogen but a lot of variability was shown during validation analysis for the amino acids. This likely occurred due to reference error and low concentration of the constituents, but there is potential to use NIR spectroscopy as a screening tool for measuring amino acids. Shelf-life of fresh cheese is critical and samples of Crescenza cheese were examined using both FT-NIR and FT-IR spectroscopy to determine the feasibility of classifying this cheese based on shelf-life. Classification analysis showed that both sets of spectral data can determine whether a sample is fresh, aged, or old. Adulteration is a major problem in the food industry and grated cheese samples were examined to determine authenticity based on standards for Parmigiano-Reggiano (PR) cheese in Italy. Results showed that NIR spectra could be used to classify both compliance and non-compliance based on standards and could also distinguish between PR cheese and competitor brands of cheese. Rind % and months of ripening were quantified with reasonable accuracy as well from the NIR spectra and calibration models.
Scientific References and Statistics
NIR Spectroscopy: A Useful Tool for Rapid Monitoring of Processed Cheeses Manufacture – Curda, Kukackova, Journal of Food Engineering 61 (2004) 557-560
Rapid monitoring of processed cheese manufacture is essential to obtain a high-quality product with minimal cost. NIR spectroscopy was examined as a method for assessing dry matter (DM), fat, crude protein (CP), pH, and the rheological property penetration in processed cheese samples. Fifty processed cheese samples from fourteen different Czech producers were procured for the study. Samples were left at room temperature for a minimum of twelve hours before being scanned. NIR spectra were collected using an FT-NIR spectrometer and a fiber optic probe from 900 nm to 2500 nm. Three separate spectra were collected from three different points on each sample and averaged into one spectrum. Standard reference methods were performed on the samples and the NIR spectra and reference values were used to create Partial Least Squares (PLS) regression models to correlate the spectra to the parameters of interest. Various pre-processing methods and selective wavelength ranges were used to optimize the calibration models.
| DM | R² = 0.998 | RMSEP= 0.429% |
| Fat | R² = 0.995 | RMSEP= 0.997% |
| CP | R² = 0.996 | RMSEP= 0.303% |
| pH | R² = 0.945 | RMSEP= 0.062 |
| Penetration | R² = 0.925 | RMSEP= 1.330mm |
Both the DM and fat models used the pre-processing method Multiplicative Scatter Correction (MSC) and selective wavelength ranges (1200 nm to 2200 nm for DM and 1000 nm to 2200 nm for fat) for model optimization. CP used no pre-processing but a selective wavelength range from 900 nm to 2400 nm. pH and penetration used the full wavelength range and no pre-processing. Results were excellent for DM, fat, and CP and were good enough to use these models for real-time analysis of manufactured cheese. Results were still good for pH and penetration but are better suited to estimate the values. Cross validation testing indicates that the lower precision for these two parameters is likely due to a small range of values for pH and error in the reference method for penetration.
https://www.sciencedirect.com/science/article/abs/pii/S0260877403002152
Determination of Fat, Protein, and Moisture in Ricotta Cheese By Near Infrared Spectroscopy and Multivariate Calibration – Madalozzo, Sauer, Nagata, Journal of Food Science & Technology, March 2015 52 (3): 1649-1655
NIR spectroscopy was examined as a method for determining fat, protein, and moisture in ricotta cheese without any complex sample preparation. Nineteen samples of ricotta from different manufacturers in the southern region of Brazil were procured for the study. Sample varieties were fresh, pressed, conventional, and low-fat. Each sample was cut to provide a flat surface representative of the interior. NIR spectra were collected in diffuse reflectance mode from 1100 nm to 2500 nm using 1 nm resolution. Two different portions of each sample were scanned for thirty-eight total spectra. Thirty-three spectra were used for a calibration set and the remaining five were used for a validation set. Standard reference methods were performed on the samples to obtain fat, protein, and moisture values. Reference values and the NIR spectra were used to create Partial Least Squares (PLS) calibration models correlating the spectral data to the parameters of interest.
| Fat | R² = 0.968 | RMSEP= 1.3% |
| Protein | R² = 0.968 | RMSEP= 0.7% |
| Moisture | R² = 0.851 | RMSEP= 2.7% |
There was a large amount of variability observed in the reference tests for the samples among the same varieties of samples, especially for fat and protein. While this variability is good for creating regression models, it does lend concern to commercial samples because ricotta is often used by people with dietary restrictions. Correlation was excellent for fat and protein and the validation set predictions proved the validity of the models. In the case of moisture, the variability in samples was lower but all samples surpassed the high moisture threshold of 55% for classification by Brazilian standards. A sample set with a wider range of values should improve the moisture model. Overall, this study proved the feasibility of using NIR spectra and regression models to determine fat, protein, and moisture in ricotta without using wet chemistry methods and requiring minimal sample preparation.
https://www.ncbi.nlm.nih.gov/pmc/articles/PMC4348305/
Using Near Infrared Spectroscopy for the Determination of Total Solids and Protein Content in Cheese Curd – Sultaneh, Rohm, International Journal of Dairy Technology, Volume 60, No.4, November 2007
Curd formation followed by curd cutting is considered to be one of the most essential steps in cheese manufacturing. Continuous information about the composition of cheese curd during processing (such as during drainage on conveyor belts between the cheese vat and pre-pressing unit) could help control the cheesemaking process, leading to improvements in quality. One previous study did measure total solids and protein in cheese curd but required excessive sample preparation that would not be applicable to on-line or in-line analysis. NIR spectroscopy was examined as a method for measuring total solids and protein in native unhomogenized cheese curd. A total of two hundred forty-two cheese curd samples were prepared in the laboratory for the study. Variation in total solids and protein was created by changing the intensity and duration of curd cutting as well as variation in scalding temperature and scalding time. After sample preparation and draining of the curd, NIR spectra were collected from 12000 cm-1 to 2000 cm-1 in diffuse reflectance mode. Thirty-two scans were averaged into one spectrum and collected at 8 cm-1 spectral resolution. Three individual spectra were collected in this manner on different portions of each sample. In order to compare the effect of homogenizing the samples, each sample was mixed together for one minute and the spectra collection process was repeated to create two different data sets. Standard reference methods were performed on the samples to obtain reference values for total solids and protein. Two sets of regression models were created for both total solids and protein using the NIR spectra and reference values.
Unhomogenized:
| Total Solids | R² = 0.994 | RMSEP= 0.502% |
| Protein | R² = 0.985 | RMSEP= 0.548% |
Homogenized:
| Total Solids | R² = 0.997 | RMSEP= 0.388% |
| Protein | R² = 0.992 | RMSEP= 0.381% |
While the results are slightly improved for the homogenized samples, the improvement is minimal and high correlation was obtained for both total solids and protein for both data sets. Predictions from a validation set proved the feasibility of the calibration models as a method for determining total solids and protein in cheese curd. Because of the minimal sample preparation, this study shows that NIR spectra and regression models could be used for industrial, real-time, on-line measurement of parameters of interest in cheese curd during the cheese manufacturing process.
https://onlinelibrary.wiley.com/doi/full/10.1111/j.1471-0307.2007.00347.x
Non-Destructive Determination of Components in Processed Cheese Slice Wrapped with a Polyethylene Film Using Near-Infrared Spectroscopy and Chemometrics – Pi, Shinzawa, Ozaki, Han, International Dairy Journal 19 (2009) 624-629
NIR spectroscopy was examined as a method for determining fat, protein, and sodium chloride in processed cheese slices that are wrapped in polyethylene (PE) film. Processed cheese is often covered in plastic wrapping to preserve quality and prolong shelf life. Fifty-one batches of processed cheese slices were obtained from commercial markets for the study. Each batch contained ten slices and all slices were wrapped in 25 µm thick PE film. NIR spectra of the wrapped samples were collected using an FT-NIR spectrometer in diffuse reflectance mode from 1000 nm to 2500 nm at 2 nm intervals. Thirty-two scans were averaged per spectrum. Three random points were chosen on each sample for this process and the three spectra for each sample were averaged into one spectrum as well. For comparative purposes, each sample was unwrapped from the PE film and this process was repeated. Reference values were obtained for fat, protein, and salt using traditional methods. A second derivative pre-processing was performed on both sets of spectra before chemometric modeling. Second derivative processing helps remove scattering due to non-homogenous distribution of particles, enhances peak separation, and can remove undesirable effects from baseline drift and slope. Forty-one spectra for each data set were used to build calibration models and the remaining ten spectra were used for a validation set.
With PE Film:
| Fat | R² = 0.984 | RMSEP= 0.625% |
| Protein | R² = 0.999 | RMSEP= 0.355% |
| Salt | R² = 0.991 | RMSEP= 0.105% |
Without PE Film:
| Fat | R² = 0.990 | RMSEP= 0.598% |
| Protein | R² = 0.998 | RMSEP= 0.308% |
| Salt | R² = 0.998 | RMSEP= 0.092% |
Visual comparison of the NIR spectra of the wrapped and unwrapped samples did show some contribution from the PE film in the wrapped samples, especially in the C-H vibrational absorbing areas of the NIR wavelength range. However, the effects of scattering were removed by the second derivative processing. Prediction values on the validation sets proved the feasibility of both models for measuring the parameters of interest. It must be noted that NaCl does not directly absorb in the NIR wavelength range. However, the high correlation indicates that the measurement is valid. Most likely, the salt has an effect on water molecules which is readily measurable using NIR spectra. Analysis of regression coefficients showing the relevant wavelength ranges for the calibration indicates this is the case. An indirect measurement of a component from NIR spectra is acceptable but must be carefully examined and validated. The results indicate that not only parameters in cheese can be measured when wrapped in PE film, but the potential exists for measuring other products wrapped in film as well by using NIR spectra with second derivative processing and reference values for the constituents of interest.
https://www.sciencedirect.com/science/article/abs/pii/S095869460900096X
Application of Near Infrared Spectroscopy to Estimate Selected Free Amino Acids and Soluble Nitrogen During Cheese Ripening – Mlcek, Rop, Dohnal, Sustova, ACTA VET. BRNO 2011, 80: 293-297
The composition of young cheese is a key to aging but the traditional main components are relatively stable during the aging process and thus not a good indicator of the course of ripening as cheese ages. Cheese acquires its typical taste, smell, consistency, and appearance over the course of aging due to fermentation processes. One important barometer for this process is the type and quantity of free amino acids, which influence taste and provide information about the state and progression of aging. NIR spectroscopy was examined as a method for determining soluble nitrogen and two important amino acids (tyrosine and tryptophan) in Edam cheese. Samples were obtained from two different dairy factories, each providing four different types of Edam cheese with different values for dry matter and different starter cultures. Three portions of each sample were used for a total of two hundred eighty-eight separate portions for the analysis. The samples were aged for six months and at monthly intervals, both NIR spectra and reference tests for the parameters of interest were obtained. NIR spectra were collected from 12500 cm-1 to 2000 cm-1 in reflectance mode. Eighty scans were averaged per spectrum and spectral resolution was 4 cm-1. For reference values, samples were prepared for UV spectrophotometric analysis and values were obtained by the traditional method for each parameter of interest. After all data was collected over six months, Partial Least Squares (PLS) regression models were created using the NIR spectra and reference values.
| Total Nitrogen | R² = 0.911 | RMSEP= 1.33% |
| Tryptophan | R² = 0.929 | RMSEP= 0.00292 mg/100g |
| Tyrosine | R² = 0.959 | RMSEP= 0.00705 mg/100g |
While the models did show good correlation, predictions obtained during cross-validation analysis showed very high variability, indicating that the models may not be suitable for real-time analysis. One possible reason for this is error in the UV reference method. It must be noted that the concentrations of tryptophan and tyrosine are below the threshold of measurement using NIR spectroscopy. Most likely, the models are correlating to another parameter which may or may not be affected by a change in the two amino acids. Before these models can be considered for real-time use, they must be further validated and carefully examined to determine the validity of the measurement. Despite this, the results offer promise for using NIR spectroscopy as a tool for estimating the degree of ripeness in Edam cheese as well as selecting a raw optimum material for making processed cheeses.
https://actavet.vfu.cz/media/pdf/avb_2011080030293.pdf
Application of FT-NIR and FT-IR Spectroscopy to Study the Shelf-Life of Crescenza Cheese – Catteneo, Giardina, Sinelli, et al., International Dairy Journal 15 (2005) 693-700
Crescenza cheese covers more than 40% of the Italian fresh cheese market and is produced only from whole cow milk. It is a fresh cheese and the components that are associated with its freshness are low acidity, limited proteolysis, and no bitter taste. Both FT-NIR and FT-IR spectroscopy were examined as methods for evaluating the shelf-life period for freshness in Crescenza cheese. Two different types of Crescenza made in the same industrial plant but using different technologies were procured for the study. The two types differed in their fat composition and starter components used during manufacturing. Samples were analyzed at different times over twenty days. FT-NIR spectra were collected from 12000 cm–1 to 4000 cm-1 averaging sixteen scans per spectrum at 16 cm-1 resolution. An optical probe was used to collect the spectra and measurements were collected in replicates varying from four to eight. FT-IR spectra were collected in duplicate for each sample from 4000 cm-1 to 600 cm-1 using an ATR crystal as a background. Sixteen scans were averaged per spectrum and 4 cm-1 spectral resolution was used. After spectra were collected, chemical and physiochemical analyses were performed to determine pH, Dry Matter (DM), Titratable Acidity (TA), and Hue (a color measurement) for each sample to determine thresholds for when sample quality has become poor. Based on this analysis, the samples were found to maintain freshness for six days, an significant decrease in freshness for the next few days, and an unacceptable freshness level for human consumption after eight to nine days. Various pre-treatments were performed on both the FT-NIR and FT-IR spectra and Principle Component Analysis (PCA) showed a clear grouping between these three thresholds. Samples could be clearly grouped from both sets of data into “Fresh”, “Aged”, and “Old” groups from the PCA scores plot. The results here indicate that both FT-NIR and FT-IR spectra can be used as a classification tool to determine the shelf-life of Crescenza cheese.
https://www.sciencedirect.com/science/article/abs/pii/S0958694604003115
Screening of Grated Cheese Authenticity by NIR Spectroscopy – Cevoli, Fabbri, Gori, et al., Journal of Agricultural Engineering 2013; volume XLIV(s2):e53
Parmigiano-Reggiano (PR) cheese is one of the oldest traditional cheeses produced in Europe and has a Protected Designation of Origin in Italy. It is manufactured exclusively from whole PR wheels that correspond to the production standard. Grated PR cheese must be matured for a period of twelve months and characterized by a rind content of less than 18%. NIR spectroscopy was examined as a method for determining the authenticity of PR grated cheese. Four hundred samples were procured for the study with the following classifications: Compliance PR, Non-Compliance PR, PR with Rind Content > 18%, and Competitors (various commercial brands of grated cheeses obtained from local markets). NIR spectra were collected using an FT-NIR spectrometer in diffuse reflectance mode from 12500 cm-1 to 4000 cm-1. Thirty-two scans were averaged per spectrum and 8 cm-1 spectral resolution was used. Three replicate spectra were collected per sample. Various pre-processing treatments were performed on the NIR spectra. Principle Component Analysis (PCA) was first performed as an exploratory tool to define discrimination between Compliance and Non-Compliance PR samples or Competitors. Artificial Neural Network (ANN) models were created using software to test the feasibility of predicting each specific class from the spectral data. Reference values of Rind % and Months of Ripening were used with the NIR spectra to create Partial Least Squares (PLS) regression models for predicting these values from the spectra.
ANN:
| Compliance PR Classification | 100% for Training Set | 100% for Validation Set |
| Competitors Classification | 100% for Training Set | 95.5% for Validation Set |
| Non-Compliance PR Classification | 100% for Training Set | 100% for Validation Set |
| Rind Content > 18% Classification | 100% for Training Set | 100% for Validation Set |
PLS:
| Rind % | R² = 0.982 | RMSEP= 1.473% |
| Months of Ripening | R² = 0.986 | RMSEP= 0.805 |
 The results obtained in this study for both types of models were excellent and confirmed the ability of NIR spectroscopy to be used as a screening tool for determining grated cheese authenticity. The ANN model was able to 100% predict compliance or non-compliance in PR samples and detect competitor grated cheese at with an accuracy at above 95%. More competitor samples in the model will likely improve these results. In the case of PLS, the results were especially good considering there was some question in the reference values for rind %. A regression model can only predict within the error of the reference method and these results should improve as well with more accurate reference testing. Ripening can be predicted to within an accuracy of less than one month. NIR spectroscopy can be used as a fast, non-destructive screening tool for determining the authenticity of grated cheese.
The post Cheese Analysis appeared first on NIR-For-Food.
]]>The post Milk Analysis appeared first on NIR-For-Food.
]]>Introduction
Milk is the material for all dairy based products and in addition to liquid milk and cream, it is the raw material for butter, cheese, casein, ice cream, lactose, and yogurt. It is estimated that about 37% of all milk produced in the United States is consumed as fluid milk and cream, while the remainder is further processed into other products. The average composition of cow’s milk is 87.2% water, 3.7% milk fat, 3.5% protein, 4.9% lactose, and 0.7% ash. While technological advances have increased the yield from milk producing animals as well as helped maintain quality and efficiency during transport, there is still a need to develop rapid, non-invasive, cost-effective, and environmentally sound methods for quality testing of milk during manufacturing. In addition to manufacturing optimization, frequent feedback of milk parameters can provide valuable information that can benefit herd management. Fat, protein, lactose, urea, and somatic cell content (SCC – an indication of the likelihood that the milk does not contain harmful bacteria) values are typically collected once or twice a month and used for estimation of breeding values. More frequent collection could provide significant benefits for dieting and herd management. One potential benefit is getting information about the physical structure and crude fiber in the ration having a direct effect on fat in the milk. Another is protein and urea contents helping develop conclusions about the balance of energy feed supply and protein concentration in the diet. Other parameters of interest in milk include total solids, non-fatty solids contents, freezing point, and acidity measurements such as titratable acidity (TA) and pH. Adulteration is a big issue in the food and beverage industry and milk products are no exception. There are strict regulations on the labelling and grading of milk based on numerous factors such as fat content, conditions of manufacturing, and other processes like pasteurization, homogenization, and vitamin fortification. Misrepresenting milk as labelled is one form of adulteration. Another form of adulteration is adding a portion of a cheaper product to a more expensive and higher quality product. Such adulteration can not only reduce the nutritional value of a product, it can also cause health risks. This can occur in all dairy products, including milk and milk powder. Current methods for testing these parameters are expensive, laborious, and time-consuming, especially when implemented in a process setting. There is a need for fast, cost-effective, and real-time monitoring of parameters at all stages of the milk manufacturing and transport processes. One such method that has been examined is NIR spectroscopy.
Analytes
- Fat
- Protein
- Lactose
- Urea
- Somatic Cell Count (SCC)
- Total Solids
- Non-Fatty Solids Contents
- Freezing Point
- Titratable Acidity (TA)
- pH
- Camel Milk Adulteration
- Milk Powder Adulteration
Summary of Published Papers, Articles, and Reference Materials
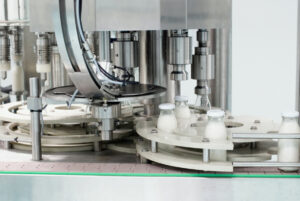
Measurement of chemical parameters in major constituents of milk for quality control purposes has been studied using NIR spectroscopy. The results of most studies have been promising. One study performed in-line measurements during the milking process to determine the feasibility of using NIR spectroscopy for various parameters in milk: fat, protein, lactose, urea, and somatic cell count (SCC). SCC results were considered good enough for screening purposes while all other parameters showed results that can be used for real-time measurement during the milking process. Fat content is considered the most important parameter in milk and currently, two separate reference methods are used for determining fat in milk: Rose-Gottlieb and Gerber, both of which use toxic chemicals, require highly trained technicians, and are inadequate for real-time measurement. NIR spectroscopy was used to create calibration models for fat with both these methods performed to determine reference values. Results were excellent using both methods. Goat milk samples were used with an FT-NIR instrument to measure different parameters of interest: fat, protein, lactose, total solids, non-fatty solids contents, freezing point, titratable acidity (TA), and pH. Results were validated and proved good enough for real-time measurement for all parameters except freezing point, TA, and pH. However, the range of values for these three parameters was very small but the results were still good enough for screening purposes. Adulteration in both milk and milk powder is considered a big problem in the dairy industry and two separate studies used NIR spectroscopy for adulterant determination. The first used camel milk samples adulterated with cow milk, which is a much cheaper product. Results showed that the presence of cow milk adulterant in camel milk could be determined as well as quantified using NIR spectra and calibration models. The second study used different samples of pure milk powder and various adulterants to determine the feasibility of finding the presence of an adulterant in milk powder. Three different spectrometers were used for this study: Two FT-NIR benchtop instruments and a handheld NIR instrument. Results were excellent for the two FT-NIR instruments but much worse for the handheld NIR instrument, most likely due to a shorter wavelength range and lower spectral resolution for the handheld instrument.
Scientific References and Statistics
Accuracy of In-Line Milk Composition Analysis with Diffuse Reflectance Near-Infrared Spectroscopy – Melfsen, Hartung, Haeusserman, Journal of Dairy Science 95: 6465-6476
Daily monitoring of composition changes in milk can assist in monitoring cow health and be used for detection of nutritional imbalances. The composition of milk can be affected by a large number of factors, such as breed, nutrition, seasonality, lactation, and health. NIR spectroscopy was examined for in-line measurement of the fat, protein, lactose, urea, and somatic cell count (SCC) in milk during the milking process. Eighty-four composite milkings were used for the study and a total of seven hundred eighty-five partial milkings from the composites were scanned with an NIR spectrometer using diffuse reflectance. NIR spectra were collected every 500 ms from 851 nm to 1649 nm during the milking process. A measuring cell was used and the layer thickness of the milk was 30 mm. After 2 kg of milk was collected, the spectra collected during each 2 kg were averaged into one single spectrum. A bypassed portion of each milk sample was sent to the laboratory and reference values were obtained for the parameters of interest. Partial Least Squares (PLS) regression models were created correlating the NIR spectra to fat, protein, lactose, urea, and SCC.
| Fat | R² = 0.998 | RMSEP= 0.09% |
| Protein | R² = 0.99 | RMSEP= 0.04% |
| Lactose | R² = 0.96 | RMSEP= 0.05% |
| Urea | R² = 0.89 | RMSEP= 15.24 mg/L |
| SCC (Log) | R² = 0.90 | RMSEP= 0.15 |
The results obtained in this study confirmed the feasibility of the calibration models used to measure the parameters of interest. Fat, protein, and lactose all showed high correlation and a low SEP. The results for these three calibration models are good enough for real-time on-line monitoring of milk using the procedure documented in this study. Results for urea were not as good but still good enough to be considered suitable for screening purposes. It must be noted that the concentration of urea measured here is extremely small. The likelihood of a direct measurement of a parameter on the order of ppm using NIR spectroscopy is very low. The calibration model is most likely correlating to another parameter which may or may not be affected by a change in the urea concentration. While an indirect correlation is acceptable when using NIR spectroscopy, such calibrations must be examined and validated carefully to prove the model is valid. More work will be required to use this model in a real-time setting. In the case of SCC, previous studies have indicated that SCC is a difficult parameter to measure using NIR spectroscopy because the parameter is not defined from explicit chemical bonds. Most likely, other constituents are changing and the SCC calibration is at least partially using these changes for model correlation. An examination of predicted values for SCC using the NIR calibration model and reference values indicates that a successful classification could be performed for various ranges of SCC values from NIR spectra. Overall, the results in this study prove the feasibility of monitoring fat, protein, and lactose in milk in an in-line setting using NIR spectroscopy and calibration models. The potential for measuring urea and SCC was demonstrated as well, but further work will be necessary to implement these calibrations in an in-line environment.
https://www.sciencedirect.com/science/article/pii/S0022030212006509
Accuracy of the FT-NIR Method in Evaluating the Fat Content of Milk Using Calibration Models Developed for the Reference Methods According to Rose-Gottlieb and Gerber – Mlcek, Dvorak, Sustova, Szwedziak, Journal of AOAC International Volume 99, No. 5, 2016
FT-NIR spectroscopy was examined as a method for comparative purposes using two separate reference methods for the fat content in cow milk to build the calibration models: Rose-Gottlieb and Gerber. The Rose-Gottlieb method treats samples with ammonia to dissolve protein and ethyl alcohol to help precipitate proteins. Fat is then extracted with diethyl ether and petroleum ether. After the ethers are evaporated, the residues are weighed. The Gerber method adds sulfuric acid to separate proteins. The separation is facilitated by using amyl alcohol and centrifugation. Fat content is read using a specialized butyrometer. Thirty individual cow milk samples were procured for the study. Samples were scanned in reflectance mode using a transflectance cuvette with a 0.2 mm pathlength. Spectral range was from 10000 cm-1 to 4000 cm-1 with a spectral resolution of 8 cm-1 and 100 scans averaged per spectrum. Both reference methods were performed in separate independent laboratories to determine fat content for each sample. Two Partial Least Squares (PLS) regression models for fat were created using both sets of reference data and the NIR spectra.
Rose-Gottlieb:
| Fat | R² = 0.993 | RMSEP= 0.133% |
Gerber:
| Fat | R² = 0.996 | RMSEP= 0.095% |
|---|
The results show that both calibration models work very well and the values obtained from both models differ in fat content values by parts per hundred. There were lower deviations observed in the Rose-Gottlieb models but there was no statistically significant difference between the two data sets. Fat is one of the most valuable components of milk and current analytical methods depend on acids and solvents as well as chemical equipment and trained technicians. NIR spectroscopy offers a fast, non-destructive technique for the measurement of fat in milk samples without the use of toxic chemicals.
https://www.ncbi.nlm.nih.gov/pubmed/27324807
Analysis of Goat Milk by Near-Infrared Spectroscopy – Drackova, Hadra, Janstova, et al., Acta Vet. Brno 2008, 77: 415-422
FT-NIR spectroscopy was examined as a method for determining various parameters of interest in goat milk. The parameters measured in this study are protein, fat, lactose, total solids, non-fatty solids contents, freezing point, titratable acidity (TA), and pH. Sixty samples of goat milk each taken from separate bulk tanks were procured for the study. Samples were scanned from 10000 cm-1 to 4000 cm-1 in reflectance mode using a transflectance cell with 0.1 mm pathlength. One hundred scans were collected per reading and averaged into a single spectrum. Traditional reference values for the parameters of interest according to standards were obtained for each sample. The reference values and NIR spectra were used to create Partial Least Squares (PLS) calibration models correlating the NIR spectra to each parameter.
| Protein | R² = 0.92 | RMSEP= 0.094% |
| Fat | R² = 0.951 | RMSEP= 0.124% |
| Lactose | R² = 0.997 | RMSEP= 0.011% |
| Total Solids | R² = 0.940 | RMSEP= 0.260% |
| Non-Fatty Solids Contents | R² = 0.873 | RMSEP= 0.159% |
| Freezing Point | R² = 0.935 | RMSEP= 0.003°C |
| Titratable Acidity | R² = 0.952 | RMSEP= 0.295 SH (Soxhlet Henkel) |
| pH | R² = 0.835 | RMSEP= 0.057 |
All calibration models showed good results and were tested using cross-validation to determine prediction error for each parameter. The models for protein, fat, lactose, total solids, and non-fatty solid contents showed good enough results for real-time measurement of these parameters using the calibration models. In the case of freezing point, titratable acidity (TA), and pH, the models were less robust and prediction results can only be considered good enough to use the models for screening purposes. However, this most likely occurred because of the very small range of values: less than 0.03°C for freezing point, less than 4 SH for TA, and less than 0.5 for pH. More samples and a larger range of values should improve the results. Overall, the results here proved the feasibility of measuring these parameters using NIR spectra and calibration models.
https://pdfs.semanticscholar.org/548d/0627b4b9de94abceac0e9e80cb8045b436f3.pdf
FT-NIRS Coupled With Chemometric Methods As A Rapid Alternative Tool for the Detection & Quantification of Cow Milk Adulteration in Camel Milk Samples – Mabood, Jabeen, Hussain, et al., Vibrational Spectroscopy 92 (2017) 245-250
Camel milk is considered to have high nutritional value in comparison to milk produced by cows. It is a rich source of Vitamin A and C, has a high content of potent immunoglobins, and does not contain lactoglobulin and A1 casein, making it suitable for consumption by people with bovine dairy allergies. Thus, it sells for a higher market price and is subject to adulteration using cheaper forms of milk. FT-NIR spectroscopy was examined as a method for determining cow milk adulteration in samples of camel milk. Three samples of camel milk were procured for the study and prepared in triplicate form. Each separate camel milk sample was adulterated with different percent levels of cow milk adulterant: 2%, 5%, 10%, 15%, and 20%. Including the three pure samples, a total of fifty-four samples were created. 70% of the samples were used as a calibration set to create the model and the remaining 30% was used as a validation set. All samples were scanned from 700 nm to 2500 nm at 2 cm-1 spectral resolution using a 0.2 mm pathlength sealed cell. Two calibration models were created: Partial Least Squares Discriminant Analysis (PLS-DA) to determine the presence of the cow milk adulterant and Partial Least Squares (PLS) to quantify the amount of adulterant present.
PLS-DA
| Presence of Adulterant | R² = 0.973 | RMSEP= 0.0801 |
PLS
| Amount of Adulterant | R² = 0.926 | RMSEP= 1.32% |
Both calibration models showed good results and proved the feasibility of the measurement. In the case of PLS-DA, an arbitrary value of 0 was assigned to the pure camel milk samples and 1 to samples spiked with 10% cow milk adulterant. The model predicts a number and a threshold of 0.5 was chosen to determine the presence of adulterant. A predicted value less than 0.5 indicates no adulterant and a predicted value greater than 0.5 indicates an adulterant is present in the sample. The high correlation and low RMSEP show that this model can be used to determine the presence of cow milk adulterant in camel milk. In the case of PLS, the results show that the model can predict the amount of adulterant present within an accuracy of 1.32%. It must be noted that while the models showed good results, using them in a practical setting for different kinds of milk and adulterants would require a much larger sample set. Natural products often show variability in NIR spectra due to many factors, such as region of origin, different types of food fed to animals, different soil for plant growing, and so forth. Incorporating different samples encompassing any potential variability is important when building calibration models. Predictions performed on the validation set proved that the models could work in a real-time setting, using the PLS-DA model as a detection tool and the PLS model as a quantification tool, providing information that would be very difficult to find using conventional methods for adulteration detection.
https://www.sciencedirect.com/science/article/abs/pii/S0924203117300668
Non-Targeted NIR Spectroscopy and SIMCA Classification for Commercial Milk Powder Authentication: A Study Using Eleven Potential Adulterants – Karunathilaka, Yakes, He, et al., Heliyon 4 (2018) e00806.
NIR spectroscopy was evaluated as a method for rapid screening of commercial milk powder products as authentic or being mixed with known and unknown adulterants. Milk powder is a known target of adulteration, ranking only second to olive oil according to the USP database on food fraud and economic adulteration. Milk powder adulteration can cause adverse health effects, as highlighted by two incidents of milk and wheat gluten adulteration with melamine. One incident was linked to renal failure in cats and dogs due to pet food adulteration in the United States. The other was linked to infant formula in China, causing thousands of cases of renal complications in children as well as at least six confirmed deaths. A number of commercially available milk powder samples were procured for the study, representing manufacturing in sixteen different states and twenty-four different companies and brands. Eleven different milk powder adulterants were selected for the study based on their history or potential use as adulterants. These can be divided into 4 categories: 1. Low Molecular Weight, Nitrogen-Rich Compounds, 2. Plant Proteins, 3. Inorganic Salts, 4. Non-Fat Solids. Some of the adulterants were blended as well to increase the scope of the potential adulterants that could be used. Different levels of all adulterants were mixed with the pure milk powder samples before NIR spectra were collected. Three different spectrometers were used for the study: Two benchtop FT-NIR instruments and a handheld NIR device. Principle Component Analysis (PCA) was performed on all three sets of data and SIMCA classification models were created for determining the presence of an adulterant in the milk powder. After model creation, separate test sets of both pure and adulterated samples were scanned for model validation.
FT-NIR Spectrometer #1
Instrument Parameters:
| 12500 cm-1 to 4000 cm-1 | 64 scans per average | 16 cm-1 spectral resolution |
100% Correct Adulterant Classification and Concentration (%w):
| Melamine | 0.6% to 2.0% |
| Dicyandiamide | 2% |
| Aminotriazole | 0.4% to 2.0% |
| Biuret | 0.2% to 2.0% |
| Soy Protein Isolate | 5% to 20% |
| Pea Protein Isolate | 5% to 20% |
| Calcium Carbonate | 2% |
| Maltodextrin | 2% to 20% |
| Sucrose | 7% to 50% |
FT-NIR Spectrometer #2
Instrument Parameters:
| 10000 cm-1 to 4000 cm-1 | 32 scans per average | 16 cm-1 spectral resolution |
100% Correct Adulterant Classification and Concentration (%w):
| Melamine | 0.4% to 2.0% |
| Aminotriazole | 0.4% to 2.0% |
| Biuret | 0.2% to 2.0% |
| Cyanuric Acid | 2% |
| Soy Protein Isolate | 5% to 20% |
| Pea Protein Isolate | 2% to 20% |
| Maltodextrin | 5% to 20% |
| Sucrose | 10% to 50% |
Handheld Spectrometer
Instrument Parameters:
| 6266 cm-1 to 4167 cm-1 | 10 scans per average | 11 nm optical resolution |
100% Correct Adulterant Classification and Concentration (%w):
| Biuret | 0.4% to 2.0% |
 Results for all three spectrometers are shown above. Both FT-NIR benchtop spectrometers showed 100% specificity and accuracy for determining the presence of an adulterant in milk powder if the adulterant was at a sufficiently high percentage, which varied based on the type of adulterant present. In the case of the handheld NIR device, results were much worse. This is most likely due to a narrower wavelength range and lower resolution than the benchtop FT-NIR instruments. The results here prove the feasibility of using FT-NIR spectrometers as a tool for determining the presence of adulterant in milk powder and show that FT-NIR spectrometers are much better suited for such analysis than handheld NIR spectrometers.
The post Milk Analysis appeared first on NIR-For-Food.
]]>The post Yogurt Analysis appeared first on NIR-For-Food.
]]>Introduction
Yogurt is a dairy product produced by bacterial fermentation of milk by the cultures Lactobacillus bulgaricus and Streptococcus thermophilus. Lactose in the milk is fermented to produce lactic acid, which acts on milk protein to give yogurt its texture and tart flavor. Milk is adjusted to optimize fat and solids content, pasteurized and homogenized, cooled, fermented, and cooled again once fermentation has brought the lactic acid to the desired level. Stabilizers, flavors, and fruit may be added at various points during the process. The worldwide industrial production of yogurt and fermented milks reached about 35 million tons in 2012. The market in North America is expected to have a 3.0% CAGR by 2024, with a value increase from $11.2 billion in 2015 to $14.6 billion in 2024. Factors driving market growth include consumer awareness of dairy products as having health benefits, probiotics content being a known factor in stomach health, niche products and a variety of choices in flavors, textures, and fruit content, and attractive packaging which especially helps the yogurt market for kids. Proper quality control at all stages of the yogurt manufacturing process is essential for a good finished product. Parameters of interest include microbial quality, degree of pasteurization, sugar, and acidity. Microbial quality is determined by a dye reaction test and a count that is too high makes the milk unsuitable for manufacturing.
Degree of pasteurization is measured by an enzyme known as phosphatase and performing this test is required before fermentation may proceed. In the case of sugar and acidity, both are essential guidelines of taste in the finished product, which can have different desired levels based on the type of yogurt produced. As is the case with many food and dairy products, adulteration is a major issue and different types of non-milk protein adulteration have been reported to be found in yogurt.
While no alternative methods currently exist for testing microbial quality and degree of pasteurization, sugar, acidity, and protein measurements are all known parameters that can be measured using NIR spectroscopy. Current methods for testing these parameters of interest in yogurt are expensive, laborious, and time-consuming, especially when implemented in a process setting. In-line monitoring is impractical and sometimes impossible. There is a need for fast, cost-effective, and real-time monitoring of parameters at all stages of the yogurt manufacturing process. One such method that has been examined is NIR spectroscopy.
Analytes
- Sugar (°Brix)
- Acidity (pH)
- Non-Milk Protein Adulteration
Summary of Published Papers, Articles, and Reference Materials
Measurement of chemical parameters in major constituents of yogurt for quality control purposes has been studied using NIR spectroscopy. The results of most studies have been promising. Two separate but similar studies examined measuring sugar and acidity content in yogurt samples purchased from a commercial market. Results were good and should improve with a larger sample set with more varieties of yogurt, especially yogurts that extend the range of values for the parameters of interest. Another study examined protein adulteration in yogurt, a problem that has been reported in publications. Samples of yogurt were adulterated with three different types of non-milk proteins: edible gelatin, industrial gelatin, and soy protein powder. Results were good and determined that the spectroscopic method could determine the presence of 1% edible gelatin, 2% industrial gelatin, and 2% soy protein powder or higher concentrations. The potential of NIR spectroscopy as an untargeted detection tool for determining the presence of non-milk protein adulterants in yogurt was demonstrated.
Scientific References and Statistics
Fast Measurement of Sugar Content of Yogurt Using VIS/NIR Spectroscopy – He, Wu, Feng, Li, International Journal of Food Properties, 10: 1-7, 2007
Many different brands of yogurt are manufactured and one of the most important quality parameters is the sugar content. During the fermentation process, lactose in milk ferments to produce lactic acid, which acts on milk protein to give yogurt its texture and characteristic tart flavor. Sugar is a main guideline of taste in yogurt. Current reference methods for determining sugar content in yogurt are time-consuming and expensive as well as being impractical for real-time measurement. NIR spectroscopy was examined as a method for determining the sugar content in yogurt. Five different brands of yogurt were procured from a local market for the study. They were stored in a refrigerator after purchase before being used in the study. Thirty-two samples of each brand of yogurt were used for a total of one hundred sixty samples. Samples were scanned in reflectance mode from 350 nm to 1075 nm at 1.5 nm intervals using a sensitivity of 3.5 nm. Thirty scans were collected per measurement and averaged into one spectrum. Immediately after each NIR spectrum was collected, the sample was measured using a sugar content meter for °Brix. The NIR spectra were pre-processed using a smoothing function to reduce noise and after smoothing, it was determined that the best wavelength range to use for chemometric modeling was 400 nm to 1000 nm. The reference values for sugar and NIR spectra were used to create a Partial Least Squares (PLS) regression model correlating the spectra to the sugar content.
| Sugar | R2= 0.934 | RMSEP=0.389 °Brix |
The PLS model for sugar showed excellent results and a high correlation coefficient. In order to verify the validity of the model, twenty-five samples were removed from the calibration and a new model was created without those samples. The NIR spectra from the removed samples were then used with the model to perform independent predictions, which showed error low enough to use the calibration in a real-time setting. The sample-set was limited and since yogurt can get manufactured using many different flavors and textures, more types of samples would be needed to use the model on a universal basis.
https://www.tandfonline.com/doi/pdf/10.1080/10942910600575658
Measurement of Yogurt Internal Quality Through Using Vis/NIR Spectroscopy – Shao, He, Feng, Food Research International 40 (2007) 835-841
Sugar and acidity are two important quality parameters in yogurt and must be tested as the target contents of both vary in different types of yogurt. Current reference methods for determining sugar and acidity content in yogurt are time-consuming and expensive, as well as being impractical for real-time measurement. NIR spectroscopy was examined as a method for determining the sugar and acidity content in yogurt. Five different brands of yogurt were procured from a local market for the study. They were stored in a refrigerator after purchase before being used in the study. Thirty-two samples of each brand of yogurt were used for a total of one-hundred sixty samples. Samples were scanned in reflectance mode from 350 nm to 1075 nm at 1.5 nm intervals. Thirty-two scans were collected per measurement and averaged into one spectrum. Immediately after each NIR spectrum was collected, the sample was measured using a sugar content meter for °Brix and a pH meter for acidity. The NIR spectra were first pre-processed using a smoothing function to reduce noise and after smoothing, it was determined that the best wavelength range to use for chemometric modeling was 400 nm to 1000 nm. Other processes were applied to the data for model optimization. The reference values for sugar and acidity were used with the NIR spectra to create Partial Least Squares (PLS) regression models correlating the spectra to the sugar content.
| Sugar | R2= 0.92 | RMSEP= 0.36 °Brix |
| Acidity | R2= 0.91 | RMSEP= 0.04 pH |
The PLS models for sugar and acidity showed excellent results and high correlation coefficients. In order to verify the validity of the models, thirty-five unknown samples were scanned and the NIR spectra were used with the model to perform independent predictions, which showed error low enough to use the calibrations in a real-time setting. The sample set was limited and since yogurt can be manufactured using many different flavors and textures, more types of samples would be needed to use the models on a universal basis.
https://www.sciencedirect.com/science/article/pii/S0963996907000294
The Feasibility of Using Near-Infrared Spectroscopy and Chemometrics for Untargeted Detection of Protein Adulteration in Yogurt: Removing Unwanted Variations in Pure Yogurt – Xu, Yan, Cai, et al., Journal of Analytical Methods in Chemistry, Volume 2013, Article ID 201873
In recent years, scandals involving dairy product adulteration have led to the development of new targeted analytical methods to detect the presence of adulterants. Melamine has especially been examined as a milk adulterant but new types of adulterants are being reported all the time. One such adulterant is different types of non-milk proteins in yogurt. Because of the ever-evolving nature of adulterants, new types of untargeted analyses are needed to determine whether or not a product is pure and unadulterated, with the focus being on not necessarily identifying the specific adulterant but rather determining the presence of one. If a product is determined to be impure, further testing can be done to identify the adulterant. NIR spectroscopy was examined as a method for protein adulteration identification in yogurt. Yogurt was manufactured from milk and bacteria cultures using the standard method specifically for the study. The yogurt was divided into nineteen portions. Three portions were kept pure with no adulterant. Six portions were adulterated with edible gelatin ranging from 1% to 8% by weight. Five portions were adulterated with industrial gelatin ranging from 0.5% to 5% by weight. Five portions were adulterated with soy protein powder ranging from 0.5% to 5% by weight. In order to keep the thickness uniform in all the samples, pure water was added which is the common practice in protein adulteration. NIR spectra of both the pure and adulterated samples were collected from 12000 cm-1 to 4000 cm-1 in diffuse reflectance mode. Spectral resolution was 8 cm-1, scanning interval was 3.857 cm-1, and sixty-four scans were collected per reading and averaged into one spectrum. In total after dividing the portions, sixty spectra of pure samples and one hundred ninety-seven spectra of adulterated samples were collected. Spectrum of pure water was collected by averaging five measurements of water film on the reflectance background. In order to remove the influence of water variation, all NIR spectra of the pure and adulterated yogurt samples were orthogonally projected (OP) on the complement space of water spectrum using an algorithm, minimizing the influence of the water difference on the classification. Standard Normal Variate (SNV) processing was used as well to reduce scattering effects and correct interference caused by variations. The groups were divided into a training set and test set and the OCPLS class modeling algorithm was used to classify samples using the following sets of NIR spectra: raw spectra, OP, and SNV.
| OCPLS Classification: | |
| Raw Spectra Test Set | 17/20 |
| Raw Spectra Training Set | 163/197 |
| SNV Spectra Test Set | 18/20 |
| SNV Spectra Training Set | 181/197 |
| OP Spectra Test Set | 18/20 |
| OP Spectra Training Set | 187/197 |
The results showed that both pre-processing methods had a positive effect on the models, with the OP spectra classification showing slightly better results than the SNV spectra classification. Because water has such a strong absorbance in the NIR wavelength range, it is possible that without pre-processing, the results for the raw spectra and SNV may be classifying based on the differences in water and not the presence of an adulterant. Careful analysis of the wavelength ranges used to determine the classification will show this, but such analysis was not performed in this study. One purpose of analyzing the classification in this manner was to determine the minimum threshold for each adulterant that could be detected from the NIR spectra. None of the non-adulterated samples were incorrectly classified as having an adulterant present. For the samples that were incorrectly classified as being pure while having an adulterant present, the concentration was 0.5% for edible gelatin, 1% for industrial gelatin, and 1% for soy protein powder. All samples with an adulterant concentration of 1% edible gelatin, 2% industrial gelatin, and 2% soy protein powder (or higher) were correctly classified. These can be considered the safe thresholds of detection that the models can accurately use to detect protein adulteration in yogurt. The potential was demonstrated to use NIR spectroscopy as a method for protein adulteration in screening of yogurt and further work with a larger sample set at lower concentrations of protein should improve the results.
https://www.ncbi.nlm.nih.gov/pmc/articles/PMC3697415/
Commercial Reference
The post Yogurt Analysis appeared first on NIR-For-Food.
]]>The post Yogurt Overview appeared first on NIR-For-Food.
]]>Yogurt is a fermented milk product that contains the characteristic bacterial cultures Lactobacillus bulgaricus and Streptococcus thermophilus. It was accidentally invented in an early form thousands of years ago from curded goat and sheep milk. By definition, yogurt must contain at least 8.25% solids that are not fat. Full fat yogurt must contain no less than 3.25% milk fat, low-fat yogurt no more than 2% milk fat, and nonfat yogurt must contain less than 0.5% milk. Although yogurt has been around for many years, it has only become popular within the last thirty to forty years. Factors which have contributed to the popularity of yogurt include the introduction of fruit flavors, convenience as a quick and ready-made breakfast food, and marketing as a low-fat and healthy food, especially when compared to other dairy products like ice cream. The surge in yogurt popularity has led to the introduction of many types of yogurt. Traditional yogurt is thick and creamy. Flavored yogurt is typically flavored with fruit, but other flavors have been introduced as well, such as vanilla and chocolate. Yogurt is marketed by different fat levels, with low-fat being the most popular. Creamy yogurt is extra thick and made with whole milk and cream. Bioyogurt uses a different fermentation culture and is supposed to aid digestion. Organic yogurt is made from milk from specially fed cows.
Yogurt usually has a tart flavor because of lactose fermentation and milk is the main ingredient, making it rich in nutrients like protein, vitamins, and calcium. Other dairy ingredients allowed in yogurt include cream to adjust fat content and nonfat dry milk to adjust the solids content, which is typically adjusted above the minimum 8.25% to provide better body and texture. Stabilizers are often used as well to increase firmness, prevent separation of the whey, and to keep the fruit uniformly mixed in the yogurt. These include alginates, gelatins, gums, pectins, and starch. Sweeteners (both natural and artificial), flavors, and fruit preparations can be added as well to make different varieties. All additional ingredients are regulated. Fruit can be added at different points in the manufacturing process. It can be added to the bottom of containers before the finished yogurt is put in them (known as Fruit-On-The-Bottom). It can also be added as a puree to bulk yogurt during fermentation but must also be pasteurized like the milk before fermentation. In some yogurts, the fruit is added in a small separate package to be mixed in the yogurt before consumption.
Yogurt Manufacturing
The first step in yogurt manufacturing is to modify the milk so it is suitable for making yogurt. This typically involves reducing the fat and increasing the total solids. Fat content is reduced using a clarifier and separator that uses centrifugation to separate fat from the milk. The milk is tested for fat and solids content and solid concentration is increased by either evaporating water or adding concentrated milk or milk powder. The typical total solids content of the milk is 16%, with fat from 1 to 5% and the remaining portion being non-fat solids. After the optimal solids content is reached, any stabilizers are added, and the milk is pasteurized. Pasteurization is used to denature whey proteins, forming a more stable gel which prevents separation of water during storage. It also destroys unwanted microorganisms that interfere with fermentation and releases compounds that help stimulate the growth of the starter cultures. The process can be batch or continuous and the exact parameters can vary, but typically involves heating the milk to around 185°F for at least thirty minutes. Homogenization occurs simultaneously with pasteurization and breaks up fat globules to a more uniform dispersion of particles. The milk is forced through small openings at high pressure (2000 to 2500 psi) to break up the fat globules. This makes a smoother, creamier, and more uniform end product that reduces separation to a minimum.
The first step in yogurt manufacturing is to modify the milk so it is suitable for making yogurt. This typically involves reducing the fat and increasing the total solids. Fat content is reduced using a clarifier and separator that uses centrifugation to separate fat from the milk. The milk is tested for fat and solids content and solid concentration is increased by either evaporating water or adding concentrated milk or milk powder. The typical total solids content of the milk is 16%, with fat from 1 to 5% and the remaining portion being non-fat solids. After the optimal solids content is reached, any stabilizers are added, and the milk is pasteurized. Pasteurization is used to denature whey proteins, forming a more stable gel which prevents separation of water during storage. It also destroys unwanted microorganisms that interfere with fermentation and releases compounds that help stimulate the growth of the starter cultures. The process can be batch or continuous and the exact parameters can vary, but typically involves heating the milk to around 185°F for at least thirty minutes. Homogenization occurs simultaneously with pasteurization and breaks up fat globules to a more uniform dispersion of particles. The milk is forced through small openings at high pressure (2000 to 2500 psi) to break up the fat globules. This makes a smoother, creamier, and more uniform end product that reduces separation to a minimum.
After pasteurization and homogenization are complete, the milk is cooled to around 110°F before adding the starter culture to begin fermentation. If the milk is not adequately cooled, the cultures will be inactivated when added to the milk. Incubation can occur either in bulk or in the individual containers the yogurt is sold in. Stirred yogurt is fermented in bulk and then poured into containers. Set yogurt ferments in the containers. The concentration of fermentation culture added is around 2%. Milk is held at a consistent temperature for three to four hours during the incubation process. As fermentation of the lactose takes place, the bacteria metabolize compounds in the milk that form a soft gel and the characteristic flavor of yogurt. One important byproduct is lactic acid, which is measured to determine when the yogurt is ready. The standard method for determining acidity is titration with sodium hydroxide, which is time-consuming and requires sample preparation. Regulations in the United States require yogurt to have at least 0.9% acidity and a pH around 4.4-4.5. Once the acidity and pH reach the desired level, the yogurt is cooled to around 45°F to stop fermentation. The finished containers of yogurt are then shipped to stores in refrigerated trucks.
Conclusion
As with any dairy product, yogurt is subject to many safety tests. Some include microbial quality, a degree of pasteurization, and the presence of contaminants, such as antibiotics, pesticides, and radionuclides. Microbial quality is determined by a dye reaction test and a count that is too high makes the milk unsuitable for manufacturing. The degree of pasteurization is measured by an enzyme known as phosphatase and performing this test is required before fermentation may proceed. The final yogurt products undergo many safety and quality tests as well, such as pH, rheology, taste, color, and odor. NIR spectroscopy has emerged as a tool for rapid, non-invasive, and cost-effective analysis of parameters of interest in yogurt that could potentially replace traditional reference methods. The two main parameters for flavor in yogurt are sugar and pH. Traditional methods for measuring these are time-consuming, can require the use of wet chemistry, and alternative methods may not be suitable for on-line measurements. Two separate studies used NIR spectroscopy to measure both sugar and pH using chemometric models correlating the spectra to sugar and acidity. Both studies showed good results and excellent predictive performance from the models. Adulteration is a major problem in the food and dairy industries and yogurt is no exception. One study examined the feasibility of determining the presence of three well-known non-milk protein adulterants in yogurt using various pre-processing techniques and data classification methods on NIR spectra. Results proved that adulteration of yogurt by edible gelatin, industrial gelatin, and soy protein can all be detected using NIR spectra and classification methods. All of these parameters and measurements have been studied using NIR spectroscopy with results showing the potential to replace traditional reference methods.
Scientific Reference
Milk Facts: Yogurt Production
http://www.milkfacts.info/Milk%20Processing/Yogurt%20Production.htm
How Products Are Made: Yogurt
http://www.madehow.com/Volume-4/Yogurt.html
Yogurt: The Product and Its Manufacture
Corrieu G., and Beal C., (2016) Yogurt: The Product and Its Manufacture. In: Caballero, B., Finglas, P., and Toldra, F. (eds.) The Encyclopedia of Food and Health vol. 5, pp. 617-624. Oxford: Academic Press. https://www.researchgate.net/publication/301702346_Yogurt_The_Product_and_its_Manufacture
Measurement of Yogurt Internal Quality Through Using Vis/NIR Spectroscopy – Shao, He, Feng, Food Research International 40 (2007) 835-841
https://www.sciencedirect.com/science/article/pii/S0963996907000294
The Feasibility of Using Near-Infrared Spectroscopy and Chemometrics for Untargeted Detection of Protein Adulteration in Yogurt: Removing Unwanted Variations in Pure Yogurt – Xu, Yan, Cai, et al., Journal of Analytical Methods in Chemistry, Volume 2013, Article ID 201873
https://www.ncbi.nlm.nih.gov/pmc/articles/PMC3697415/
Commercial References
The post Yogurt Overview appeared first on NIR-For-Food.
]]>The post Cocoa & Chocolate Overview appeared first on NIR-For-Food.
]]>Introduction
The cocoa bean is the seed of the tropical cacao tree and is used to make cocoa powder, chocolate from cocoa liquor, and cocoa butter. There are three main varieties of the cocoa plant: Forastero, Criollo, and Trinitario, with Forastero comprising between 80% and 90% of the world’s cocoa production. Worldwide production of cocoa has grown by nearly 200% in the last forty years to reach over 4.5 million metric tons in 2013. Nearly two-thirds of the world’s cocoa beans are produced in African nations and Ivory Coast and Ghana alone produce just under 50% of worldwide cocoa production. Most of the rest of the world’s cocoa is produced in Asia, South America, and tropical areas of North America. The process begins by harvesting pods from the trunk and branches of the cocoa tree. Pods have a tough, leathery rind, typically contain thirty to fifty seeds, and are filled with a sweet pulp. The normal amount of time for pods to become suitable for harvest is three to four weeks, meaning the same trees can be harvested multiple times in one season. In some countries, harvesting of cocoa pods can occur year-round. Within a week to ten days after harvesting, the pod is cut open, the rind is discarded, and the pulp and cocoa seeds are removed. Pulp and seeds are laid out and covered, usually with mats or banana leaves. The thick pectin-containing pulp liquifies as it ferments in a process known as sweating and trickles away during fermentation over a week to ten days. This process is important for bean flavor since it helps reduce the bitter flavor found in the beans when they are harvested from the tree. If the pods are harvested prematurely, then beans can have a low cocoa butter content or sugars in the pulp can be insufficient for fermentation, both of which can result in a weak flavor. After fermentation is complete, the beans are usually shuffled and left to dry in the sun. Beans must have a low moisture content before shipping in order to reduce the risk of mold and mildew contamination. In recent years, beans are often shipped in large bulk containers to reduce shipping costs. These containers can hold up to several thousand tons of beans in one container or a number of smaller twenty-five-ton containers.
Chocolate Manufacturing
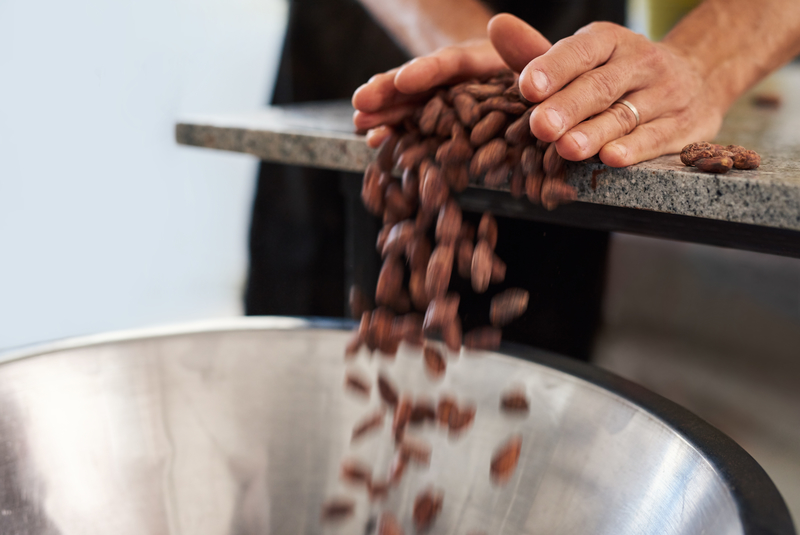
Upon arrival at a chocolate manufacturing facility, the dried beans are cleaned to remove any unwanted material. Beans are then roasted to bring out the flavor and color. Roasting time, temperature, and degree of moisture depending on the type of beans used and the desired end product. A winnowing machine removes the shell from the beans, leaving just the cocoa nibs. The nibs (dried internal portion of the cocoa bean) are heat-treated to kill any possible bacteria before the alkalization process begins. Alkalization (also known as Dutching) is designed to manipulate the pH to further develop the flavor and color. Nibs are soaked in an alkali solution (usually potassium carbonate). Further roasting is needed after the Dutching process to dry the beans and enhance flavor. Depending on the desired end product, alkalization can occur either on the cocoa cake or chocolate liquor later in the manufacturing process instead of on the cocoa nibs, but the most common method is to perform it on the nibs.
Cocoa nibs are milled to make liquor paste. There are different types of grinders used in this process but all of them grind the nibs to release fat, sometimes in multiple stages. The process yields particles of cocoa suspended in cocoa butter. Temperature and degree of milling are adjusted according to the desired product specifications. For many chocolate products, different kinds of beans are used and blending them to the required formula often occurs at this stage. The cocoa liquor is pressed to extract and separate cocoa butter from the solid particles. The leftover solid mass is known as cocoa press cake. The amount of fat present in the press cake is inversely proportional to the amount of fat extracted from the liquor and this can be controlled by the manufacturer. At this point, the processing takes two separate directions to make cocoa powder from the solids and chocolate from the cocoa butter. The cocoa press cake is broken up and pulverized to form cocoa powder. Cocoa powder is known for its health benefits while containing very little sugar and fat compared to chocolate.
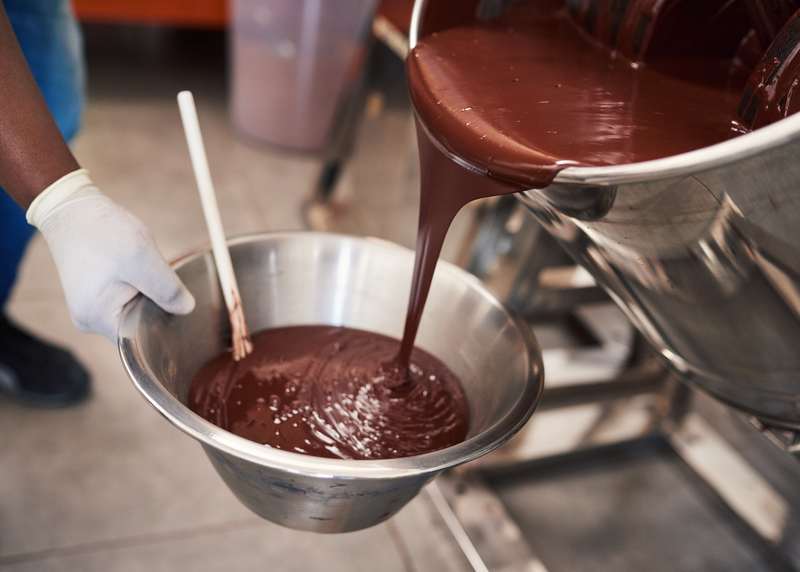
The leftover cocoa liquor forms the base for making chocolate. The three main types of chocolate are dark chocolate, milk chocolate, and white chocolate. Dark chocolate contains sugar, cocoa butter, cocoa liquor, and may or may not contain vanilla. Milk chocolate contains the same ingredients but adds milk or milk powder, has a smaller proportion of cocoa butter, and will always contain vanilla. White chocolate contains the same ingredients as milk chocolate without the cocoa liquor. After the mixing of ingredients, the mixture is refined by pressing through a series of rollers, which forms a smooth paste. This process improves texture. The mixture then undergoes conching, which is running the mixture through a mixer and agitator that evenly distributes the cocoa butter within the chocolate. Temperature is controlled and can vary from 120°F for milk chocolate to 180°F for dark chocolate. Air flowing through removes some unwanted acids and reduces moisture. The material is powdery and mixing coats the particles with fat, redistributing the substances from dry cocoa into the fat phase. Conching changes the particles from dry to pasty to liquid and additional fats and emulsifiers can be added to change viscosity near the end of the process.
The final stage of making chocolate is known as tempering. When the fats in cocoa butter crystallize, it can result in crystals of six different sizes because of polymorphous crystallization. This results in an untempered appearance and can cause the chocolate to crumble rather than snap when broken. The six crystal sizes have different melting points and physical properties. The idea of tempering is to assure that only the best form is present, which has a melting point of 93°F, a glossy but firm texture, and snaps clean when broken. Chocolate is heated to 113°F to melt all crystals and then agitated while cooled to 81°F. At this point, two forms of the crystals will be present. The chocolate is then heated to about 88°F to only leave the desired form of crystal remaining. Excessive heating of the chocolate at this stage will require restarting the tempering process. After tempering, the chocolate is poured into molds, cooled, and is ready for packaging. Chocolate is sensitive to temperature and humidity. Ideal storage conditions are around 60°F with a relative humidity below 50% and in a dark place for unwrapped chocolate.
Conclusion
NIR spectroscopy has emerged as a tool for rapid, non-invasive, and cost-effective analysis of parameters of interest in cocoa & chocolate that could potentially replace traditional reference methods. Classification and quality assessment of cocoa beans are of paramount importance in chocolate manufacturing. Different varieties of beans present diverse chemical composition and make it difficult to standardize parameters during processing. Important parameters in cocoa beans include protein, fat, moisture, ash, carbohydrates, fermentation index, pH, total polyphenols, and color measurements. Methods for testing these parameters are time-consuming and often require skilled technicians and wet chemistry methods. One example of this is the Conway method, used to measure gas quantitatively by a specific reagent or enzyme. This technique is used to measure ammonia nitrogen (NH3) in cocoa beans, a good indicator of fermentation time. NIR spectroscopy can be used in-line during the manufacturing process as well. One example is measuring cocoa butter crystal content parameters during tempering of chocolate, which is the essential final processing step during manufacturing. Viscosity, enthalpy, and slope values (a function of a cooling curve and exit temperature in a crystallizer) have all been correlated to NIR spectra using calibration models, showing the potential for real-time, on-line monitoring of the chocolate tempering process. All of these parameters and measurements have been studied using NIR spectroscopy with results showing the potential to replace traditional reference methods.
References
International Cocoa Organization – How Exactly Is Cocoa Harvested?
https://www.icco.org/faq/58-cocoa-harvesting/130-how-exactly-is-cocoa-harvested.html
International Cocoa Organization – Processing Cocoa
https://www.icco.org/about-cocoa/processing-cocoa.html
Cocoa Guide: How to Process Cocoa Beans
https://www.asanduff.com/cocoa-guide-process-cocoa-beans
Alkalizing Cocoa and Chocolate
http://www.blommer.com/_documents/Blommer_Alkalizing_Cocoa_and_Chocolate.pdf
Lesson – Tempering Chocolate and Why
https://www.ecolechocolat.com/en/chocolate-tempering.html
Classification and Compositional Characterization of Different Varieties of Cocoa Beans by Near Infrared Spectroscopy and Multivariate Statistical Analysis – Barbin, Maciel, Bazoni, et al., Journal of Food Science and Technology, July 2018 55(7): 2457-2466
https://www.sciencedirect.com/science/article/pii/S0168169916301284
Non-Destructive Determination of Cocoa Bean Quality Using FT-NIR Spectroscopy – Sunoj, Igathinathane, Visvanathan, Computers and Electronics in Agriculture 124 (2016) 234-242
https://www.sciencedirect.com/science/article/pii/S0168169916301284
In-Line Measurement of Tempered Cocoa Butter and Chocolate by Means of Near-Infrared Spectroscopy – Bolliger, Zeng, Windhab, JAOCS, Vol. 76, no. 6 (1999)
https://link.springer.com/article/10.1007%2Fs11746-999-0157-5
Commercial References
The post Cocoa & Chocolate Overview appeared first on NIR-For-Food.
]]>The post Butter Overview appeared first on NIR-For-Food.
]]>Butter is a dairy product composed of up to 80% butterfat as well as milk proteins and water. Butterfat is a mixture of triglyceride, an ester derived from glycerol and fatty acids which vary in different types of triglycerides. Butter can become rancid when oxidation occurs and breaks the triglyceride chains into smaller compounds, such as butyric acid and diacetyl. Proper packaging and storage are vital to prevent oxidation of butter. Other ingredients which are sometimes added include salt, various flavorings, and preservatives. Butterfat can also be known as milk fat and is defined as the fatty portion of milk. It is made by churning fresh or fermented cream or milk to separate the butterfat from the buttermilk. Although mostly made from cow milk, other types of milk can be used, such as sheep, goat, and buffalo. Butter remains solid when refrigerated, turns soft and spreadable at room temperature, and typically melts to liquid around 90°F. It has a variety of uses, such as a spread on bread products, a condiment on cooked vegetables, a dipping sauce for bread and some types of seafood, and cooking uses like pan-frying and baking. Butter is typically light yellow in color but can vary depending on the source animal and food coloring can be used to modify color as well. Butter can be both cultured and non-cultured. If cultured butter is desired, bacteria are added to create lactic acid from sugars in the milk by fermentation. Cultured butter is typically not washed or salted.
Butter Manufacturing
The origin of butter goes back about 10,000 years to when humans first began to domesticate animals. Most butters were made by hand on farms until the middle of the 19th century when the first butter factories began to appear. Today’s butter manufacturing is usually done as a continuous process, but batch processing is done on a smaller scale as well. The first step is procuring and preparing the cream, which can be provided directly by the milk dairy or separated from whole milk by the butter manufacturer. Sweet cream at a pH above 6.6 without rancidity or oxidation is preferable. If separation is required, the whole milk is pasteurized and passed through a separator. After cooling, the cream is stored and fat content is adjusted to the proper level, if necessary. Leftover skim milk is pasteurized, cooled, and stored for concentration and drying. The cream is pasteurized at a minimum temperature of 95°C to destroy enzymes and microorganisms. Mixed cultures are added to the cooled cream at this stage if fermentation is desired. pH will drop to 5.5 at 21°C and 4.6 at 13°C and most flavor development related to ripening occurs in between these two pH levels.
Whether cultured or non-cultured, the cream is then moved to an aging tank and subjected to controlled cooling to give the fat the required crystalline structure. The exact aging process can vary and is modified based on factors like the composition of the butterfat in terms of iodine value, which is a measure of unsaturated fat content. Butter contains fat in three separate forms: free butterfat, butterfat crystals, and undamaged fat globules. The proportion of these forms affects the consistency and hardness of the butter. More crystals will result in harder butter than those dominated by free fats. Typical aging length is twelve to fifteen hours. Once aging is complete, the cream is pumped to the churn (or continuous butter maker in a continuous process) through a plate heat exchanger which brings it to the desired temperature. This temperature is normally around 55°F although it can vary from 50°F to 62°F depending on conditions. If the temperature is too high, the butter will be made in a very short time but there will be a substantial loss of fat in the buttermilk. If the temperature is too low, churning will take a long time and the butter produced will be excessively hard. During churning, the cream is violently agitated to break down the fat globules, which causes the fat to coagulate into butter grains. As coagulation occurs, the fat content of the buttermilk liquid decreases.
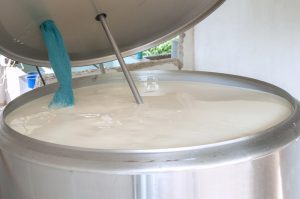
After the cream is split into butter grains and buttermilk, the buttermilk is drained off. In traditional batch churning, the buttermilk is drained off when the grains reach a certain size. If a continuous butter maker is used, the draining is continuous during the churning process. Additional washing can occur at this stage to remove residual buttermilk and milk solids. The grains are pressed and kneaded together, consolidating the butter into a solid mass and breaking up embedded pockets of buttermilk and water into small droplets. This liquid phase is drained off and if added, the butter is ready for salting at this point. Salt improves flavor and acts as a preservative. In batch production, salt is spread over the surface in an amount of 1% to 3% of the total butter weight. In continuous production, a salt slurry at a concentration of 10% is added. It is important to work the butter and salt vigorously to ensure a homogenous blend of butter granules, salt, and water. The fat moves from globule to free fat during working. Water droplets will decrease in size and should not be visible after the working Is complete. Some water can be added to standardize the moisture content. Proper working is essential to obtain maximum yield and get the desired characterization of aroma, taste, shelf-life, appearance, and color. After working is complete, the finished butter is discharged, packaged, and moved to cold storage.
Conclusion
NIR spectroscopy has emerged as a tool for rapid, non-invasive, and cost-effective analysis of parameters of interest in butter that could potentially replace traditional reference methods. As is the case with all dairy products, fat content is of paramount importance at all stages of the butter manufacturing process, from the initial stage of cream measurement all the way to the final working (and salting in the case of salted butter). Solid Fat Content (SFC) is of particular importance during the aging stage as optimized crystallization conditions are crucial for product quality. The fat analysis involves time-consuming and expensive wet chemistry methods and in the case of SFC, NMR spectroscopy is used which requires a sixteen-hour delay before tempering of the sample to meet approved reference standards. Moisture is also important, and water is known as one of the most detectable compounds using NIR spectroscopy due to its high absorbance of NIR light. Although salt does not directly absorb NIR light, it does change other compounds that absorb in the NIR spectrum and the feasibility of this indirect measurement has been proven in studies. As is the case with most food products, there are different grades and quality levels in butter that make it a target for adulteration. Misrepresentation of a region of origin or animal of milk source is two potential methods of butter adulteration. Another is adding a less valuable product to butter. One such potential adulterant for butter is tallow, a hard-fatty substance made from rendered animal fat. NIR spectroscopy has been used as a method to detect tallow adulteration in butter. All of these parameters and measurements have been studied using NIR spectroscopy with results showing the potential to replace traditional reference methods.
References
Overview of The Buttermaking Process
https://www.uoguelph.ca/foodscience/book-page/overview-buttermaking-process
The Steps Involved in Butter Production Process
http://food-beverage.ezinemark.com/the-steps-involved-in-butter-production-process-7d35275213af.html
How to Make Butter
http://www.countryfarm-lifestyles.com/how-to-make-butter.html#.XGcCb_ZFxRd
What Is Cultured Butter
https://www.leaf.tv/articles/what-is-cultured-butter/
Aged Butter
http://nordicfoodlab.org/blog/2016/1/21/aged-butter-part-1-background-and-basics
http://nordicfoodlab.org/blog/2016/1/29/aged-butter-part-2-the-science-of-rancidity
At-Line Near-Infrared Spectroscopy for Prediction of the Solid Fat Content of Milk Fat from New Zealand Butter – Meagher, Holroyf, Illingworth, et al., Journal of Agricultural and Food Chemistry, 2007, 55, 2791-2796 https://pubs.acs.org/doi/abs/10.1021/jf063215m?journalCode=jafcau
Robust New NIRS Coupled With Multivariate Methods for the Detection and Quantification of Tallow Adulteration in Clarified Butter Samples – Mabood, Abbas, Jabeen, et al., Food Additives & Contaminants: Part A, 35:3, 404-411
https://tandfonline.com/doi/abs/10.1080/19440049.2017.1418090?journalCode=tfac20
Commercial References
The post Butter Overview appeared first on NIR-For-Food.
]]>The post Cheese Overview appeared first on NIR-For-Food.
]]>Introduction
Cheese is a dairy product derived from milk and is produced in a variety of flavors and textures. It comprises proteins and fat from milk and forms by coagulation of the milk fat casein. The milk can be either acidified or the enzyme rennet can be added to cause the coagulation. Most cheeses are made from whole cow milk, with worldwide production of 18.7 million metric tons in 2014. The United States accounts for approximately 29% of this production, with various European countries accounting for most of the rest. Other types of milk used for cheese are skimmed cow, goat, sheep, and buffalo milk. There are approximately five hundred varieties of cheese recognized by the International Dairy Federation. There are many different criteria that can be used for classification, such as length of aging, texture, method of making, fat content, milk, and country or region of origin. There are some broad categories for cheese classification, such as acid or rennet cheese and natural or process cheese. Natural cheese is made directly from milk while process cheese uses natural cheese and other ingredients that are cooked together, affecting texture, melting properties, and shelf life. Another common category is moisture content, which directly affects hardness and can be designated as soft, semi-soft, semi-hard, and hard. However, there is no universal standard for most methods of cheese classification.
Cheese Manufacturing

Cheese manufacturing is a highly varied process depending on the exact type of cheese being manufactured. Temperature, time, target pH, sequence of processing steps, the use of salting or brining, block formation, and aging can vary considerably between cheese types and even in the intended end use of the same type of cheese (such as Cheddar manufactured for shredding, melting, or for cheese meant to be aged for several years). It is the job of a cheesemaker to control the spoiling of milk into cheese in a consistent manner with specific characteristics such as appearance, aroma, taste, and texture. The process described below generally refers to the manufacture of Cheddar, one of the most produced and popular cheeses. However, potential variations in the manufacturing process for other types of cheeses are referred to as well.
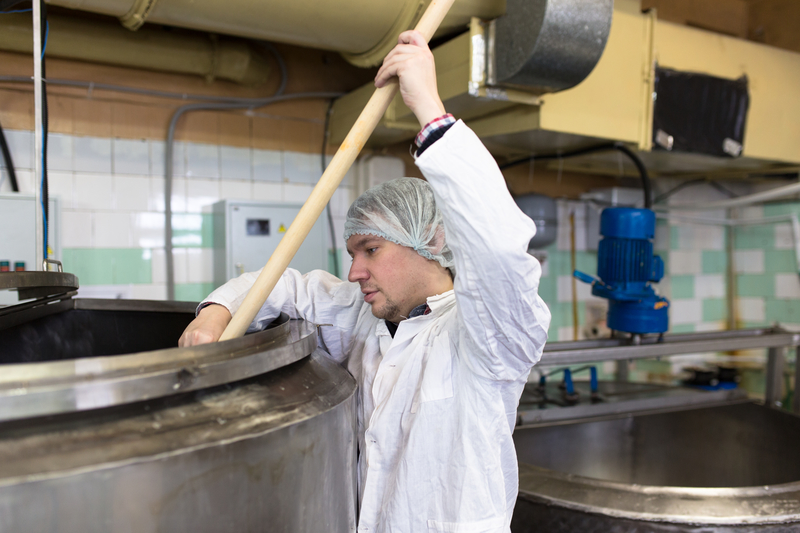
The first step in cheese manufacturing is often standardization of the milk. Standardization is the practice of adjusting the composition of cheese milk, usually by optimizing the protein to fat ratio. This can maximize economic return from the milk components while maintaining both quality and composition specifications. These specifications can be defined by the manufacturer or may be imposed by government regulations (often varying from country to country). Milk can be pasteurized or mildly heat-treated to reduce spoilage organisms and optimize the environment for starter cultures to grow. Some varieties of cheese are made from raw milk. Such cheeses must be aged for a minimum of sixty days to reduce the possibility of exposure to disease-causing pathogens that may be present in the milk. The milk must be cooled to a temperature of 90°F (32°C) if pasteurized or heated to the same temperature if the milk is raw for the starter bacteria to grow. Such cultures are called lactic acid bacteria (LAB) because their primary source of energy is milk lactose and their primary metabolic product is lactic acid. Starter cultures assist with coagulation by lowering pH prior to rennet addition while adjunct cultures provide and enhance characteristic flavors and textures. Bacteria which only produces lactic acid during fermentation are homofermentative while bacteria which produces other compounds as well are heterofermentative. Cheeses with a clean, acidic flavor like Cheddar require a homofermentative bacteria while fruity cheeses and cheese with bubbles in it require heterofermentative bacteria. Starter cultures and any adjunct cultures are added to the milk and held at 90°F for thirty minutes to ripen, which allows the bacteria to grow and begin fermentation as well as lowering pH and developing flavor.
Once the cheesemaker has determined that sufficient lactic acid has been developed during fermentation, the coagulation process begins. Rennet contains the enzyme chymosin which coagulates the milk protein and forms curds. As a general rule, 3 oz to 4 oz of rennet is added per 1000 lb. of a mix. It converts κ-casein to para-κ-caseinate, which is the main component of cheese curd. The vat must be thoroughly mixed to ensure a uniform mixture and the mixture must set for a minimum of 30 minutes to allow the curd to set. The mixture is kept between 84°F and 88°F. Temperature is controlled by flowing warm water through the jacket of the vat. Once the curd is ready, the liquid whey must be separated from it. Some soft cheeses are simply drained, salted, and packaged at this stage. For cheddar, the curd is cut into small pieces, cooked, and stirred until the desired temperature and firmness of the curd is reached. The cube size after cutting ranges from 0.25 to 0.63 cubic inches and the moisture level of the cheese will increase with larger cubes. After cutting, the curd is allowed to set for ten to fifteen minutes and is handled gently to prevent fat and protein loss. Hot water is added to the jacket of the vat for cooking. Stirring is constant during cooking and the time ranges from twenty minutes to sixty minutes. By the time cooking is complete, the pH will be around 6.4. The whey is then drained from the vat. There are different ways to separate the curd and liquid whey, but this is considered a standard method.
Depending on the type of cheese, various types of curd processing usually occur after initial separation of the curd and whey. Cheddaring is a unique process for cheddar cheese that involves stacking loaves of curd on top of one another to squeeze additional whey out of the loaves below. It also allows fermentation to continue to lower the acidity. Six-inch-wide loaves are cut along each side of the vat. After ten minutes, the loaves are turned over and stacking begins. The weight of the stacked loaves allows additional moisture to be expelled. This process continues using larger stacks (usually up to 4) and the loaves are turned every ten minutes until the pH of the whey reaches 5.1 to 5.5. The loaves are then cut into smaller pieces, returned to the vat, and sprinkled with dry salt. Salt is generally added at an amount between 1% to 3% of the weight and helps remove additional whey, prevents spoiling, adds flavor, prevents the cheese from becoming too bitter and acidic, and hardens texture by interacting with proteins. After salting, the curd pieces are placed in cheese hoops and pressed into blocks to form the cheese. The blocks are then stored in coolers and aged from anywhere to several months to several years, depending on the variety of cheese. There are many variations that can take place in this process for different types of cheeses. Moist and creamy cheeses like Brie and Camembert require a more gentle treatment of the curd. They are drained after coagulation by being hung from cheese hoops, immersed in a salt solution, and are either immersed in or sprayed with mold spores. Other cheeses can be ripened internally during some point in the process or ripened on the surface with yeast. Mozzarella and Provolone are both stretched in curd form and kneaded in hot water, contributing to the stringy texture and fibrous body. Lower acidity cheeses like Gouda and Colby are washed in warm water to reduce acidity. Cheesemaking is a complex manufacturing process with many variations and much skill required to ensure proper product quality.
Conclusion
NIR spectroscopy has emerged as a tool for rapid, non-invasive, and cost-effective analysis of parameters of interest in cheese that could potentially replace traditional reference methods. The rapid analysis is especially important as the different stages of cheese manufacturing often happen quickly, and the cheesemaker is reliant on sensory skills to make the cheese at the desired quality. Fat, protein, and moisture are critical parameters in nearly all types of food manufacturing and these parameters have been successfully measured in cheese using NIR spectroscopy. Acidity is important as well and although salt is not directly measurable using NIR spectroscopy it does change other compounds that are measurable, and the feasibility of this indirect measurement has been proven in studies. When manufacturing is complete, the aging process starts and is important for determining many physical parameters and these have been examined as well by NIR spectroscopy. In the case of fresh cheese, shelf-life is short and critical parameters will begin to change as the cheese ages further and eventually becomes unfit for human consumption. Adulteration is an issue in all food manufacturing and cheese is no exception, especially inexpensive cheeses produced in a particular region under strict standards and guidelines. All of these parameters and measurements have been studied using NIR spectroscopy with results showing the potential to replace traditional reference methods.
References
Fundamentals of Cheese Science – Fox, Guinee, Cogan, McSweeney, Springer 2000 https://www.amazon.com/Fundamentals-Cheese-Science-Patrick-Fox/dp/1489976795
Milk Facts: Cheese Production
http://www.milkfacts.info/Milk%20Processing/Cheese%20Production.htm
FAOSTAT: Food and Agriculture Organization of the United Nations
http://www.fao.org/faostat/en/#data/QP
Standardization of Milk for Cheese Making
https://www.uoguelph.ca/foodscience/book-page/standardization-milk-cheese-making
Determination of Fat, Protein, and Moisture in Ricotta Cheese By Near-Infrared Spectroscopy and Multivariate Calibration – Madalozzo, Sauer, Nagata, Journal of Food Science & Technology, March 2015 52 (3): 1649-1655 https://www.ncbi.nlm.nih.gov/pmc/articles/PMC4348305/
NIR Spectroscopy: A Useful Tool for Rapid Monitoring of Processed Cheeses Manufacture – Curda, Kukackova, Journal of Food Engineering 61 (2004) 557-560
https://www.sciencedirect.com/science/article/abs/pii/S0260877403002152
Using Near-Infrared Spectroscopy for the Determination of Total Solids and Protein Content in Cheese Curd – Sultaneh, Rohm, International Journal of Dairy Technology, Volume 60, No.4, November 2007 https://onlinelibrary.wiley.com/doi/full/10.1111/j.1471-0307.2007.00347.x
Commercial References
The post Cheese Overview appeared first on NIR-For-Food.
]]>The post Milk Overview appeared first on NIR-For-Food.
]]>Introduction
Milk is a nutritive beverage mostly obtained from dairy cows, although it is obtained from camels, goats, water buffalo, and reindeer in different parts of the world. In the United States and many other industrialized countries, raw milk is processed before human consumption. These processes include adjusting fat content, adding vitamins, and killing potentially harmful bacteria using the pasteurization process. There are many different types of milk and classification is based on different factors, such as the amount of milk fat, type of processing, and the type of dairy cow that produced the milk. Prior to 1998, FDA standards required that milk sold as whole milk must have no less a 3.25% milk fat, low-fat milk must have 0.5% to 2.0% milk fat, and skim milk must have less than 0.5% milk fat. Updated standards require 2% milk fat to be labeled as “reduced-fat” and 1% milk as “low-fat”. Milk fat is the richest energy component of milk, containing a high proportion of saturated fatty acids. Processing-based classifications include pasteurized (heated to kill any harmful bacteria), homogenized (fat particles reduced in size and blended to prevent cream formation), and vitamin-fortified (various vitamins added during manufacturing). Most milk produced in the United States fits all three of these classifications. Grade A milk is produced under sufficiently sanitary conditions to be sold as fluid milk and about 90% of milk made in the U.S. meets these standards. Grade B milk is acceptable for manufactured products like cheese where further processing is required. Certified milk is produced under highly sanitary standards and is more expensive than Grade A milk.
Milk Processing
The average composition of cow’s milk is 87.2% water, 3.7% milk fat, 3.5% protein, 4.9% lactose, and 0.7% ash. This composition can vary based on cow breed, season, animal feed content, and many other factors. Cows are milked twice a day using mechanical vacuum milking machines, which are filled, cooled, and then pump the milk into a refrigerated tank truck where the milk is transported to the processing plant and again pumped into refrigerated tanks in the plant. The cold raw milk passes through a clarifier to remove debris, bacteria, and sediment. A separator can be also be used to perform these tasks. The separator can also separate heavier milk fat from the lighter milk to produce both cream and skim milk. Excess fat can also be drawn off and processed into cream or butter. Vitamins A and D can be added to the milk after separating and before pasteurization. Pasteurization kills any bacteria and the standard requirement for whole milk, skim milk, and standardized milk is heating to 161°F for 15 seconds. The requirements vary for other products and a temperature sensor redirects the milk for another pass through the pasteurization tube if the temperature has fallen below the required level. After pasteurization, homogenization is performed by pressurizing the hot milk to 2500 psi to 3000 psi by a piston pump and forcing the milk through small passages in an adjustable valve. The shearing effect breaks down the fat particles to proper size, which ensures even distribution and prevents the milk fat from separating and floating to the surface as cream. After homogenization, the milk is quickly cooled to 40°F to avoid any harm to the taste. The cooled milk is packaged in either coated paper cartons or plastic bottles, sealed, and shipped to distribution warehouses in refrigerated trailers.
Conclusion
NIR spectroscopy has emerged as a tool for rapid, non-invasive, and cost-effective analysis of parameters of interest in milk that could potentially replace traditional reference methods. Fat is considered the most important parameter in milk because it is the richest energy component and its content is highly regulated. Fat has been successfully measured using NIR spectroscopy and calibration models in numerous studies. Protein, lactose, and urea are considered important parameters as well and these have also been successfully measured using NIR spectroscopy. Other parameters of interest including freezing point, solids content, and acidity measurements. Adulteration is a tremendous problem in the food and beverage industry and milk is no exception. Liquid milk adulteration can occur by mixing a cheaper brand of milk with a more expensive brand. Milk powder is the second most adulterated food behind olive oil according to the USP database on food fraud and economic adulteration. All of these parameters and measurements have been studied using NIR spectroscopy with results showing the potential to replace traditional reference methods.
Scientific References
Milk: How Products Are Made
http://www.madehow.com/Volume-4/Milk.html
What Are The Steps In Milk Processing?
https://www.wisegeek.com/what-are-the-steps-in-milk-processing.htm
Accuracy of In-Line Milk Composition Analysis with Diffuse Reflectance Near-Infrared Spectroscopy – Melfsen, Hartung, Haeusserman, Journal of Dairy Science 95: 6465-6476 https://www.sciencedirect.com/science/article/pii/S0022030212006509
Accuracy of the FT-NIR Method in Evaluating the Fat Content of Milk Using Calibration Models Developed for the Reference Methods According to Rose-Gottlieb and Gerber – Mlcek, Dvorak, Sustova, Szwedziak, Journal of AOAC International Volume 99, No. 5, 2016
https://www.ncbi.nlm.nih.gov/pubmed/27324807
Non-Targeted NIR Spectroscopy and SIMCA Classification for Commercial Milk Powder Authentication: A Study Using Eleven Potential Adulterants – Karunathilaka, Yakes, He, et al., Heliyon 4 (2018) e00806. https://www.heliyon.com/article/e00806/pdf
Commercial References
The post Milk Overview appeared first on NIR-For-Food.
]]>