The post Alcoholic Beverages Adulterant Analysis appeared first on NIR-For-Food.
]]>The post Alcoholic Beverages Adulterant Analysis appeared first on NIR-For-Food.
]]>The post Spirits Analysis appeared first on NIR-For-Food.
]]>Introduction
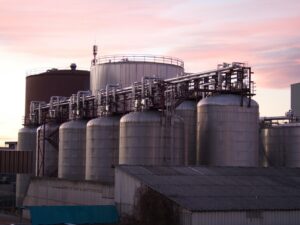
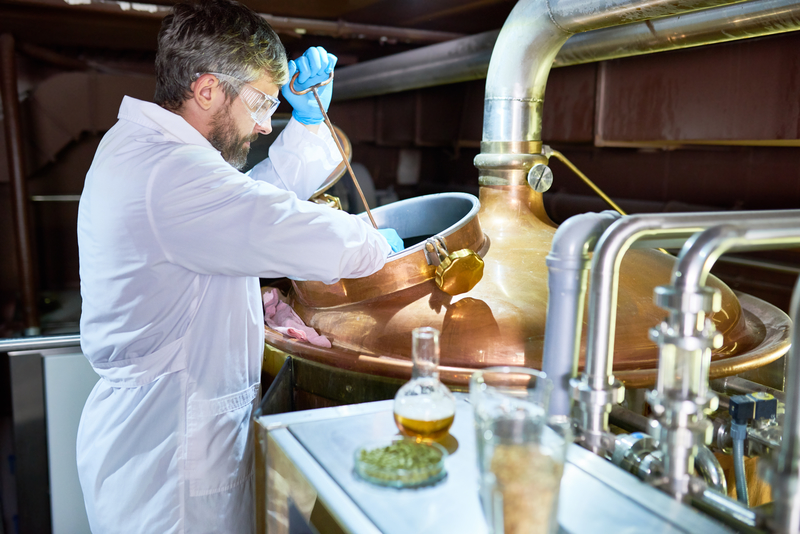
NIR spectroscopy has been a reliable technique for distillery quality assurance at a major distiller for over twenty years, used as both a research tool and quality assurance tool. As a research tool, NIR spectroscopy can be used to evaluate raw materials, yeast, enzymes, nutritional supplements, and production parameters to optimize conditions for the production plant. As a quality assurance tool, it can be utilized to monitor and maintain control of processes. The major advantage of NIR spectroscopy is rapid analysis that requires no sample preparation or destruction of the sample. Traditional analysis of parameters of interest in distillation monitoring often take hours or even days to implement. Real-time feedback in areas of production like incoming grain monitoring, fermentation profiles, distillate analysis, dry house operations, and finished product analysis provide benefits which cannot be understated, maximizing resources and energy which subsequently leads to financial savings. The summary provided here documents the process and benefits of using NIR spectroscopy as an analytical tool throughout the entire distillation process, from incoming grain analysis to the final product being bottled. NIR spectroscopy can also be used as a screening tool to detect the present of adulterants in the final product of distilled alcoholic beverages.
Analytes
- Starch
- Oil
- Protein
- Moisture
- Ethanol
- Dextrins
- Dextrose
- Maltose
- Lactic Acid
- Glycerol
- Percent Solids in Solubles
- Fat
- Fiber
- Ash
- Methanol
- Adulteration
Summary of Published Papers, Articles, and Reference Materials
 A detailed and thorough book chapter is discussed documenting the use of NIR spectroscopy at a large distillery for monitoring all points of the distillation process, including raw grain analysis, fermentation monitoring, dryhouse operations, and ethanol determination and blend analysis. Parameters of interest are thoroughly detailed as well as the benefits of using NIR spectroscopy as a real-time analytical tool in the distillery. One study used NIR spectra of stock solutions of ethanol and methanol to create calibration models for determining these parameters in commercial alcoholic beverages. Results were excellent and a similar study was conducted using stock solutions of glucose, sucrose, and fructose for fruit juice analysis. Adulteration is a major problem in the food and beverage industries and NIR spectroscopy was examined as a method for classifying different distilled beverages as well as determining the presence of water, ethanol, or methanol adulterant in them. Samples were classified at a 100% success rate and the results proved the feasibility using NIR spectroscopy as a screening tool to determine the presence of an adulterant in alcoholic beverages, allowing the classification of adulterated samples for further analysis using a traditional method like chromatography to quantify the amount of adulterant present.
Scientific References and Statistics
Livermore, Wang, and Jackson – The Alcohol Textbook, 4th Edition, Nottingham University Press, 2003, Chapter 12 – Understanding Near Infrared Spectroscopy and its Applications in the Distillery, pp. 146-170
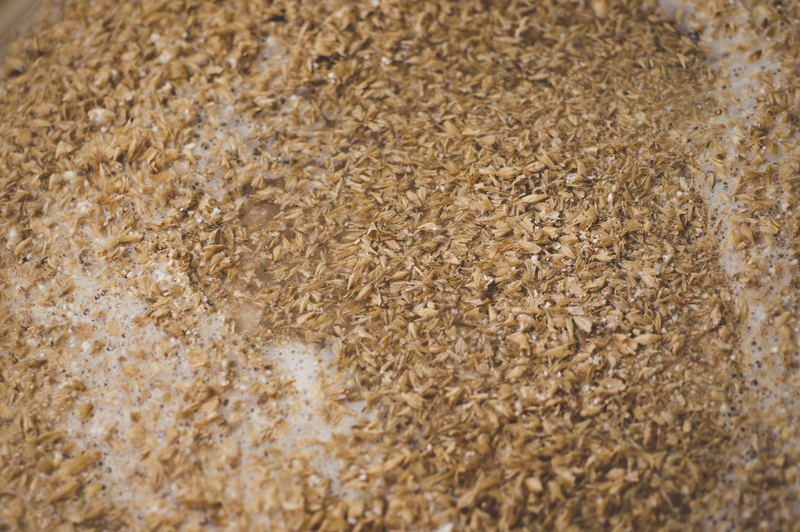
Incoming Grain
Although it can vary by the type of whiskey, a good estimate of the mash bill for corn is around 90%. While it is the biggest expense for a distillery, corn goes largely unmonitored. For incoming grain, moisture, protein, oil, and starch are of critical importance and can all be measured by NIR spectroscopy. High moisture can cause mechanical problems with a hammer mill and thus downtime in the distillery. Grain with moisture over 15% can cause this problem as well as reduce the starch available for fermentation. Protein affects the composition of Dried Distillers Grains (DDGS), a valuable by-product at the end of distillation that is often sold as livestock feed. High oil content exists in some genetic varieties of corn and this type of corn is considered disadvantageous for distillation. Starch is the most important component for overall yield because it is the source of fermentable sugar for yeast growth and subsequent alcohol production. Besides the obvious advantages of no sample preparation and rapid analysis of these constituents in incoming grain, there are others as well. Corn from an incoming truck can be analyzed at different points to ensure that the seller did not attempt fraud by placing high quality corn at the top of the load and lower quality corn at the bottom. Other advantages include tracking production efficiencies, accumulation of crop data, and variety selection for desired characteristics. Shown below are the typical range of values and expected RMSEP (Root Mean Standard Error of Prediction) for the incoming corn calibration models used at the distillery:
| Starch | Typical Range of Values = 60-62% | RMSEP = 1.2% |
| Oil | Typical Range of Values = 2-3% | RMSEP= 0.5% |
| Protein | Typical Range of Values = 7-8% | RMSEP= 0.5% |
| Moisture | Typical Range of Values = 12-15% | RMSEP= 0.3% |
These models have been tested using validation sets and the error of prediction in the original data set was comparable to the error in the validation set, proving the accuracy and feasibility of the models for measuring these parameters.
Fermentation Monitoring
Fermentation monitoring is extremely complex because many factors affect the alcohol content and overall yield. Optimal efficiency can be achieved, but in practice this is difficult to do. HPLC is used by most distilleries for fermentation monitoring of sugars, acids, glycerol, and alcohol. All these parameters are interrelated and HPLC is a difficult and expensive method for monitoring. It is especially expensive to implement HPLC in a process setting. It requires highly skilled technicians, expensive accessories and volatile chemicals, sample preparation which often requires centrifuging or filtering, and a minimum feedback time of twenty minutes. The results are often not as accurate as desired for accurate monitoring. NIR monitoring can identify non-optimal conditions in fermentation almost immediately, allowing for real-time adjustments and process optimization. The benefits and potential improvements in fermentation efficiency are immense. For example, if a 200,000 L fermenter completes the fermentation process when the alcohol content reaches 9.6%, the plant will produce 19,200 liters of absolute alcohol per fermenter. If real-time feedback can provide protocols to adjust factors such as changing enzymes, process parameters, and nutritional supplements and increase alcohol yield by 1%, each fermenter will now produce 21,200 liters of absolute alcohol. The optimization produces the same amount of absolute alcohol in nine hundred five fermenters instead of one thousand, resulting in savings in raw materials, fuel, steam, labor, maintenance, and equipment. This can potentially save a large distillery millions of dollars per year. Even a 0.1% increase in alcohol yield during large-scale fermentation will result in substantial savings in resources and money for a distillery.
Ethanol content in corn mash can be correlated to NIR spectra using two different reference methods: HPLC and distillation – DMA. The distillation – DMA method is to distill 100 mL of corn mash, collect 100 mL of the distillate, and then determine percent alcohol via DMA. Models have shown that distillation – DMA provides more accurate results than HPLC as a reference method for ethanol. In contrast, HPLC is the reference method of choice for sugar analysis. During fermentation, sugar values should show a consistent decrease and if they do not, the sugar is not being properly converted to alcohol and adjustments must be made to correct the problem. Lactic acid is another important parameter to measure during fermentation. It is produced by bacteria that compete with yeast for sugar. If a high value of lactic acid is determined, bacteria are being produced and the distiller must take steps to correct the problem. Potential solutions include adjusting backset stillage rates and using antibacterial products as well as washing out if the bacteria concentration is high enough. Shown below are RMSEP values from calibration models used at the distillery for fermentation monitoring:
| Ethanol | RMSEP = 0.14% |
| Dextrins | RMSEP = 0.50% |
| Dextrose | RMSEP = 0.46% |
| Maltose | RMSEP = 0.52% |
| Lactic Acid | RMSEP = 0.11% |
| Glycerol | RMSEP = 0.07% |
Using these calibrations is an extremely valuable tool in fermentation monitoring in many ways. Fermenter troubleshooting can involve checking records for correct yeast or enzyme addition, auditing for mechanical failures, leaks in cooling coils, and problems in washer rotators. If the alcohol yield is reduced and identified in the early stages, problems can be corrected before the final yield is compromised. Fermentation efficiency and the impact of nutritional supplements such as nitrogen can be researched as well using NIR spectroscopy.
Dryhouse Operations
There are several applications for using NIR spectroscopy as an analytical tool in the dryhouse. Determining percent solids in solubles in the condensed syrup discharged from evaporators is important because a solids level above 40% can cause fouling and eventual plugging of the discharge lines. NIR can accurately measure the moisture percent of the condensed syrup and subsequently the percent solids. This method is used at the distillery with good accuracy.
| Percent Solids in Solubles | RMSEP = 0.8% |
The most important application for NIR during dryhouse operations is analysis of DDGS. Most distilleries provide guaranteed specifications for the constituents of interest when selling DDGS: minimum levels of protein and fat and maximum levels of moisture, fiber, and ash. Protein is especially important as DDGS is often sold as a high protein livestock feed that increases efficiency and lowers the risk of subacute acidosis in beef cattle. The current reference methods for measuring these constituents are time-consuming and sometimes expensive as well as requiring the use of hazardous chemicals: Kjeldahl for protein, Bidwell-Sterling for moisture, extraction units for fat and fiber, and oven burning for ash. Shown below are RMSEP for these parameters in the calibration models used at the distillery:
| Protein | RMSEP = 0.46% |
| Moisture | RMSEP = 0.35% |
| Fat | Fat RMSEP = 0.35% |
| Fiber | RMSEP = 0.49% |
| Ash | RMSEP = 0.13% |
There are other potential applications in the dryhouse that could benefit the distillation and fermentation process. One example is monitoring lactic acid in the backset stillage that is recycled to the fermenters. This would help control the amount of backset stillage in the mash bill and thus help optimize alcohol production. Residual starch in DDGS indicates unfermented sugar during the fermentation process. Monitoring this in the dryhouse would indicate that there are problems with alcohol yield during the fermentation process.
Blending Opportunities and Ethanol Determination
There are strict protocols for the strength of alcohol in whiskeys and liquors. Most whiskeys have a target specification of 40% alcohol by volume. The allowed deviation from this is dependent on government regulations but it generally varies from +/- 0.15% to 0.2%. One issue with alcohol blending is that suspended solids can obscure the final percent alcohol when measured by a DMA. The sample must either be distilled or oven dried to determine the solids by weight to compensate for solids in the calculation. The longer the blending product stays in the tank, the more money it costs the company. Percent ethanol in liquors has been calibrated to NIR spectra using DMA as the reference method with good results. Temperature effects on this model have been studied as well and samples collected at different temperatures proved that the model could measure accurately even if there is a failure in the temperature control system. Titratable acidity has also been measured in high proof alcohol with good accuracy.
| Ethanol | R² = 0.999 | RMSEP = 0.038% |
| Titratable Acidity | R² = 0.9952 | RMSEP = 0.106% |
The RMSEP for ethanol is small enough to make a measurement within the tolerance error for government alcohol regulations. At the time of publication, it was unclear whether or not the distillery discussed in this book chapter summary has actually implemented in-line measurements to determine the proof of spirit. Possible advantages of using in-line alcohol measurement for spirit proof include determining alcohol strength in the dilution process immediately before bottling, requiring less tank space and reducing use of resources and costs.
Partial Least Squares-Near Infrared Spectroscopic Determination of Ethanol in Distilled Alcoholic Beverages – Debebe, Temesgen, Redi-Abshiro, Chandravanshi, Chemical Society of Ethiopia 2017, 32(2), 201-209
NIR spectroscopy was examined as a method for determining ethanol and methanol in stock solutions as well as examination using the stock solution model to determine ethanol content in alcoholic beverages. NIR spectroscopy is a proven method for measuring ethanol in distilled beverages as well as determining the presence of methanol. However, the authors’ literature survey determined that there was no known study for quantifying both ethanol and methanol simultaneously using regression models. Twenty-four samples were prepared in distilled water ranging from 2% to 15% ethanol and 0.1% to 1.0% methanol. NIR spectra were collected from 1660 nm to 1720 nm at 2 nm intervals. Reference values were determined using GC and Partial Least Squares (PLS) regression models were created for ethanol and methanol. Six commercial alcoholic beverages were procured for ethanol model validation. The NIR spectra of the six commercial beverages were used with the ethanol PLS model for predictions and these predictions were compared with the reference GC analysis performed on the six samples. GC was also performed to determine the presence of methanol in the six commercial samples.
Stock Solutions:
| Ethanol | R² = 0.999 | RMSEP= 0.06% w/w |
| Methanol | R² = 0.929 | RMSEP= 0.08% w/w |
Commercial Sample Ethanol Predictions (v/v):
| Sample 1 | PLS-NIR= 48.90 | GC= 47.40 | Reported= 48.7 |
| Sample 2 | PLS-NIR= 39.96 | GC= 40.89 | Reported= 39.1 |
| Sample 3 | PLS-NIR= 40.43 | GC= 41.84 | Reported= 39.4 |
| Sample 4 | PLS-NIR= 49.39 | GC= 48.29 | Reported= 48.2 |
| Sample 5 | PLS-NIR= 37.19 | GC= 38.61 | Reported= Not Reported |
| Sample 6 | PLS-NIR= 48.61 | GC= 47.97 | Reported= 48.8 |
Prediction results showed good comparison between the PLS-NIR predictions and the GC reference tests as well as the reported ethanol content on the label of the commercial samples. Further validation was conducted by spiking three of the commercial samples with additional ethanol and the results were comparable with the predictions shown above. No methanol was determined to be present in any of the samples, both by the PLS-NIR and GC methods. The results here show promise for using calibration models created from stock solutions to universally measure ethanol and methanol in distilled alcoholic beverages. A similar study was conducted using calibration models made from NIR spectra of stock solutions of glucose, sucrose and fructose to measure sugar in fruit juices with comparable results.
https://www.ajol.info/index.php/bcse/article/view/163100
Fruit Juice Study:
Rapid Analysis of Sugars in Fruit Juices by FT-NIR Spectroscopy – Rodriguez-Saona, Fry, McLaughlin, Calvey, Carbohydrate Research 336 (2001) 63-74
https://www.sciencedirect.com/science/article/abs/pii/S0008621501002440
Classification of Distilled Alcoholic Beverages and Verification of Adulteration by Near Infrared Spectroscopy – Pontes, Santos, Araujo, et al. Food Research International 39 (2006) 182-189
NIR spectroscopy was examined as a method for classifying alcoholic beverage samples (whiskey, brandy, rum, and vodka) as well as verification of adulteration in the samples. Sixty-nine total samples were used for the study. NIR spectra of the pure samples was collected first. Various samples were then adulterated with 5% and 10% v/v of water, ethanol, or methanol and scanned as well. Spectra were collected from 1100 nm to 2500 nm using and sixteen scans were collected and averaged for each spectrum. Principle Component Analysis (PCA) and Soft Independent Modeling of Class Analogies (SIMCA) classification algorithms were used to determine pattern recognition and to characterize each group. The classification models were able to successfully classify at a 100% rate, both for determination of the type of pure sample as well as the presence of an adulterant in any given sample. The results here can be used as a screening tool to determine the presence of an adulterant in alcoholic beverages and choosing samples which show adulteration for quantitative analysis using a traditional reference method like chromatography.
https://www.sciencedirect.com/science/article/pii/S0963996905001638
Conclusion
 NIR spectroscopy shows great potential as an analytical tool in every stage of the distillation process. Parameters of interest such as moisture, ethanol, sugars, starch, protein, oil, fat, ash, and fiber are all proven constituents that can be monitored quickly, easily, and reliably using NIR spectroscopy. Other potential applications include simple ethanol analysis from stock solution models, testing for methanol contamination, and discovering the presence of adulterants in alcoholic beverages. NIR spectroscopy can be used for real-time feedback allowing optimization and troubleshooting of the entire process and will replace older, slower, and more expensive techniques. Hardware, software, and calibration model advancements in NIR spectrometers are continuously evolving, as are new research projects and applications. This evolution makes the idea of using NIR spectrometers more appealing as not only analytical and research tools for the distilling industry, but for many other types of food and beverage industries as well.
The post Spirits Analysis appeared first on NIR-For-Food.
]]>The post Wine Analysis appeared first on NIR-For-Food.
]]>Introduction
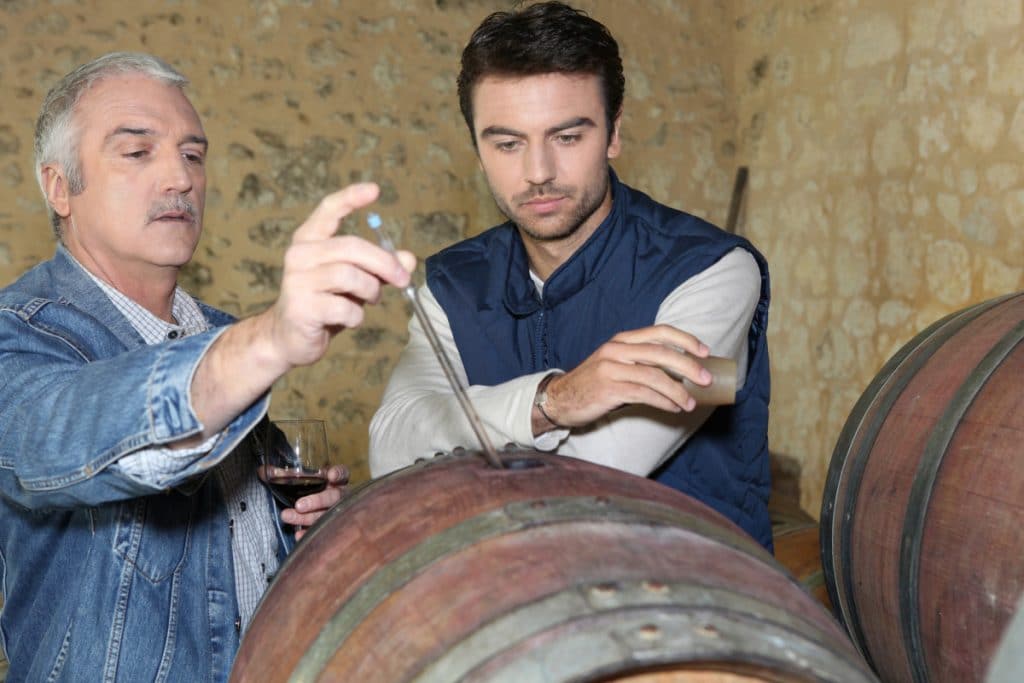
Wine is one of the most ancient beverages produced and is made by transforming sugars into alcohol during fermentation of the grape must. It is composed mainly of water, ethanol, sugars, and acids. However, there are other compounds that even in very small concentrations can greatly influence the sensory properties of the final product. There is a strong need for simple, rapid, and cost-effective techniques for objectively measuring properties of wine. Measurement of grape characteristics such as maturity assessment is important for vineyard improvement and optimizing different styles of wine. At the present time, most analysis is limited to total soluble solids (TSS expressed as °Brix), acidity, visual assessment, and tasting after vinification. More complex analyses of grapes and wine are currently unattainable on a large scale because of the time and cost involved. Tasting is subjective and while it does give wine producers a good idea about the final product when done by experts, taste alone is not enough to fully assess quality. Real-time feedback during the fermentation process of the substrates can improve quality and reduce costs. Off-line classification of yeast strains, vine tissue analysis, quality profiles, and blend analysis would also be a useful tool for analyzing wine quality. Fortified wine is made by grape spirit distillation and it is important to minimize the presence of methanol during distillation, which can be made if there is bacterial contamination.
As is the case with many valuable food and beverage products, adulteration is an issue and it is difficult to assess if a high-quality wine has been adulterated with a cheaper brand by visualization and taste. The demand for wine and the need for fast, cost-effective, real-time monitoring of the parameters has created the need for methods that can replace expensive, laborious, and time-consuming wet chemistry methods. One such method that has been studied is NIR spectroscopy.
Analytes
-
- Yeast Strain Classification
- Grape Color (Total Anthocyanin)
- Total Soluble Solids (°Brix)
- pH
- Grape Fungal Disease Detection and Quantification
- Malvidin-3-Glucoside
- Pigmented Polymers
- Tannins
- Quality Assessment
- Methanol
- Ethanol
- Variety Identification and Product Authenticity
- Nitrogen
- Potassium
- Phosphorus
- Condensed Tannins (CT)
- Dry Matter (DM)
- Volatile Compounds
- Glucose
- Fructose
- Glycerol
- Total Phenolics
- Total Anthocyanins
- Total Flavonoids
- Total Acidity
- Total Sugars
- Calcium
Summary of Published Papers, Articles, and Reference Materials
One study conducted in Australia documented differentiating yeast strains of Saccharomyces cerevisiae. Consumer demand is pushing the need to produce different and novel wine styles with particular characteristics. Changes in the yeast genome can influence potential flavor metabolites. Classification results showed the potential for using NIR spectroscopy as a screening tool for discriminating between yeast strains as well as grouping strains with deletions in genes that disturb different metabolic pathways. Two comprehensive review papers of applications investigated by the Australian Wine Research Institute (AWRI) discussed a number of studies documenting grape, wine, yeast, and leaf analysis. The primary focus was on total anthocyanins (expressed as color), which coupled with the traditional analyses of total soluble solids (expressed as °Brix) and pH could provide a new method for grape quality assessment and vineyard management. Other applications discussed in these two papers are fungal diseases in grapes, phenolic compounds in red wine fermentation, wine quality grading, grape spirit distillation, variety identification and product authenticity, and vine tissue analysis. Another paper from Australia documented measuring condensed tannins (CT) and dry matter (DM) in red grape homogenates. Tannins are important phenolic compounds for sensory properties but the standardized tests are expensive and unable to be performed on a large scale for vineyards. Dry matter measurement helps optimize harvest data and can potentially maximize juice extraction. Volatile organic compounds such as esters, higher alcohols, and fatty acids are created during fermentation from complex microbial and biochemical reactions. These compounds contribute to a wide range of physiochemical properties in wine and can only be measured at the present time by complex and expensive methods such as GC-MS. Two different studies examined the feasibility of measuring these compounds using NIR spectroscopy; one using apple wines in China and one using white wine of the Vinhos Verdes appellation in Portugal. Both studies showed good correlation and demonstrated the potential for replacing traditional methods for measuring volatile compounds in wine using NIR spectroscopy. One study compared using NIR and MIR spectroscopy for various carbohydrate concentrations, fermentation products, and phenolic compounds during red wine fermentation. Both methods showed superb results and proved the feasibility of monitoring fermentation using spectroscopic methods. Volumic Mass/Density is the most important compound to measure in white wine fermentation and this was examined using a miniature Vis/NIR spectrometer with good correlation. Calcium must be kept below a certain level in sparkling wines and NIR spectroscopy was examined as a method for this measurement in both white grape must and wine. Feasibility was demonstrated and the potential exists to use NIR spectroscopy for this measurement instead of current expensive and time-consuming reference methods.
Scientific References and Statistics
Combining Near-Infrared Spectroscopy and Multivariate Analysis as a Tool to Differentiate Different Strains of Saccharomyces cerevisiae: a metabolomic study – Cozzolino, Flood, Bellon, et al., Wiley Science, Yeast 2006: 23: 1089-1096
The purpose of this study was to examine the metabolic profiles produced by Saccharomyces cerevisiae deletion strains sourced from the Euroscarf yeast collection using NIR spectroscopy. Eight separate strains were used, each with a different gene deletion. Samples were scanned in transmission mode after centrifuging in a 1 mm cuvette. Wavelength range was from 400 nm to 2500 nm. Replicate experiments were carried out multiple times over three months. Spectra were exported for post-processing and chemometric analysis. Principle Component Analysis (PCA) was performed to visualize any significant grouping amongst the samples. ANOVA analysis showed that there were some spectral differences within the same group in the separate sample sets scanned over the three month period. The experiment did use some strains that possess mutations in the same or closely related pathways and replicate samples were derived from different starter cultures. This was done in an attempt to ensure the classification results reflected the mutation and not batch-to-batch variation. Linear Discriminant Analysis showed acceptable classification results and two strains were classified with 100% accuracy. The potential of chemometrics and NIR spectroscopy to discriminate between yeast strains and grouping strains with deletions in genes that disturb similar metabolic pathways was demonstrated. These methods may be useful in defining the functions of genes that have no obvious genotype. Using NIR spectroscopy as a high-throughput tool for yeast selection could accelerate progress in genome-based wine yeast research and allow the selection of strains for more detailed biochemical analysis.
https://onlinelibrary.wiley.com/doi/full/10.1002/yea.1418
Grape and Wine Analysis – Enhancing the Power of Spectroscopy with Chemometrics. A Review of Some Applications in the Australian Wine Industry – Gishen, Dambergs, Cozzolino, Australian Journal of Grape and Wine Research, 11, 296-305, 2005
Analysis of Grapes and Wine by Near-Infrared Spectroscopy – Cozzolino, Dambergs, Janik, et al., Journal of Near Infrared Spectroscopy, 14, 279-289, 2006
These papers summarized investigations of applications by the Australian Wine Research Institute (AWRI) for measuring parameters in grapes, wine, yeast, and vine tissues using NIR spectroscopy. The primary focus has been on rapid analysis of red grapes for color (expressed as total anthocyanins), total soluble solids (expressed as °Brix), and pH. Grape color is a strong indicator of red wine quality and rapid NIR analysis shows great promise to replace traditional methods for color and quality assessment. Other research and applications discussed are fungal diseases in grapes, phenolic compounds during fermentation, quality grading, monitoring grape spirit distillation, variety identification and product authenticity, and vine tissue analysis.
Color
Approximately two thousand three hundred homogenized red grape samples incorporating three vintages, ten regions, and ten grape varieties were scanned using a research-grade NIR spectrometer. PLS calibration models were created using the spectral data and reference values for color. A PLS model incorporating all samples showed good results but the analysis showed non-linearity in the model. Non-linearity can be corrected using local algorithms that match similar spectra in the calibrations. This frequently occurs when using large data sets. Individual models for different groups can work as well but this approach may create data sets with too few data points for a good calibration.
| Partial Least Squares (PLS) Calibration Model for Color | R² = 0.90 | RMSEP= 0.14 mg/g |
| Local Weighted Regression Algorithm for Color | R² = 0.96 | RMSEP= 0.09 mg/g |
Calibration results were good and improved using the local weighted regression algorithm in the model. Measuring color along with already proven measurable analytes using NIR spectroscopy such as pH, °Brix, reducing sugars and lactic acid could prove to be a valuable tool for vineyard management and optimization of harvest time.
Fungal Diseases in Grapes
Mold contamination in harvested grapes can be difficult to assess visually. NIR spectroscopy was explored to detect powdery mildew in Chardonnay grapes. Samples were first visually classified for mildew contamination, homogenized, and scanned in reflectance mode using a NIR spectrometer from 400 nm to 2500 nm. The homogenates were analyzed for powdery mildew DNA content and the analysis matched well with the visual classification. Strong spectral differences were observed correlating to contamination level and it was confirmed that these differences were not related to pH and °Brix, eliminating the possibility that any classification analysis could be based on these parameters and not mildew contamination. Classification discriminant analysis was able to accurately classify 92% of the samples based on infection level. A PLS regression model could sufficiently discriminate between no infection and the lowest infection level samples (1% to 10%). While results were good, it must be noted that this was a small data set and more work is necessary to confirm the feasibility of detecting mildew in grapes in a real-time setting.
| Malvidin-3-Glucoside | R² = 0.91 | RMSEP= 28.0 mg/L |
| Pigmented Polymers | R² = 0.87 | RMSEP= 5.9 mg/L |
| Tannins | R² =0.83 | RMSEP = 131.1 mg/L |
Modeling results showed good correlation between the NIR spectra and the major anthocyanins. Visual analysis of the spectral data showed similar changes occur in both Cabernet Sauvignon and Shiraz during the fermentation itself and maturation after fermentation. Many simultaneous changes occur during fermentation and more work is necessary to define the specificity of the calibrations, but the results here do offer a possibility for real-time monitoring of phenolic compounds during red wine fermentation.
Wine Quality Grading
Wine quality in terms of sensory characteristics is often a subjective measure that can be biased by individual preferences and day-to-day variation. An objective quality measurement system would be useful and NIR spectroscopy was examined for this purpose. While many flavor compounds are below the detection level for NIR analysis, some of the more abundant organic compounds do affect quality and provide a basis for examining the feasibility of this measurement. Samples of Cabernet Sauvignon were scanned from 400 nm to 2500 nm and the reference quality scores were segmented from 1 to 5 with 1 being the lowest quality score.
| Quality Score | R² = 0.76 | RMSEP= 0.6 |
Acceptable results were achieved, especially when considering that the theoretical minimum error was 0.5 as all reference values were whole numbers and the calibration can predict fractions that have to be rounded off. It must be noted that calibration models were created for both the full wavelength range and from 400 nm to 700 nm which showed similar results. The smaller and lower range is an absorbing area of the spectrum for anthocyanins and polymerized pigments, two notable parameters in wine quality. This supports the validity of the calibration model and shows the correlation is corresponding to parameters affecting wine quality.
Grape Spirit Distillation
Grape spirit is produced by distillation of wine or wine and grape process waste and is used to make fortified wine. Methanol concentration can be high due to the presence of mold or bacteria in the raw product. In order to operate continuous stills, rapid feedback of methanol concentration is necessary for fine-tuning. Samples of wine were scanned in transmission mode and GC was used as the reference method to determine methanol and ethanol concentration.
| Methanol | R² =0.99 | RMSEP= 0.06 g/L |
| Ethanol | R² =0.96 | RMSEP=0.08 % v/v |
Correlation coefficients for both methanol and ethanol were high and comparable to the error in the reference method, proving the validity of the calibration models. The results here show the possibility of real-time grape spirit distillation monitoring using NIR spectroscopy.
Variety Identification and Product Authenticity
Few studies have been conducted for identifying wine adulteration using NIR spectroscopy. However, there have been studies for classifying grape and wine varieties. One study was able to classify Merlot, Tempranillo, and Grenache red grape varieties grown in Spain with 100% discrimination. Similar results were achieved with two white grape varieties – Viura and Chardonnay. Australian Riesling and Chardonnay white wine varieties were classified with 95% accuracy. The results here show potential for adulterant identification as well as blend analysis for grapes and wine.
Vine Tissue Analysis
Work has been conducted to analyze nutrients in grape petioles using NIR spectroscopy. Petioles are the stalks that attach a leaf blade to the stem. Samples were dried and ground before scanning. Reference tests were conducted for nitrogen, potassium, and phosphorus.
| Nitrogen | R² =0.997 |
| Potassium | R² =0.99 |
| Phosphorus | R² =0.996 |
The results here show promise for using NIR spectroscopy as a tool for vineyard management and soil nutrient analysis. However, the sample set was limited and there were not enough samples to carry out a validation analysis. More work will be necessary to fully validate the results shown here:
https://onlinelibrary.wiley.com/doi/abs/10.1111/j.1755-0238.2005.tb00029.x
https://journals.sagepub.com/doi/abs/10.1255/jnirs.679?journalCode=jnsa
Measurement of Condensed Tannins and Dry Matter in Red Grape Homogenates Using Near-Infrared Spectroscopy – Cozzolino, Cynkar, Dambergs, et al., Journal of Agricultural and Food Chemistry, 2008, 56, 7631-7636
Condensed Tannins (CT) and Dry Matter (DM) are two very important parameters in wine grapes. Tannins are one type of phenolic compound that contributes to sensory properties like color, flavor, and bitterness. There is a standardized test for tannins known as the methylcellulose precipitable (MCP) tannin assay, but it is time-consuming and expensive to implement. DM has a direct effect on the stability and quality of all foods. A direct measurement of DM would help optimize harvest date and maximize the potential extraction of juice. Six hundred twenty samples of red grape cultivars were procured for this study covering four grape types, four harvests, and eight different growing regions. Samples were collected as whole berries and stored frozen for up to six months before analysis. Thawed samples were homogenized and scanned from 400 nm to 2500 nm in reflectance mode at 2 nm intervals. Thirty-two scans were collected for each sample and averaged into one spectrum. Reference tests for CT and DM were performed after the samples were homogenized.
| Condensed Tannins (CT) | R² =0.86 | RMSEP= 0.46 mg/g Epicatechin Equivalents |
| Dry Matter (DM) | R² = 0.92 | RMSEP= 0.83% w/w |
Calibration models for CT and DM showed good correlation and the validity of the models was verified by validation data sets. Analysis of the wavelengths used to build the calibration models showed the models built correlation from absorbing areas of the parameters of interest. This study proved that CT and DM can be measured using NIR spectroscopy, offering a suitable and efficient tool for measuring these parameters in homogenized grape samples in addition to parameters that have been proven in other studies, such as total anthocyanins (color), °Brix, and pH.
https://www.ncbi.nlm.nih.gov/pubmed/18707119
Rapid Detection of Volatile Compounds in Apple Wines Using FT-NIR Spectroscopy – Ye, Gao, Li, et al., Food Chemistry 190 (2016) 701-708
Volatile organic compounds found in apple wines are created during fermentation from complex microbial and biochemical reactions. Esters, higher alcohols, and fatty acids are of particular interest and contribute to a wide range of distinct physiochemical properties, such as volatilities, polarity, boiling points, and sensory threshold. Analysis of these compounds is typically performed using GC-MS which is expensive, time-consuming, and requires highly skilled technicians. Seventy-two apple wine samples were procured to test the feasibility of measuring volatile compounds using FT-NIR spectroscopy. All samples were made in the laboratory using micro-fermentation trials. GC-MS was used as the reference method for the samples. Samples were scanned in transmission mode from 12000 cm-1 to 4000 cm-1 using a quartz cuvette with 1 mm pathlength. Fifty-two samples were used to build calibration models and the remaining twenty were used for a validation set.
| Esters: | |||
| 7 Total | |||
| Highest: | Ethyl Acetate | R2=0.9450 | RMSEP = 37.50 mg/L |
| Lowest: | Ethyl Caprylate | R2=0.8967 | RMSEP = 0.120 mg/L |
| Higher Alcohols | |||
| 5 Total | |||
| Highest: | Hexanol | R2=0.9497 | RMSEP = 0.153 mg/L |
| Lowest: | 3,4,5-Trimethyl-4-Heptanol | R2=0.8844 | RMSEP = 0.181 mg/L |
| Fatty Acids | |||
| 3 Total | |||
| Highest: | Hexanoic Acid | R2=0.9179 | RMSEP = 0.746 mg/L |
| Lowest: | Decanoic Acid | R2=0.9007 | RMSEP = 0.409 mg/L |
A large number of volatile compounds were detected from the GC-MS analysis and those chosen for the calibration models were present in most of the samples. Various data pre-treatments and selective wavelength ranges were checked to optimize the results. Wavelengths corresponding to the first overtone and the stretch vibration for C-H, O-H, and C=O were used for many of the calibrations. This study indicates that NIR spectroscopy can be used to determine volatile compounds in apple wine and results from the NIR technique were comparable to the GC-MS reference method. However, it must be noted that the concentration of the measured volatile compounds is very small. While promising, further work will be needed to prove that the calibration models are correlating to the parameters of interest and not some indirect correlation that appears to measure the volatile compounds concentration. Further investigation would also be necessary to determine the feasibility of measuring volatile compounds that were not detected in this study.
https://www.ncbi.nlm.nih.gov/pubmed/26213028
New PLS Analysis Approach to Wine Volatile Compounds Characterization by Near Infrared Spectroscopy – Genisheva, Quintelas, Mesquita, et al., Food Chemistry 246 (2018) 172-178
The aim of this study was to examine the potential of NIR spectroscopy for measuring ten of the most relevant volatile compounds in Portuguese Vinhos Verdes white wine. The normal method for measuring these compounds is using gas chromatography coupled to at least one detector, such as a flame ionization detector or mass spectrometer. These methods are time-consuming, expensive, and require skilled technicians to operate. Seven white wine grape varieties comprising one hundred five samples were used for the study, all designated “Appelation of Origin Vinhos Verdes” that are produced in Northern Portugal. Vinification was performed on the grapes according to the traditional technology of the wine designation. Reference tests were performed using GC and different detector methods. Wine samples were scanned in transmittance mode from 14000 cm-1 to 600 cm-1 using a flow cell with 0.7 mm pathlength at 8 cm-1 resolution. Thirty-two scans were collected per sample and averaged into one spectrum.
Volatile Compounds Analyzed:
- Ethyl Acetate
- Methanol
- 2-Methyl-1-Butanol
- 3-Methyl-1-Butanol
- 2-Phenylethanol
- 3-Methylbutyl Acetate
- Ethyl Lactate
- Ethyl Octanoate
- Diethyl Succinate
- Diethyl Malate
- All R2 Correlation Coefficients ranged from 0.94 – 0.97
After all samples were scanned and the reference methods performed, boxplot and Principle Component Analysis (PCA) were performed for cluster identification and outlier analysis. A selective wavelength range from 6357 cm-1 to 5435 cm-1 was used for all Partial Least Squares (PLS) calibration models. An iterative approach was used for PLS models using the cluster identification to reduce the dataset and then correlate the spectral data in the wavelength range of interest to construct the calibrations. The predictive capability of the models was shown by an independent validation set. As was the case with the apple wine study, further work will be needed to prove that the calibration models are correlating to the parameters of interest and not some indirect correlation that appears to measure the volatile compounds concentration. It can be stated that the results are promising enough to warrant further work to fully demonstrate the potential to replace traditional expensive and time-consuming methods for these measurements.
https://www.sciencedirect.com/science/article/pii/S0308814617318162
NIR and MIR Spectroscopy as Rapid Methods to Monitor Red Wine Fermentation – Di Egidio, Sinelli, Giovanelli, et al., Eur Food Res Technology (2010) 230: 947-955
Fifteen micro-fermentation trials were conducted during a single vintage harvest in the Valtellina region of Northern Italy for the purpose of analyzing parameters in wine fermentation using both NIR and MIR spectroscopy. Sampling was conducted at five subsequent times during each fermentation trial from initial crushing of the grapes until approximately thirty days after fermentation began for a total of seventy-five samples. NIR transmission spectra were collected from 12500 cm-1 to 3600 cm-1 for each sample with a 1 mm pathlength flow cell using 8 cm-1 spectral resolution. Sixteen scans were collected and averaged for each spectrum. MIR spectra were collected for each sample on an ATR crystal background from 4000 cm-1 to 700 cm-1 using 16 cm-1 spectral resolution and thirty-two scans per average. Standard chemical methods were used to obtain reference values for sugars (glucose and fructose), alcohols (ethanol and glycerol), and phenolic compounds (total phenolics, total anthocyanins, and total flavonoids). Both sets of spectral data were transformed using different pretreatments. Classification analysis was performed using algorithms to determine the feasibility of separating samples based on fermentation stage, divided into four steps for the purpose of the analysis. Partial Least Squares (PLS) regression models were created correlating the reference values of the parameters of interest to the spectral data.
Linear Discriminant Analysis (LDA) for NIR Data:
Correct Classification of Fermentation Stages 1-4: 91.1%
| Glucose | R² =0.99 | RMSEP=1.11 g/L |
| Fructose | R² =0.99 | RMSEP=4.68 g/L |
| Ethanol | R² = 0.99 | RMSEP=1.96 g/L |
| Glycerol | R² =0.99 | RMSEP=0.41 g/L |
| Total Phenolics | R² =0.99 | RMSEP=217 mg/L |
| Total Anthocyanins | R² =0.97 | RMSEP=17.7 mg/L |
| Total Flavonoids | R² =0.97 | RMSEP=213 mg/L |
Results were excellent for both classification and regression analysis. MIR data showed very similar results and those results are not shown here, but the feasibility of measuring these parameters from the spectral data for both sets was proved. In the case of LDA analysis, the NIR spectra showed a 100% correct classification for the beginning Stage 1 and ending Stage 4 of fermentation, indicating that the spectra can be used to determine when fermentation is complete. The PLS calibration models created here could be used to monitor fermentation in an on-line, real-time setting for carbohydrate concentrations, fermentation products, and phenolic compounds. It must be noted that the concentration for total anthocyanins is very small and it is likely that the calibration model is not measuring such a low concentration directly. However, anthocyanins are directly related to color and it has been proven in numerous studies that absorption at a visible wavelength can be correlated to NIR spectra. An indirect correlation is acceptable for NIR spectra calibration modeling but the analysis needs to be carefully examined and validated. Such analysis is time-consuming and expensive using traditional methods, especially in an on-line setting. NIR spectroscopy can be used as a quality tool to optimize fermentation in red wine and assure product quality at all stages of the process.
https://link.springer.com/article/10.1007%2Fs00217-010-1227-5
Feasibility of Using a Miniature NIR Spectrometer to Measure Volumic Mass During Alcoholic Fermentation – Fernandez-Novales, Lopez, Gonzalez-Caballero, International Journal of Food Sciences and Nutrition, June 2011 62(4): 353-359
There is one major difference in grape preparation for white and red wine fermentation. For white wine, the “must” obtained by crushing and pressing grapes is sent for fermentation, which includes the skins, seeds, and stems of the fruit. In contrast, red wine grapes are first destalked and fermentation takes place with maceration of skins and seeds. A consequence of this is that the most important component to monitor during white wine fermentation is must volumic mass (density). A miniature NIR spectrometer was procured to measure must samples of wine grapes for volumic mass. One hundred twenty-four samples were used comprising six different varieties of white wine grapes and six different varieties of red wine grapes collected during fermentation trials over three consecutive harvests. The white grapes were combined and placed into fermentation tanks and the same was done for the red grapes. Samples were taken at random during the fermentation process: sixty-six for the white grapes and fifty-eight for the red grapes. The traditional reference method aerometry was used to determine volumic mass values. Each sample was scanned for NIR spectra from 200 nm to 1100 nm at 0.5 nm intervals averaging three hundred scans per spectrum.
| Volumic Mass | R² =0.96 | RMSEP=5.85 g/dm3 |
| Wavelength Range | 800 nm to 1050 nm |
Different spectral pre-treatments and selective wavelength ranges were applied as well as two modeling algorithms. The best results used the wavelength range from 800 nm to 1050 nm and the Partial Least Squares algorithm. The results were especially good considering the different grape varieties and the model combined both the white and red grape data. Monitoring volumic mass during fermentation in real-time using NIR spectroscopy can avoid stuck fermentation and potential refermentation, both of which can lead to quality deficiencies in both physical and chemical characteristics in the final product of wine.
https://www.tandfonline.com/doi/full/10.3109/09637486.2010.533161
Rapid Detection of Three Quality Parameters and Classification of Wine Based on Vis-NIR Spectroscopy with Wavelength Selection by ACO and CARS Algorithms – Hu, Yin, Ma, Liu, Spectrochimica Acta Part A: Molecular and Biomolecular Spectroscopy 205 (2018) 574-581
This study evaluated the feasibility of using a Vis-NIR spectrometer for classifying wine samples based on geographical origin and analyzing three constituents in wine: total acidity, total sugars, and alcohol. Ninety-one samples of wine were procured from local markets comprising seven different brands. Wines were stored at constant temperature before analysis. Spectra were collected at 2 nm intervals from 400 nm to 2500 nm using a 1 mm quartz sampling cell. Standard methods were used to obtain reference values for total acidity, total sugars, and alcohol. Principle Component Analysis (PCA) was performed for classification analysis. Partial Least Squares (PLS) regression models were created to correlate the spectral data to reference values using the full wavelength range as well as two algorithms for selective wavelength analysis: CARS (Competitive Adaptive Reweighted Sampling Method) and ACO (Ant Colony Optimization).
| PLS-Full: | ||
| Total Acidity: | R2=0.941 | RMSEP =.00175 mol/l |
| Total Sugars: | R2=0.990 | RMSEP =0.157 g/l |
| Alcohol by Volume | R2=0.911 | RMSEP =0.242 v/v |
| PLS-CARS | ||
| Total Acidity: | R2=0.972 | RMSEP =0.00116 mol/l |
| Total Sugars: | R2=0.996 | RMSEP =0.102 g/l |
| Alcohol by Volume | R2=0.939 | RMSEP =0.200 v/v |
| PLS-ACO | ||
| Total Acidity: | R2=0.987 | RMSEP =0.00108 mol/l |
| Total Sugars: | R2=0.999 | RMSEP =0.0827 g/l |
| Alcohol by Volume | R2=0.942 | RMSEP =0.187 v/v |
PCA analysis showed that most of the wines used in the study could be classified based on geographical origin. Some of the wines were very similar in acidity, sugars, and alcohol and it is likely that more detailed classification methods could separate these samples as well. PLS modeling results were excellent and the PLS-ACO method showed the best results. The ACO algorithm selected eighty-six specific wavelengths for the PLS models. The results here show promise for using Vis-NIR spectra with calibration models created using reference data and selective wavelength algorithms as a tool for classifying wine and performing quality assessment during wine fermentation and other production processes.
https://www.sciencedirect.com/science/article/pii/S138614251830708X
Predicting Calcium in Grape Must and Base Wine by FT-NIR Spectroscopy – Vestia, Barroso, Ferreira, et al., Food Chemistry 276 (2019) 71-76
Calcium content in sparkling wines cannot exceed 80 mg/L due to the risk of aggregation with alginate capsules. It can be abundant in the grape itself as well derived from contamination in soil. The concentration of calcium as well as other minerals is affected by maturity, variety, soil type, and climate during grape growth. The current reference method for determining calcium content in wine is atomic absorption spectrophotometry (AAS), which is time-consuming, expensive, and requires complex operations and skilled technicians to implement. NIR spectroscopy was examined as a method for predicting calcium content in both grape must and wine. Calcium is a common element for NIR spectroscopic methods due to the high content in plants and its interaction with some food quality parameters. Ninety-eight white wine samples and sixty grape must samples were procured for the study. NIR spectra were collected using an from 1100 nm to 2300 nm at 1 nm wavelength intervals and two hundred fifty scans per average. A probe with 2 mm pathlength was used to collect the spectra. Calcium was determined using the AAS method and various data treatments were performed on the spectral data before creating Partial Least Squares calibration models correlating calcium to the spectra.
Grape Must:
| Calcium | R² =0.935 | RMSEP=6.960 mg/L |
Wine:
| Calcium | R² =0.956 | RMSEP=3.311 mg/L |
Correlation was good between the spectral data and calcium reference method and predictions using an external validation set proved the feasibility of the models. This validation set compromised ten samples from the following year’s vintage at the winery where the study was performed. These models could be used for a rapid and reliable technique for quantifying calcium from NIR spectra. One potential quality control improvement from such a method would be to separate grapes and must according to calcium content in order to prevent putting a large amount of high calcium grapes into one fermentation vat.
https://www.sciencedirect.com/science/article/pii/S030881461831687X
The post Wine Analysis appeared first on NIR-For-Food.
]]>The post Beer Analysis appeared first on NIR-For-Food.
]]>Introduction
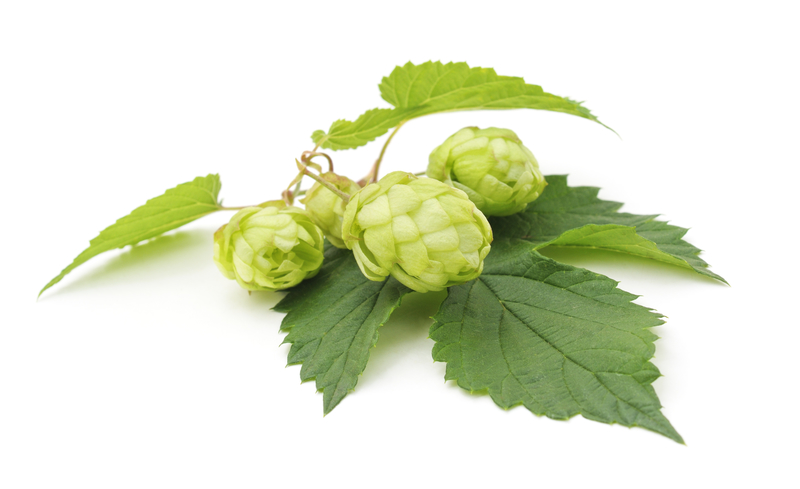
Beer is the world’s most widely consumed alcoholic beverage. Four raw materials are required for beer production: barley, hops, water, and yeast. The beer market has become especially competitive in recent years with the advent of microbreweries, which market their products based on unique recipes, quality, and distinction from the large-scale breweries. The quality of the raw materials has a significant impact on the final product. Before the brewing process begins, characterization of barley, as well as yeast and hops, can help the brewer optimize the process. Process control feedback during brewing, particularly during the malting and fermentation stages, are critical and fundamental for brewing high-quality beer. Feedback on moisture and nitrogen in barley, germination parameters, sugars during mashing, and alcohol and original gravity during fermentation can help the brewer optimize the process as well as reduce costs and resources for brewing. Moisture and total nitrogen content in barley are critical parameters. Slack malt is defined as too high in moisture content. It can lose aroma in storage and not break up properly during milling. High total nitrogen decreases carbohydrate content and yields a lower extract. The reactions that occur during germination are complex and it is especially important to monitor moisture during this phase because it has a strong effect on the reactions. Sugars formed from starch during mashing can be monitored to optimize yield and minimize cost. Fermentation monitoring for alcohol content, original gravity, and original extract can be used to optimize protocols such as changing enzymes, process parameters, and nutritional supplements. Currently, methods for testing these parameters such as HPLC are expensive, laborious, and time-consuming, especially when implemented in a process setting. There is a need for fast, cost-effective, and real-time monitoring of parameters at all stages of the brewing process. One such method that has been examined is NIR spectroscopy.
Analytes
Barley
- Moisture
- Total Nitrogen Content
- Total Lipid Content
- Protein
- Mycotoxins
Hops
- α-Acids
- β-Acids
- Hop Storage Index (HSI)
Yeast
- Protein
- Trehalose
- Glycogen
Malting
- Moisture
- Extract
- Nitrogen
Mashing
- Total Carbohydrates (TC)
- Fermentable Sugars (FS)
- Maltose
- Glucose
- Maltotriose
- Total Soluble Nitrogen (TSN)
- Free-Amino Nitrogen (FAN)
- Hot Water Extract (HWE)
- Soluble Protein
Fermentation
- Alcohol
- Original Extract
- Real Extract
- Biomass
- Soluble Solids Content (SSC expressed as °Brix and °Plato)
- pH
- Maximum Volume of Foam (MaxVol)
Summary of Published Papers, Articles, and Reference Materials
Measurement of chemical parameters in all significant constituents of beer for quality control purposes has been studied using NIR spectroscopy under both at-line and online conditions. The results of most studies have been promising. A comprehensive review of multiple studies is presented measuring parameters of interest from initial raw material analysis all the way to final fermentation as well as discussion about the benefits of using these parameters in a real-time setting to optimize beer production. The analysis includes barley, hops, yeast, malting, mashing, and fermentation. One individual study of raw materials analyzed grain and maize for moisture, total nitrogen content, and total lipid content. Results were excellent for moisture and suitable for screening purposes for nitrogen and lipids, with likely improvement to occur if the samples were ground. Three studies analyzed beer fermentation for various sugar, acidity, alcohol, and foam analyses. The first was specific to beer wort and geared toward process analysis with excellent correlation achieved for °Brix, pH, and Biomass. The second study used two different types of algorithms to correlate different types of beer under different fermentation conditions to °Brix, pH, Alcohol, and MaxVol (a foam measurement) with good results obtained after model optimization. The third study was specific for craft beer and used three different types of craft beer to analyze Soluble Solids Content (SSC expressed as °Plato and pH. The spectral analysis was able to distinguish between filtered and non-filtered samples while creating calibrations suitable for screening purposes for each type of beer.
Scientific References and Statistics
Near-Infrared Spectroscopy in the Brewing Industry – Sileoni, Marconi, Perretti, Critical Reviews in Food, Science, and Nutrition, 55:12, 1771-1791, 2015
A comprehensive and exhaustive review of NIR spectroscopy in the brewing industry. Multiple works are reviewed for using NIR spectroscopy for quality control testing of raw materials, intermediates, and finished products, as well as process monitoring during malting and fermentation. All major constituents in beer are discussed (barley, hops, yeast, malt, water) as well as the benefits of measuring them when optimizing the brewing process. Listed below are some of the constituents measured and discussed in the review. Correlation coefficients are given when shown.
Barley

Principal quality parameters for barley include moisture, protein, starch, and nitrogen which is indicative of protein content. Protein-rich barley is more difficult to process and often results in a higher malting loss. It has effects on foam retention and negative haze effects can be observed when as little as one-third of the protein passes into the beer. The normal commercial requirement is a maximum of 11.5% protein in dry barley matter. The moisture content of barley can vary from 12% to 20% depending on harvesting conditions and it must be below 15% for long-term storage. If not dried, high moisture barley can lose its ability to germinate properly as well as be at risk for mold and fungal contamination. The Analysis Committee of the European Brewery Convention (EBC) recommended the use of NIR for determining moisture and nitrogen in 2006. Studies using NIR spectroscopy for mycotoxin analysis have also been conducted and the potential was demonstrated for using NIR to measure contamination levels of various mycotoxins in barley. While promising, it must be noted that these mycotoxins were detected in very low concentrations and more validation work will be necessary to prove the feasibility of accurately measuring these constituents while ensuring that the calibration models fit the mycotoxin concentration of interest and not some other parameter. Many methods have also been developed for other quality parameters, such as hardness and β-Glucan. Extract yield, wort viscosity, and malt quality can all be directly correlated to β-Glucan in barley. Some work has also been conducted on genotype classification, which can have a substantial effect on changes during germination and malt production.
Barley Parameters
| Nitrogen | R² = 0.995 | RMSEP = 0.66% |
| Moisture | R² = 0.999 | RMSEP = 0.389% |
| Protein | R² = 0.97 | RMSEP = 0.31% |
| Glucosamine (Mold) | R² = 0.92 | RMSEP = 0.22 g/kg |
| Mycelial Dry Matter | R² = 0.94 | RMSEP = 5.25 g/kg |
| Deoxynivalenol | R² = 0.933 | RMSEP = 3.007 ppm |
| Aflatoxin B1 | R² = 0.94 | RMSEP = 0.183 ppb |
| Malt Extract | R² = 0.94 | RMSEP = 2.29% |
| β-Glucan | R² = 0.88 | RMSEP = 0.315% |
| Hardness (PSI) | R² = 0.83 | RMSEP = 0.9 PSI |
Hops
The relative concentration of hops constituents depends on the hop variety and maturation stage at the time of harvest. For the grower, maximum dry matter content at harvest results in higher yield, but this does not necessarily result in hops with optimal brewing quality characteristics. Although limited in scope, studies have been conducted to measure α-Acids, β-Acids, and Hop Storage Index (HSI) in hops using NIR spectroscopy. The acid compounds are precursors to bittering agents and HPLC is the traditional method for analyzing these. HSI is the estimated alpha acid potential loss when hops are stored at room temperature for six months. Spectroscopic UV wavelength absorptions typically measure this at 325 nm (hop acids) and around 275 nm (degenerative compounds associated with oxidation). These studies demonstrated the ability to use NIR spectroscopy to measure these parameters in hops.
Hops Parameters
| α-Acids | R²= 0.97 | RMSEP=0.22% |
| β-Acids | R²= 0.99 | RMSEP=0.20% |
| Hop Storage Index (HSI) | R²= 0.89 | RMSEP=0.010% |
Yeast

Glycogen and trehalose are both major storage carbohydrates in yeast. Yeast protein content is also an important physiological parameter and is used to determine the price of spent brewery yeast by-product. Studies have been conducted measuring these parameters using NIR spectroscopy with acceptable results. In the case of trehalose, results were much better using slurry for the constituent and this would be the preferred measurement in an online setting.
Yeast Parameters
| Glycogen | R²=0.72 | RMSEP=2.59% |
| Trehalose (Dried) | R²=0.77 | Not Given |
| Trehalose (Slurry) | R²=0.997 | Not Given |
| Protein | R²=0.97 | Not Given |
Malting

Steeping is the first step in the malting process. Sorted and cleaned barley are transferred into tanks and covered with water. During germination, barley undergoes a complex series of biochemical reactions to produce malt. Initial levels of 14% to 15% moisture in barley increase to around 42% to 44% at the end of germination. When the moisture reaches around 30%, the germination process begins by break down of the protein and carbohydrates matrices and the opening of the seed’s starch reserves. Steeping is complete when a sufficient moisture level is reached to allow uniform breakdown of the starches and protein. Monitoring the water content during germination is important for ensuring good malt modification. Studies have measured moisture on germinating barley using NIR spectroscopy with good success and high correlation. Other parameters have been studied as well for malt quality during germination with mixed results. If NIR spectroscopy could be used to monitor the germination process for malt quality, it would allow real-time adjustment of temperature and humidity parameters to accelerate or decelerate the process.
Malting Parameters
| Moisture | R²=0.92 | RMSEP=>2% |
Mashing
The main objective of the mashing process is to form maltose and other fermentable sugars from solubilized starch. Acceptable results have been achieved measuring these parameters using NIR spectroscopy. However, all these measurements were conducted on wort after sampling and most of the time, the samples were filtered and thermostated before scanning. Direct transmission measurement through mashing matter is very difficult and the filtering and temperature regulation is required. While the constituents of interest are proven to be measurable by NIR, more work will be required to validate a true industrial sensor to monitor mashing during the brewing process.
Mashing Parameters
| Moisture | R²=0.9995 | RMSEP=0.08% v/v |
| Total Carbohydrates (TC) | Not Given | RMSEP=0.5 g/L |
| Fermentable Sugars (FS) | Not Given | RMSEP=1.8 g/L |
| Maltose | Not Given | RMSEP=0.5 g/L |
| Glucose | Not Given | RMSEP=0.6 g/L |
| Maltotriose | Not Given | RMSEP=1.4 g/L |
| Total Soluble Nitrogen (TSN) | Not Given | RMSEP=48 mg/L |
| Free-Amino Nitrogen (FAN) | Not Given | RMSEP=11 mg/L |
| Hot Water Extract (HWE) | R²=0.938 | RMSEP=0.9% |
| Soluble Protein | R²=0.894 | RMSEP=0.30% |
Fermentation
Numerous studies have been conducted using NIR spectroscopy to monitor alcohol content during beer fermentation and most have shown success. Alcohol monitoring using NIR as well as related constituents like original extract and real extract have worked so well that the Analysis Committee of the European Brewery Convention (EBC) approved using NIR for determination of alcohol content in beer. The method is called Analytica-EBC 9.2.6 – Alcohol in Beer by NIRS. Beer samples are degassed so that all carbon dioxide is removed and samples are analyzed using either a scanning or filter NIR spectrometer.
Fermentation Parameters
| Ethanol | R²=0.998 | RMSEP=0.14% v/v |
| Original Extract | R²=0.998 | RMSEP=0.14% v/v |
| Real Extract | Not Given | RMSEP=0.076% v/v |
While conducted using different instruments and mostly on a laboratory scale, the studies documented in this review demonstrate the ability to use NIR spectroscopy for analysis of raw materials, intermediates, finished products, and as a process control tool in brewing, particularly during the malting and fermentation phases. Increased demand for product control of beer as well as many other liquid foods will require advanced analytical tools and NIR spectroscopy is a proven method for both online and at-line monitoring of brewing.
The development of new sensors has facilitated the implementation of NIR spectroscopy as a tool for monitoring the brewing process with successful results.
https://www.tandfonline.com/doi/full/10.1080/10408398.2012.726659
Near-Infrared Spectroscopy for Proficient Quality Evaluation of the Malt and Maize Used for Beer Production – Sileoni, Marconi, Marte, Fantozzi, Journal of the Institute of Brewing, 116 (2), 134-140, 2010
NIR Spectroscopy was used to analyze whole malt grains for moisture and total nitrogen content and maize grits for moisture and total lipid content. Total samples were two hundred ninety-five malt whole grains for moisture, two hundred eighty-one malt whole grains for total nitrogen content, one hundred twenty-eight maize grits for moisture, and one hundred two maize grits for total lipids. Different varieties were used for each sample type. An FT-NIR spectrometer collected spectra from 11500 cm-1 to 4000 cm-1 at 8 cm-1 resolution and sixty-four averaged scans per spectrum. Reference data for the parameters of interest were collected based on standard methods from the Analytica European Brewery Convention (Analytica-EBC). Various pre-processing methods and selective wavelength ranges were tested in the calibration models to optimize results.
Malt:
Moisture R2= 0.9591 RMSEP= 0.165%
Wavenumber Region = 7501.9 cm-1 to 4246.6 cm-1
Total Nitrogen Content R2= 0.7796 RMSEP= 0.048%
Wavenumber Region = 9970.4 cm-1 to 7498.1 cm-1, 6101.8 cm-1 to 4246.6 cm-1
Maize:
Moisture R2= 0.9488 RMSEP = 0.152%
Wavenumber Region = 9970.4 to 4246.6 cm-1
Total Lipid Content R2= 0.8427 RMSEP = 0.066%
Wavenumber Region = 8736.2 to 7498.1 cm-1, 6101.8 to 4246.6 cm-1
Correlation coefficients showed excellent results for moisture in both types of samples and results considered good enough for screening purposes in the case of total nitrogen content in malt and total lipid content in maize. Separate validation predictions for each model proved the feasibility of using these models for measuring the parameters of interest. It is likely that better results could be obtained for nitrogen and lipids if the samples were ground, but the results here show the potential of real-time monitoring of malt and maize used for brewing.
https://onlinelibrary.wiley.com/doi/abs/10.1002/j.2050-0416.2010.tb00409.x
Beer Fermentation: Monitoring of Process Parameters by FT-NIR and Multivariate Data Analysis – Grassi, Amigo, Lyndgaard, et al., Food Chemistry 155 (2014) 279-286
The fermentation of beer wort was monitored for nine days using FT-NIR spectroscopy for the purpose of monitoring °Brix, pH, and biomass. Two different yeast strains were used at three fermentation temperatures for the data collection and all were replicated twice using two different sampling methods (directly from the supernatant and after centrifugation for fifteen minutes at 3000 g) for a total of six different experiments. Samples were collected in triplicate right after yeast pitching and then every twenty-two hours for nine days. Standard methods were used to determine reference values for the parameters of interest. FT-NIR spectra were collected in transmission mode using a 1mm pathlength cuvette from 12000 cm-1 to 4000 cm-1 at 16 cm-1 spectral resolution. One hundred twenty-eight scans were collected and averaged for each spectrum. Principle Component Analysis (PCA), Partial Least Squares (PLS), and Locally Weighted Regression (LWR) were used to determine wavelength ranges of interest for following fermentation evolution and to correlate the NIR spectral data to reference values for °Brix, pH, and biomass.
| °Brix | R²= 0.988 | RMSEP= 0.259 |
| pH | R²= 0.987 | RMSEP= 0.112 |
| Biomass (OD @ 620nm) | R²= 0.951 | RMSEP= 0.211 |
Results obtained from the different multivariate techniques confirmed the feasibility of measuring these parameters using FT-NIR spectroscopy. PCA results confirmed that the sampling method did not matter and that it was possible to follow fermentation evolution from a chemical point of view from the spectral data. PLS results showed acceptable models for °Brix, pH, and Biomass but did suggest a possible non-linear relationship between the spectra and parameters of interest. LWR and PLS in combination confirmed the non-linear relationship but also created robust and precise models with good correlation that worked well regardless of the sampling method. The results of this study prove the feasibility of measuring °Brix, pH, and Biomass using NIR spectroscopy and show the potential to use this method for process control in online industrial brewing systems.
https://www.ncbi.nlm.nih.gov/pubmed/24594186
Assessment of Beer Quality Based on Foamability and Chemical Composition Using Computer Vision Algorithms, Near Infrared Spectroscopy, and Machine Learning Algorithms – Viejo, Fuentes, Torrico, et al., Journal of Food Science and Agriculture 2018: 98: 618-627
NIR spectroscopy was examined as a method for measuring beer quality parameters. Six replicates of twenty-one types of beer from three different types of fermentation were used for the study. Fermentation types were top, bottom, and spontaneous, which all differ in their specific process, such as yeast type, production temperature, and fermentation time. Fifteen foam and color parameters were evaluated in the samples using the RoboBEER robotic pourer, one of which (MaxVol – Maximum Volume of Foam) was used as a reference method for NIR chemometric modeling. Standard reference methods were used to determine °Brix, pH, and alcohol. All samples were scanned using a NIR handheld spectrometer from 1600 nm to 2396 nm at 7 nm to 9 nm intervals. Principle Component Analysis (PCA) was used to identify relationships between the parameters and selective wavelength ranges of interest. Both Partial Least Squares (PLS) and Artificial Neural Networks (ANN) methods were used to create chemometric models correlating the NIR spectra to the parameters of interest.
ANN Method
| MaxVol (ANN) | R²=0.93 | RMSEP=5.05mL |
| °Brix (ANN) | R²=0.91 | RMSEP=0.60 |
| pH (ANN) | R²=0.95 | RMSEP=0.21 |
| Alcohol (ANN) | R²=0.99 | RMSEP=0.01% |
| All Four Targets/Combined Output (ANN) | R²=0.97 | RMSEP=0.97 |
The ANN method proved to be more capable of fitting the target values to the spectral data than PLS and those results are shown above. ANN works using machine learning algorithms that simulate human brain processing and is typically suited to model complex linear relationships more accurately than PLS. PCA analysis identified relationships between specific NIR wavelengths and the parameters analyzed with Robobeer as well as resulting in an 85% accuracy when classifying beers according to fermentation type. The results here show promise for using NIR spectroscopy and RoboBEER as quality analysis tools in the production of beer.
https://onlinelibrary.wiley.com/doi/full/10.1002/jsfa.8506
Rapid Evaluation of Craft Beer Quality During Fermentation Process by Vis/NIR Spectroscopy – Giovenzana, Beghi, Guidetti, Journal of Food Engineering 142 (2014) 80-86
Three different types of craft beer were procured to use a portable VIS/NIR spectrometer to measure Soluble Solids Content (SSC expressed as °Plato) and pH directly on a craft beer production line. NIR transflectance spectra were collected from 450 nm to 980 nm at different stages of fermentation and were collected on both filtered and non-filtered samples. Reference values were collected for SSC and pH using standard methods. Various spectral pre-treatments were performed before Principle Component Analysis (PCA) and Partial Least Squares (PLS) regression models were created to evaluate the feasibility of measuring the parameters of interest.
Filtered SSC:
R2= 0.87-0.88 RMSEP= 1.1-1.8 °Plato
Non-Filtered SSC:
R2= 0.77-0.96 RMSEP= 0.6-2.3 °Plato
Filtered pH:
R2= 0.69-0.92 RMSEP= 0.1-0.2
Non-Filtered pH:
R2= 0.76-0.97 RMSEP= 0.06-0.2
PCA modeling showed clear discrimination in the spectra between the three different types of craft beer samples and proved that spectra of filtered and non-filtered beer were distinguishable. This could prove to be useful information for analyzing the condition of the process line. The PLS regression models showed mixed results, likely for a number of reasons. Color and turbidity conditions are different for each type of beer during fermentation, and this could affect the calibration models. Visual examination of the spectra showed different variations in noise between samples. From the limited scope of work presented here, it can be concluded that even using the worst correlated models in this study can at least provide a basis for craft beer analysis during the fermentation process. It is important to consider that craft beer manufacturers are smaller in scale than large breweries and typically only analyze for SSC and pH, making the use of a reasonably priced portable NIR analyzer a feasible method for improving fermentation conditions.
https://www.sciencedirect.com/science/article/abs/pii/S0260877414002581
References
Process Analytical Technology for the Food Industry -O’Donnell, Fagan, Cullen, et al., Springer, Food Engineering Series (2014)
Commercial References
The post Beer Analysis appeared first on NIR-For-Food.
]]>The post Spirits Overview appeared first on NIR-For-Food.
]]>Introduction
Distillery processes are well-suited for NIR analysis from the unloading of raw materials to the final bottling. The most important components in distillation are moisture, protein, oil, and starch, all suitable and proven measurable constituents using NIR spectroscopy. The moisture content of incoming grain is of critical importance. Moisture should not be above 15% in grain used for distillation because it can cause mechanical problems in the distillery hammer mill and reduces the starch content available for alcohol production. Protein content is important because it affects the composition of Distillers Dried Grains with Solubles (DDGS), a valuable by-product at the end of distillation. In general, high oil content in corn is considered disadvantageous for alcohol distillation as well as oil manufacturing because of reduced yield. Starch is the constituent with the greatest effect on overall yield because it is the source for fermentable sugars for yeast growth and subsequent alcohol production. There are many advantages to using NIR spectroscopy for these measurements in incoming grain. NIR not only provides a fast, cost-effective and non-invasive method, but it can also be used to measure multiple points in an incoming batch. The potential exists for fraud by placing low-quality corn at the bottom of a batch and high quality at the top. Checking multiple points in the batch with a spectrometer can help detect if this is the case. Other advantages include tracking production efficiencies, accumulating crop data, and having variety selection for desired characteristics of the incoming material.
Fermentation Monitoring
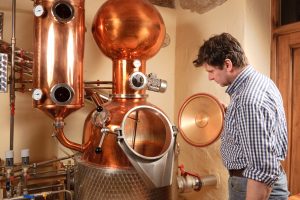 Fermentation monitoring is complex because multiple parameters affect the overall yield and final alcohol content. Most distilleries use HPLC as the method of choice for fermentation monitoring of parameters like sugars, acids, glycerol, and alcohol, all of which are interrelated during the fermentation process. While optimum efficiency can be accomplished if these parameters are kept in control, in practice this is difficult to do using HPLC. HPLC requires highly skilled technicians, expensive accessories, complex and time-consuming sample prep, and often does not produce results as accurate as required for optimum process control.
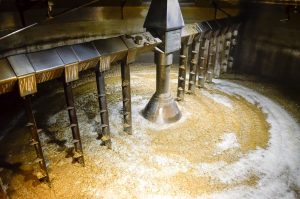 The potential improvements in fermentation that real-time monitoring using NIR spectroscopy can provide are immense. Optimization of protocols such as changing enzymes, process parameters, and nutritional supplements can increase the alcohol content per fermenter. Even a small increase in alcohol content per fermenter when a plant operates using hundreds of fermenters results in considerable savings in raw materials, steam, labor, processing fuel, maintenance, and equipment.
For example, if a two hundred thousand liter fermenter finishes the average fermentation at 9.6% alcohol, nineteen thousand two hundred liters of absolute alcohol is produced. If the process can be optimized to raise the alcohol content by 1% to 10.6%, twenty-one thousand and two hundred liters of absolute alcohol are produced. This means that a plant can have the same output of alcohol using nine hundred five fermenters instead of one thousand if the process is optimized, resulting in the potential for millions of dollars in savings per year. Studies have been conducted at a large distillery using these very methods to optimize fermentation. Fermentation time from ethanol content, sugars, and lactic acid have all been successfully monitored using NIR spectroscopy for optimization of the fermentation process. As with any food or beverage, adulteration is a big problem and NIR spectroscopy can be used as a screening tool for adulteration in alcoholic beverages.
References
Quality Analysis, Classification, and Authentication of Liquid Foods by Near-Infrared Spectroscopy: A Review of Recent Research Developments – Wang, Sun, Pu, and Cheng, Critical Reviews in Science and Nutrition, 2017, Vol. 57, No. 7, 1524-1538
https://www.tandfonline.com/doi/pdf/10.1080/10408398.2015.1115954
Livermore, Wang, and Jackson – The Alcohol Textbook, 4th Edition, Nottingham University Press, 2003, Chapter 12 – Understanding Near-Infrared Spectroscopy and its Applications in the Distillery, pp. 146-170
https://edisciplinas.usp.br/pluginfile.php/2993570/mod_resource/content/1/The_Alcohol_Textbook-%204%20Ed.pdf
Commercial Reference
The post Spirits Overview appeared first on NIR-For-Food.
]]>The post Wine Overview appeared first on NIR-For-Food.
]]>Introduction
Wine is produced by transforming sugars into alcohol during fermentation of grape must. It is composed mainly of water, ethanol, sugars, and acids but can also contain other chemical compounds that vary in concentration and can be very influential on the sensory properties of the final product. Measuring grape characteristics is a basic requirement for vineyard improvement and optimum production of desired wine styles. There is a strong need for timely information that can be used for berry maturity assessment and classifying vineyard blocks, but existing analytical methods are insufficient for the demands of production. Estimated worldwide annual grape and wine productions are over 60,000 million tons and 25,000 ML. Even simple analyses like total soluble solids (TSS expressed as °Brix) and acidity require samples to be sent to a laboratory with delayed results. More complex quality analyses, such as grape color, nitrogen, and phenolics are not even considered on a large-scale basis because of the cost and time involved. Thus, there exists a need for cost-effective and timely methods for measuring parameters in wine from grape harvesting all the way through to the final quality assessment. One such method that has been studied is NIR spectroscopy.
Parameters of Interest in Grapes
Parameters of interest in grapes include total anthocyanins (correlated to color), TSS, and pH. Grapes are traditionally harvested based on TSS concentration, mostly consisting of glucose and fructose. TSS refers to the total soluble constituents of the grape and because these are primarily sugars, °Brix is used when determining the sucrose equivalent of soluble solids in products. If these parameters can be measured in the field before harvest, it can tell the grower the optimal time for picking the berries. Anthocyanins are naturally occurring phenolic compounds and are responsible for the color in wine grapes as well as other fruits and vegetables. The color of appearance is pH dependent. Studies have been conducted to measure these parameters as well as other acidity measurements in wine grapes with success. The best results have been obtained using local data sets based on individual ranges for different vintages, regions, and grape varieties for the parameters of interest. Some work has also been done on detecting powdery mildew & mold contamination in wine grapes. Results found that while contamination was not correlated to pH or TSS, the potential exists for discriminating infected grapes using NIR spectroscopy. This would be a valuable tool at the stage before crushing grapes for fermentation.
Fermentation

Wine fermentation is a complex process where grape juice is transformed by microbial action into wine. Control of the wine fermentation process is a very important step in wine production of wine, and there is a need to accurately and rapidly control both the substrate (sugars, ethanol, phenols) and product quality. Alcohol content, pH, and SSC are of vital importance during the fermentation stage. As is the case with beer and spirits, monitoring alcohol content can be used to optimize the fermentation stage regarding yield and fermentation time, resulting in savings for the wine producer. pH is an important property that makes a major contribution to wine quality. It influences the acidity, anthocyanin formation, and maturation processing as well as potentially complicating the biochemical changes during fermentation. SSC is also important in wine quality. The sediments of SSC cause changes in taste, color, flavor, and odor during the process of fermentation and storage and is a sequential phenomenon that starts immediately after fermentation. Results from studies have proven the feasibility of measuring these parameters using NIR spectroscopy, showing the potential to replace the traditional methods of refractometry and titration during fermentation. Phenolic compounds such as tannins and anthocyanins are also important quality parameters during fermentation and in the final wine product that affect the taste, color, and mouthfeel. However, reference tests on these parameters are rarely conducted on a large scale by vineyards because of the expense involved. One study collected grape varieties over three consecutive harvests and accurately predicted the concentration of some major anthocyanins and tannins in both Cabernet Sauvignon and Shiraz wines during fermentation. Being able to measure anthocyanins and tannins using NIR spectroscopy would be an invaluable tool for vineyards.
Quality Assessment
Wine grading and quality assessment after the fermentation is an important part of the winemaking process, particularly when allocating batches of wine to styles that are determined by consumer demand. The price of grapes is often determined by the quality category of the resulting wine. One issue with the current methods for determining wine quality in terms of sensory characteristics is that they are subjective, performed by winemakers, competition judges, or tasting panelists. The potential exists for NIR spectroscopy to be used as an objective method for determining wine quality. While some flavor compounds are surely below the detection limit for NIR spectroscopy, some of the more abundant organic compounds do exist in the wine matrix to offer the potential for quality assessment in this manner. Some studies have been conducted in Australia correlating NIR spectra and sensory data. While the studies were limited in their range of samples, they did show the potential for using this method. Wine grading using NIR spectroscopy could provide a rapid screening tool to add to current quality assessment methods used by winemakers. One way this could be used is for blend allocation of large batches before sensory assessment, developing profiles for blends as NIR calibrations.
Conclusion
More research into the interpretation of spectral data may provide insight into parameters affecting wine quality and interactions that occur within the wine matrix that determine sensory properties. Other uses of NIR spectroscopy in wine analysis that have been studied include yeast identification, product authenticity, and nutrients in vine tissue, all showing potential for development as a real-time analytical tool.
References
Quality Analysis, Classification, and Authentication of Liquid Foods by Near-Infrared Spectroscopy: A Review of Recent Research Developments – Wang, Sun, Pu, and Cheng, Critical Reviews in Science and Nutrition, 2017, Vol. 57, No. 7, 1524-1538
https://www.tandfonline.com/doi/pdf/10.1080/10408398.2015.1115954
Grape and Wine Analysis – Enhancing the Power of Spectroscopy with Chemometrics. A Review of Some Applications in the Australian Wine Industry – Gishen, Dambergs, and Cozzolino, Australian Journal of Grape and Wine Research, 11, 296-305, 2005
https://www.sciencedirect.com/science/article/pii/B9781845694845500051
Analysis of Grapes and Wine by Near-Infrared Spectroscopy – Cozzolino, Cynkar, Gishen, Journal of Near Infrared Spectroscopy, 14, 279-289 (2006)
https://journals.sagepub.com/doi/abs/10.1255/jnirs.679?journalCode=jnsa
Commercial Reference
The post Wine Overview appeared first on NIR-For-Food.
]]>The post Beer Overview appeared first on NIR-For-Food.
]]>Introduction
In the beer industry, there is a need for in-line analysis of barley for physicochemical and functional properties. The principal quality parameters include protein, moisture, starch, hardness, nitrogen, and β-glucan, a measure of malting resistance.
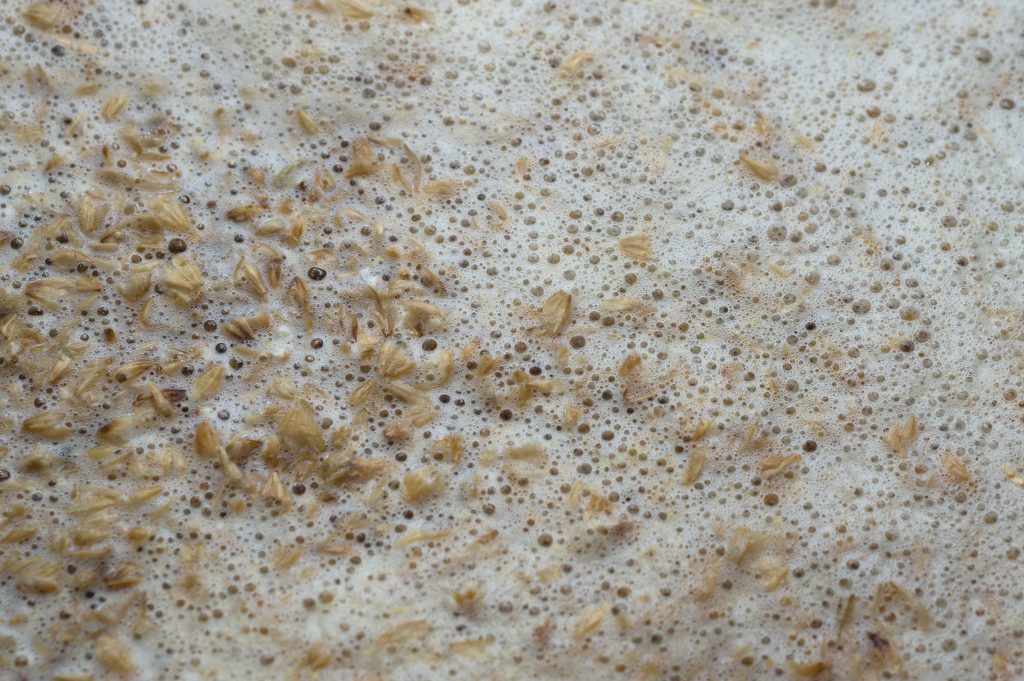
Barley with too much protein is difficult to process and can result in a higher malting loss as well as effects on foam retention and increased negative haze effects. Once the malting process is complete, the protein content should be from 10% to 11%. Nitrogen level in the grain is critical and must be in between 1.4% and 1.7%. Low nitrogen levels indicate enzyme deficiencies and can lead to problems with yeast nutrition, insufficient beer foam stability, and low enzymatic activity. High nitrogen indicates an excess of carbohydrates and results in low yields and problems with wort filterability and beer turbidity.
Starch is the component with the greatest effect on overall yield because is it the fermentable source for yeast growth and subsequent alcohol production during fermentation. Moisture content is important because of the effects on long-term storage. Harvesting conditions can vary moisture content from 12% in very dry conditions to over 20% in wet conditions. If the moisture content is greater than 15%, it must be dried before long-term storage or the barley will not germinate properly. Hardness determines the suitability of the grain for malting purposes. In general, soft grain is suitable for malting while hard grain is good for feed. High moisture also increases the risk for mold and fungi and reduces value as the dry weight is used when preparing components for brewing. During germination, barley undergoes a complex series of biochemical reactions to produce malt. β-glucans are gums that are produced during the malting process and are products of the breakdowns of the hemicellulosic cell walls. They have a strong effect on extract yield and wort viscosity.
Raw Material and Manufacturing Monitoring
There are numerous advantages to monitoring these parameters using NIR spectroscopy as opposed to traditional methods. The normal advantages of cheaper, faster, and less manpower are certainly applicable, but there are others as well. Yeast strain identification and adulterated products can be determined using NIR spectroscopy. Also, it provides an easy way to measure composite samples from all points in a delivery. Suppliers can place low quality grain at the bottom of a load and high quality at the top. A quick method like NIR spectroscopy can determine if barley is uniform throughout the entire load. Once the malting process starts, NIR spectrometers and calibration models can measure the parameters of interest during germination and assess the malt quality of the final product. Real-time feedback during germination allows the brewers to accelerate or decelerate the process by adjusting humidity and temperature parameters. The commercially acceptable limit for moisture in finished malt is 5%. This parameter is essential in calculating dry matter, which is used as a yardstick by brewers for all other quality parameters. Successful studies in measuring moisture and nitrogen using NIR spectroscopy in both whole and ground malt have been conducted.
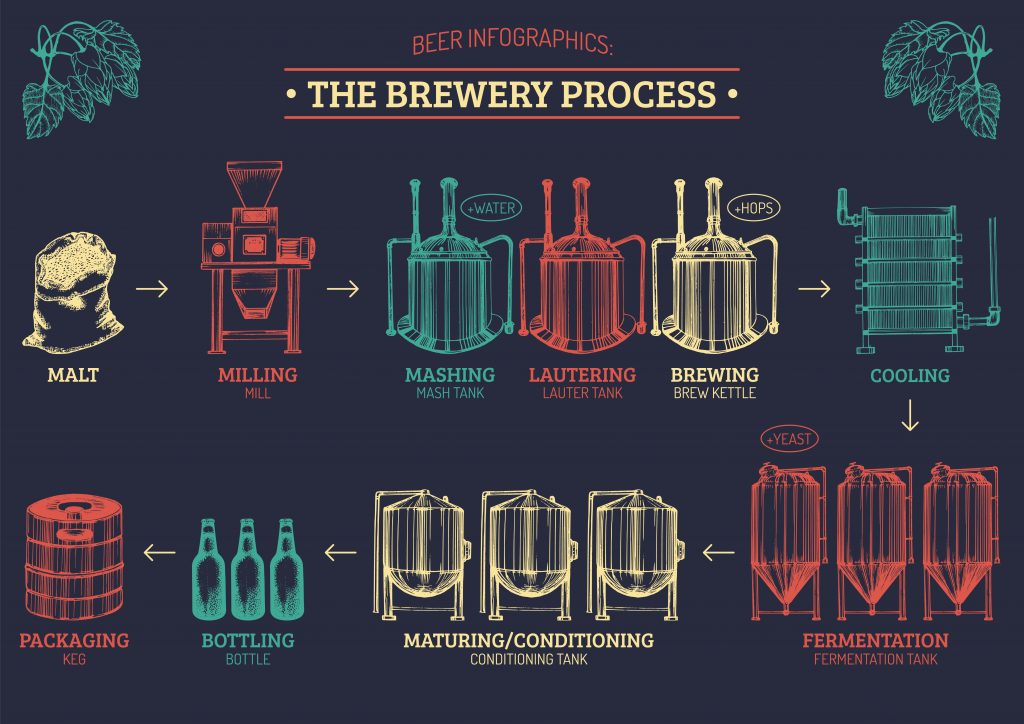
Once malt is ground through the mill, the actual brewing process begins with mashing. The main objective of the mashing process is to form maltose and other fermentable sugars from solubilized starch. Parameters tested for malting optimization include maltose, glucose, maltotriose, total carbohydrates (TC), fermentable sugars (FS), total soluble nitrogen (TSN), free-amino nitrogen (FAN), and β-glucan. Studies measuring these parameters have been performed with results acceptable enough for screening purposes and process monitoring. However, many of these studies were performed on filtered wort in transmission mode but did show that at-line monitoring of the wort is possible. Mashing matter is thick enough that a direct transmission measurement was difficult in the past, but advances in fiber optics, transflectance probes, improved mechanisms for diffuse reflectance measurements, and cleaning mechanisms have made the prospect of online mash monitoring more feasible. Some analysis and studies have been conducted on hops and yeast quality as well. For a hop grower, maximum dry matter content at harvest will generally result in higher yield but this does not necessarily result in optimal brewing characteristics. Three parameters in hops that have been studied using NIR spectroscopy are α-acid content, β-acid content, and Hop Storage Index (HSI). α-acids add bitterness to beer after being isomerized when added to boiling wort, β-acids add bitterness from oxidation during long-term storage or lagering of a beer, and HSI measures the amount of α-acid loss when hops are stored at constant room temperature for six months. Correlation between NIR spectra and these parameters was good for all three. Yeast parameters include strain identification, glycocen, trehalose (both major storage carbohydrates), and protein content. Yeast protein content is especially important in determining payment in the sale of spent brewery yeast by-product. In-process monitoring of yeast concentration during brewing has been successfully implemented as well.
Fermentation Optimization
Optimization of fermentation is a complex process because many parameters can affect the final alcohol content and overall yield. While optimum efficiency is achievable if all parameters are kept in control before and during fermentation, this does not always happen because of the time it can take to identify equipment failure. HPLC is usually the method of choice for fermentation monitoring, and while it is effective, there are many drawbacks to using it, such as the users skill level, cost, time required, accuracy, and the required centrifuging of mash samples.
All make HPLC a less than the ideal method for fermentation monitoring. In the case of beer, alcohol content, original gravity, and original extract have all been successfully correlated with NIR spectra using calibration models.
Conclusion
The potential of fermentation optimization using real-time feedback from NIR spectra cannot be understated. Fermentation information can be used to optimize protocols such as changing enzymes, process parameters, and nutritional supplements, optimizing both yield and fermentation time. This results in considerable savings in raw materials, processing fuel, labor, maintenance, and equipment, potentially saving large breweries millions of dollars per year.
References
Quality Analysis, Classification, and Authentication of Liquid Foods by Near-Infrared Spectroscopy: A Review of Recent Research Developments – Wang, Sun, Pu, and Cheng, Critical Reviews in Science and Nutrition, 2017, Vol. 57, No. 7, 1524-1538
https://www.tandfonline.com/doi/pdf/10.1080/10408398.2015.1115954
Near-Infrared Spectroscopy in The Brewing Industry – Sileoni, Marconi, and Perretti, Critical Reviews in Science and Nutrition, 55:1771-1791 (2015)
https://www.tandfonline.com/doi/full/10.1080/10408398.2012.726659
Process Analytical Technology for the Food Industry -O’Donnell, Fagan, Cullen, et al., Springer, Food Engineering Series (2014)
Commercial Reference
The post Beer Overview appeared first on NIR-For-Food.
]]>