The post Galaxy Scientific Launches Companion NIR For Feed Website appeared first on NIR-For-Food.
]]>The post Galaxy Scientific Launches Companion NIR For Feed Website appeared first on NIR-For-Food.
]]>The post Adulterant Overview appeared first on NIR-For-Food.
]]>Introduction
Adulteration is a legal term meaning a food product fails to meet legal standards. It indicates the intentional, fraudulent addition of extraneous, improper, or cheaper ingredients to a product or the dilution or removal of a valuable ingredient with the intention of increasing profits, ultimately compromising quality and resulting in the sale of substandard foods. Economically Motivated Adulteration (EMA) is estimated to cost the food and beverage industry between $10 billion to $15 billion per year. The increasingly global nature of the food supply chain as well as the massive size and scope of the food and beverage industry makes combating EMA a very daunting task. The UK Food Standards Agency (FSA) defines two main types of food fraud: the deliberate misdescription of food and the sale of food that is unfit and potentially harmful, although a combination of these can exist for certain incidents. The FSA estimates that approximately 10% of all food on UK supermarket shelves is adulterated in some form. In the United States, the Federal Food, Drug, and Cosmetic (FD&C) Act was passed in 1938 and contains criteria for food adulteration. Criteria that make food adulterated include: a poisonous or deleterious substance that makes it unsafe in the food itself or container, an unsafe pesticide chemical residue, food additive, animal drug, or color additive, and a filthy, putrid, or decomposed substance as well as being prepared, packed, or held under unsanitary conditions. Improper irradiation, dietary ingredients that present a reasonable risk of illness or injury when consumed under the conditions recommended in labeling, and improper importing are included as well. The criteria for EMA is as follows: a valuable constituent that has been omitted in whole or in part replaced with another substance, concealing damage or inferiority, or the addition of a substance that has been added to increase the bulk or weight, reduce quality or strength, or make it appear of greater value than it is worth. The FD&C has been amended numerous times and both the Federal Meat Inspection Act and Poultry Products Inspection Act contain provisions for adulteration as well. Some adulteration can be defined as incidental, meaning foreign substances can be incorporated into food from negligence or ignorance. This can occur during harvesting. Harvesting at the wrong time can also create adulteration by reducing nutritional value or having a product with an improper moisture level. Farmers may do this out of fear of theft or because they need money quickly. Intentional adulteration occurs with the intent to cause harm or create economic gain. Some forms of intentional adulteration are relatively innocuous, such as mispresenting the origin of a product. While this may entail a reduction in product quality, it does not present the potential for harm. In other cases, the intentional addition of toxic substances has resulted in illness and even death. In today’s social media environment, any reported incident of adulteration can have devastating consequences to the reputation and profits of food and beverage manufacturers and sellers, even if the adulteration was not their direct fault. One such example is the UK supermarket chain Tesco, which suffered a €300 million drop in market value in 2013 after horsemeat was discovered in burgers sold in their markets. Although no one was physically harmed, consumer anger led to the decrease in market value and a big hit to the company’s reputation. Brand confidence, company reputation, and the market economy can all suffer from publicized incidents of adulteration. New methods of adulteration are being developed all the time and present a big challenge to the food and beverage industry to detect and prevent adulteration.History and Incidents
The documented history of food fraud and adulteration goes all the way back to Assyrian tablets and Egyptian scrolls in biblical times. In the Middle Ages, high value imported spices were often combined with nutshells, seeds, juniper berries, and even stones and dust. Even today, spices are considered one of the most economically desired targets for adulteration because of a high value unit per mass and specificity of desired flavor characteristics. During the 18th and 19th centuries in the United States, chalk and plaster were used to water down and color milk as well as to bulk up flour. Lead was added to wine and beer. Dirt, sand, and leaves were added to coffee, tea, and spices. Preserved fruit and vegetables were artificially colored with copper salts. In more recent times, adulteration methods have become more advanced and sophisticated plus the expansion of global markets and the current social media environment have made the consequences for manufacturers and sellers of food and beverage even more pronounced. Some high-profile incidents have made global news in recent years. In 1994, ground paprika in Hungary was adulterated with lead oxide, leading to several deaths and dozens of illnesses. In 2005, Sudan I dye was discovered in Worcestershire sauce contaminated with adulterated chili powder. Sudan I dye is a known rodent carcinogen and is banned as a food additive. Herbal medicines have been adulterated with the withdrawn obesity medication sibutramine. Thirty-four products marketed as herbal supplements were recalled by the FDA in 2009 for containing sibutramine. More warnings have been issued in recent years for dietary supplements marketed as “natural”, “traditional”, or “herbal medicine”. Similar incidents have occurred in other countries. China was the location for two high-profile incidents of melamine adulteration. Melamine is a plasticizer that mimics high quality protein in routine quality tests. In 2007 it was discovered in pet food, leading to the deaths of thousands of dogs and cats and raising concerns about the safety of food imported from China. In China in 2008, melamine was added to milk and infant formula. The incident led to the hospitalization of around 54,000 infants, six deaths from kidney stones, and multiple criminal prosecutions including the execution of two of the conspirators. The horsemeat in burgers incident in England had tough consequences for the market. Sometimes the statistics of food can reveal adulteration just from analysis. In 2013, harvest statistics of the expensive Manuka honey from New Zealand revealed that only 1,700 tons of it were harvested per year, yet global sales of this honey were as high as 10,000 tons per year. Obviously, widespread fraudulent selling of ordinary honey as the more expensive Manuka honey occurred for this to happen. A test of dried oregano from English and Irish supermarkets revealed that nineteen out of seventy-eight samples contained other ingredients. These ingredients include olive and myrtle leaves and were present at levels ranging from 30% to 70%. In 2015, seven of Italy’s largest olive oil producers were under investigation for selling virgin olive oil as the higher quality extra virgin olive oil. Testing of twenty brands revealed that nine of them were found to not meet standards for extra virgin olive oil. On a larger scale, Operation Option IV was coordinated by Interpol and Europol at the end of 2014 and beginning of 2015. More than 2,500 tons of counterfeit and illicit foods were seized in forty-seven countries, including mozzarella cheese, strawberries, eggs, cooking oil, and dried fruit. These documented incidents underscore the large global scale of the food adulteration problem and the need for fast, cost-effective, and evolving methods for testing and monitoring of food fraud.Methods
Methods for food adulteration are always evolving and changing, making it difficult for testing and detection to keep up. Spices are a primary target of adulteration. They can be adulterated by adding a non-food substance, such as Sudan I dye or brick dust. Another method is to add a lower quality consumable substance. Examples of this include tomato skin in paprika, starches in onion powder, and buckwheat, millet, papaya seeds, and chili in black pepper. Black pepper is the most widely used spice in the world and thus is frequently subjected to adulteration. A substitution of a lower-quality product fits the definition of adulteration as well, such as adding Chinese Cassia cinnamon to the higher quality Ceylon cinnamon. Spent plant material added to the final product and exhaustively extracted material both qualify as adulteration. Sibutramine adulteration in herbal supplements falls under similar standards for adulteration. There have even been reports of selling road salt as food salt. Olive oil is another valuable food product that is frequently subjected to adulteration. Standards for extra virgin olive oil are strict and there are many ways to adulterate olive oil. Misrepresentation of geographical origin constitutes adulteration. A cheaper type of oil such as vegetable oil can be added. Poorer olive products such as pomace are another example. All edible oils can be subjected to adulteration but since olive oil is the most valuable, it occurs the most often in olive oil. Popular beverages have become very valuable in the market and adulteration can occur in them. Coffee is extremely popular in many parts of the world and has been adulterated by misrepresentation of geographical origin, lower quality beans, and cheaper foreign materials, such as husks and stems, chicory, grains like corn and barley, woody tissue, cocoa or soya beans, and acai berries. Alcoholic beverages are another popular beverage around the world that offer a tempting target for adulteration. Examples of adulterants in alcoholic beverages include excess water, ethanol not meant for human consumption (such as antiseptic or fuel additive) and the potentially toxic methanol in distilled beverages. Wine can be misrepresented by vintage and adulterated by adding sweetener, extra water, or other additives. Fruit juices are a valuable commercial product and can be subjected to saccharin adulteration, addition of low-quality sugars, and dilution with water. Likewise, honey is very valuable and is a target for adulteration with cheaper sugar products, such as corn syrup, sugar cane syrup, agave syrup (C4 sugars), rice, wheat, and beet syrup (C3 syrups) as well as misrepresenting higher quality honey with a lower quality brand. Sugar adulteration can occur by adding the cheaper sugar directly to the honey or feeding the bees with it, leading to lower quality honey. The dairy industry has many possibilities for adulteration. The value of milk varies depending on the animal of origin and lower value milk can be added to more valuable varieties of milk. For example, cow milk can be adulterated with buffalo, bovine, ovine, or caprine milk. Camel milk is one of the most valuable milks on the market and cow milk can be an adulterant in that case. Foreign proteins can be added as adulterants and this has proven to be dangerous, even in the case of other consumables like soy, pea, almond, wheat, and peanuts because they can cause food allergies in people. Peanut allergies are a common cause of food fatal and near-fatal allergies, making peanuts an especially dangerous adulterant if consumed by someone allergic to them. The high-profile cases of melamine adulteration in infant formula and pet food show the dangers of using a foreign toxic substance as an adulterant. Milk can be also be adulterated in its powdered form. Grains and flour are also potential targets for adulteration. In the case of cereals, the price is chiefly determined by protein content, starch content, and hardness which can vary greatly based on varieties and geographical origins. The same is true for rice. Both cheaper varieties and foreign substances like husk and sand have been added to adulterate cereals and rice. In the case of flour, durum wheat flour is considered to be superior in the manufacture of pasta products and is approximately 20% more expensive than common wheat, making durum wheat flour adulteration with common wheat flour a prime target. A more dangerous form of adulteration in flour is the addition of castor bean meal. Castor bean meal contains ricin, which is a toxic protein. Gluten free products have become a huge part of the food market in recent years and cross-contamination of gluten in products that are marketed as gluten-free is a form of adulteration. One example of this is adding the gluten source wheat flour to rice and corn-based products. The meat and seafood markets are extremely large across the globe and are likewise subjected to adulteration. Typical meat adulteration methods include the addition of water to increase weight and adding a lower quality meat to higher quality meat. The verification of a proper meat species is important for both ethical and religious concerns. Examples of meat adulteration include turkey meat in beef, lamb and beef with horsemeat, chicken, and pork, and veal with pork. In the case of seafood, the large global supply chain presents particular challenges in detecting adulteration. A cheaper product added as an adulterant is one form, such as mixing lower quality crab meat with higher quality. Crab meat is expensive and makes a prime target for adulteration. Other forms of seafood adulteration can be very difficult to detect. Freshly caught fish have a higher nutritional value than farm-bred fish, making fresh fish more valuable in the market. Representing farm fish as freshly caught constitutes adulteration. Frozen-thawed cycles are defined as the number of times a fish is thawed and frozen before consumption. Repeated frozen-thawed cycles will decrease the nutritional value of fish and thus can be constituted as a form of adulteration if a fish has lost nutritional value after being thawed and re-frozen multiple times. The multiple methods of adulteration that are continuously emerging present a tremendous challenge when it comes to testing and monitoring for adulteration.Monitoring and Testing
Testing for food adulteration has become a big part of food quality control. Visual examination to detect adulteration is usually insufficient for multiple reasons. In most cases, the amount of adulterant added to make an economic difference in the product is small enough that it can not be visually detected. The concentration of a toxic adulterant that is enough to make a product dangerous for human consumption is usually small enough that visual detection is impossible (such as melamine in dairy products). Adding water to meat, fresh fish vs. farm-bred fish, and multiple frozen-thawed cycles are other examples where visual detection is impossible. Thus, many methods have been developed for detecting adulteration in food and beverage products. Such analysis can vary from analyzing the headspace gases around a sealed product to free flowing, turbid, and viscous liquids to intact solid products. Headspace gas analysis is done by gas chromatography (GC). It measures the volatiles emitting from the sample and can detect the presence of inappropriate compounds, indicating the possibility of adulteration. Mass spectrometry (MS) is an effective tool for identifying the composition and structure of chemicals in a compound. GC and MS are often used in combination to identify different substances in samples and separate compounds into individual components. High-Performance Liquid Chromatography (HPLC) is often used for liquid analysis and has proven to be an effective tool in detecting many forms of food adulteration. Wet chemistry tests can be used as well and these are good for determining adulteration by measuring composition of components in food. Examples of this are acid hydrolysis and solvent extraction for fat and the Kjehdahl method for protein. These tests can be inadequate for some types of adulteration, as will be shown in the analysis of melamine adulteration in dairy products and animal feed. Morphological, microscopic, and DNA tests can be used as well depending on the food or beverage being analyzed. While these methods are usually effective, they have numerous drawbacks. They are time-consuming, expensive, and require the use of both chemicals that must be carefully handled and skilled technicians. These tests are also impossible to implement on a large scale as they are far too expensive to test multiple portions of the same batch. Sample preparation can be an extensive process and the tests may not be representative of what is occurring in a large batch of food or beverages. There is a need for fast, non-invasive testing methods for food that are cost-effective and can be representative of a large batch of food or beverage. One category of methods that fit these criteria is infrared spectroscopy. In recent years, infrared spectroscopic methods such as visible (VIS), mid-infrared (Mid-IR), and near-infrared (NIR) have shown potential for the verification of the authenticity of food and beverage products. Vibrational spectroscopy has proven to be effective in determining composition analysis, product quality assessment, and production control. Spectra can provide a global fingerprint which when combined with the application of chemometric techniques can be used to extract compositional characteristics that are not easily detected by traditional chemical analysis. Work is required to interpret the complex spectra obtained but once effective calibrations are created, they can be a very powerful tool for both qualitative and quantitative analysis of a product. There are numerous advantages over traditional techniques. Spectroscopic methods are easy to use in routine operations, environmentally friendly, cost-effective, and can be used to test a large portion of any food or beverage batch in a reasonable amount of time. They also possess the advantage of being able to measure multiple constituents in products with a single acquisition of a spectrum, provided that calibration models have been created for each parameter of interest. Out of VIS, Mid-IR, and NIR, NIR has proven to be the most effective of these three methods. NIR requires minimal if any sample preparation, can test a large portion of a sample, and has light penetration deep into the sample. VIS and Mid-IR are both inferior to NIR when it comes to sample preparation time and testing a large portion of a sample. The potential savings in the form of reduced time and cost of analyses have positioned NIR spectroscopy as not only an attractive technique with a bright future in food and beverage adulteration analysis, but for analyzing all kinds of natural products as well. Application studies have proven the effectiveness of NIR spectroscopy as a technique for adulteration detection. There is a clear role for spectroscopic techniques in the production plant and at critical points in the food and supply chain that will continue to evolve with more work as the 21st century moves forward.Analytes
Spices
Products: Paprika, Chili Powder, Chinese Shanyao, Onion Powder, Black Pepper, Cinnamon, Goldenseal, Herbal Medicines Adulterants: Sudan Dye, Tomato Skin, Brick Dust, Starch, Buckwheat, Millet, Papaya Seeds, Chili, Spent Material, Lower Grade Cinnamon, Exhaustively Extracted Material, Yellow Root, Yellow Dock, Oregon Grape, Coptis, SibutramineOlive Oil
Products: Extra Virgin Olive Oil Adulterants: Lower-Grade Oils – Soybean, Sunflower, Corn, Canola, Hazelnut, High Oleic Acid Safflower, Peanut, Palm Olein, Refined Olive Oil Misrepresentation of Provenance of OriginSoybean and Palm Oil
Products: Soybean Oil, Palm Oil Adulterants: Transgenic vs. Non-Transgenic, LardHoney
Products: Honey Adulterants: Fructose: Glucose Mixture, High Fructose Corn SyrupAlcoholic Beverages
Products: Whiskey, Brandy, Rum, Vodka Adulterants: Water, Ethanol, MethanolNon-Alcoholic Beverages
Products: Fruit Juice, Lime Juice, Coffee Adulterants: Saccharin, Natural vs. Synthetic, CornDairy
Products: Milk, Milk Powder, Cheese, Butter, Yogurt Adulterants: Melamine, Cow Milk in Camel Milk, Dicyandiamide, Aminotriazole, Biuret, Soy Protein Isolate, Pea Protein Isolate, Calcium Carbonate, Maltodextrin, Sucrose, Authentic Origin Designation, Tallow, Edible Gelatin, Industrial Gelatin, Soy ProteinAnimal Feed
Products: Soya Bean Meal Adulterants: MelamineFlour
Products: Durum Wheat, Flour, Gluten-Free Food Adulterants: Bread Wheat, Castor Bean Meal, Caffeine, Cane Sugar, Corn Meal, GlutenMeat
Products: Lamb, Beef, Veal Adulterants: Pork Meat, Pork Fat, Chicken, Lidia Breed Horsemeat, Foal Meat, TurkeyFish and Seafood
Products: Crabmeat, Sea Bass, Tilapia Adulterants: Origin, Fresh Caught vs. Farm Bred, Frozen-Thawed CyclesSummary of Published Papers, Articles, and Reference Materials
 Thirty-nine research papers on using NIR spectroscopy to detect food fraud and adulteration in numerous segments of the food and beverage industries were examined and summarized. Food and beverage products examined were spices, edible oils, honey, alcoholic and non-alcoholic beverages, dairy, animal feed, flour, meat, and seafood. Some topics were research concerning well-publicized incidents, such as melamine in dairy products, sibutramine in herbal medicines, and horsemeat in beef. Others were more anticipating of potential adulteration in the future. The types of adulterants examined ranged from relatively innocuous to potentially fatal. Misrepresentation of origin or substituting a cheaper quality product (in most cases) constitute adulteration that may have market consequences but little threat to human health. Contamination with peanut products or gluten are two examples of a product substitution that could create health issues. Adulterants that can have severe consequences to human health include melamine, sibutramine, Sudan I dye, methanol, industrial gelatin, and castor bean meal. Some studies compared different sampling methods and types of instruments, with an emphasis on practical advantages and disadvantages in a real setting. The feasibility of using NIR spectroscopy to replace current expensive and time-consuming methods for detecting food adulteration and food fraud was presented in all studies and the results are summarized in the individual sections.
References
Recent Trends on the Use of Infrared Spectroscopy to Trace and Authenticate Natural and Agricultural Food Products – D. Cozzolino, Applied Spectroscopy Reviews, Volume 47, 2012 – Issue 7 https://www.tandfonline.com/doi/abs/10.1080/05704928.2012.667858 Non-Destructive Detection of Food Adulteration to Guarantee Human Health and Safety – Posudin, Peiris, Kays, Ukrainian Food Journal, 2015, Volume 4, Issue 2 http://ekmair.ukma.edu.ua/bitstream/handle/123456789/4214/Posudin_Non_destructive.pdf Adulterated Food Law and Legal Definition https://definitions.uslegal.com/a/adulterated-food/ Food Adulteration, Types of Food Adulteration and Mitigation Measures https://www.publichealthnotes.com/food-adulteration-types-of-food-adulteration-and-mitigation-measures/ Food Fraud Costs the Global Food Industry $10-15 Billion Annually https://www.ifis.org/blog/global-food-fraud Economically Motivated Adulteration: Is Your Brand At Risk? https://www.manufacturing.net/article/2012/09/economically-motivated-adulteration-your-brand-riskThe post Adulterant Overview appeared first on NIR-For-Food.
]]>The post Wheat Analysis appeared first on NIR-For-Food.
]]>Introduction
Wheat is cultivated all over the world and is grown on more land area than any other food crop. The trade market for wheat is greater than that of all other crops combined and world production of wheat is well over seven hundred million metric tons annually. It is an important source of carbohydrates and the leading source of vegetable protein in food. It can be consumed as a whole grain or milled into flour and used to make numerous types of food. Wheat straw is also used as an animal feed and for manufacture of many different types of products. Proper planting, harvesting, processing, storage, and transport are essential. Monitoring of moisture in wheat is essential for proper harvesting time, pest and disease management, and avoiding spoilage during storage and transport. Protein and carbohydrates are important nutritional components as well as total gluten, glutenin, and gliadin. Wheat grain hardness is classified into three major hardness classes: soft, hard hexaploid, and durum. These are generally related to endosperm texture and although extensively studied, no direct relationship between the genetic and physicochemical basis of endosperm texture has been established. However, protein, starch, and color differences do relate to hardness in grain. An increase in particle size increases the absorption of NIR light and particle size can be directly correlated to wheat hardness. Determining wheat hardness from NIR spectroscopy is a certified AACC method. The need for minimal gluten products for people with celiac disease and related ailments makes gluten content especially important. It is important to monitor wheat straw residue composition potential in wheat fields because the level of decomposition needed to keep the soil healthy varies based on rainfall levels in the region. Wheat straw is also an important precursor for biofuel production and there are parameters that must be monitored after the necessary pretreatment, such as weight loss, residual lignin content, and hydrolysable sugars. As is the case with many agricultural products, adulteration is a problem with wheat as the nutritional value and price can vary greatly in different products. A need exists to authenticate wheat on a large scale without expensive tests and the use of subjective sensory monitoring. While research and development of transgenic wheat strains does lag behind that of other mass produced agricultural products like rice, it is still prominent especially for developing strains that are resistant to herbicides and that are low in gluten content. There is a need to develop fast, non-invasive testing methods to meet the evolving challenges in producing quality wheat. One such method that has been examined is NIR Spectroscopy.
Analytes
- Moisture
- Protein
- Total gluten content
- Glutenin
- Gliadin
- Hardness
- Neutral Detergent Fiber (NDF)
- Acid Detergent Fiber (ADF)
- Acid Detergent Lignin (ADL)
- Cellulose
- Hemicellulose
- Carbon
- Nitrogen
- Weight loss
- Residual lignin content
- Hydrolysable sugars
- Authentication of origin
- Wild vs. transgenic discriminant analysis
Summary of Published Papers, Articles, and Reference Materials
Predicting Wheat Quality Characteristics and Functionality Using Near-Infrared Spectroscopy
 NIR Spectroscopy was examined as a method for predicting a number of grain, milling, flour, dough, and breadmaking quality parameters in both red winter and red spring wheat and flour samples. One hundred of both Hard Red Winter and Hard Red Spring samples were provided for the study by the USDA Grain Inspection, Packers, and Stockyard Administration Federal Grain Inspection Service. Samples were specifically chosen for a range of protein content. HRW samples ranged from 9.2% to 15.8% protein and HRS samples ranged from 11.4% to 19.3% protein. All samples were scanned with four different NIR spectrometers to study the effects of different wavelength ranges and scanning technologies on the modeling and prediction results. Wavelengths ranges were 835 nm to 2502 nm, 850 nm to 1050 nm, 450 nm to 2498 nm, and 950 nm to 1650 nm. A portion of each sample was milled into flour and spectra were collected for each sample using both whole grains and flour. Various pre-processing methods were applied to the spectral data before chemometric modeling. Many of the parameters tested showed poor correlation for a number of reasons, including concentration below the threshold of detection, small range of values, or the parameter being a measurement that does not have an effect on the NIR spectra. However, good correlation was obtained for moisture, protein, gluten parameters, and mixograph absorption. The results for these parameters from all four instruments are shown below.
| Grain Protein Content | R² 0.97 – 0.99 | SECV 0.18 – 0.29 14% mb |
| Grain Moisture Content | R² 0.95 – 0.97 | SECV 0.16 – 0.19 % |
| Single Kernel Moisture | R² 0.92 – 0.94 | SECV 0.22 – 0.26 % |
| Flour Protein Content | R² 0.92 – 0.99 | SECV 0.29 – 0.45 14% mb |
| Gluten Content | R² 0.88 – 0.93 | SECV 0.14 – 0.19 g/10 g of flour |
| Soluble Glutenins | R² 0.75 – 0.77 | SECV 0.40 – 0.52 mg |
| Soluble Gliadins | R² 0.85 – 0.89 | SECV 0.64 – 0.76 mg |
| Insoluble Glutenins | R² 0.84 – 0.85 | SECV 0.64 – 0.67 mg |
| Total Glutenins | R² 0.81 – 0.93 | SECV 0.59 – 1.02 mg |
| Mixograph Absorption | R² 0.90 – 0.92 | SECV 0.67 – 0.76 % |
Results showed that moisture and protein could be predicted with a level of accuracy suitable for process control purposes while the gluten parameters can be predicted for quality control. A number of other parameters were modeled and showed predictions good enough for screening purposes, such as test weight, single kernel diameter, SDS sedimentation volume, color values, loaf volume, flour particle size, and the percentage of dark hard and vitreous kernels. Further analysis determined that many of these parameters were closely correlated to protein content. The influence from protein content was removed from the models and the results often got worse. The potential was shown to predict many grain quality and functionality traits from NIR spectroscopy, but many parameters are modeled based on their correlation to protein content.
https://www.ars.usda.gov/ARSUserFiles/30200525/368PredictingWheatQualityCharandFunctionality.pdf
Hardness Measurement of Bulk Wheat by Single-Kernel Visible and Near-Infrared Spectroscopy
 Wheat grain hardness is the most important quality trait for milling properties and end use. There are three classifications of wheat hardness used in the United States: soft, hard hexaploid, and durum. Grain hardness is defined in more detail as endosperm texture and the various techniques that are used for grain hardness measurement are classified into diverse groups according to grinding, crushing, and abrasion. These methods include PSI, SKCS, pearling index, SDS-PAGE, and PCR markers as well as NIR spectroscopy. NIR is an AACC approved method for determining hardness as the reflectance signal and NIR absorption increase with increasing particle size. It is proven that hardness of grain increases with particle size. Thus, NIR spectroscopy can be used to determine particle size using a method much less labor-intensive and faster than other methods. In this study, samples of both hard and soft wheat single kernels were used to determine the feasibility of single kernel hardness analysis using NIR spectroscopy. Hard wheat samples were obtained from the National Institute of Standards and Technology (NIST). Soft wheat samples were obtained from the USDA Soft Wheat Quality Laboratory (SWQL). In total, thirty-five samples were used as a calibration set and one hundred single kernels were randomly selected from each of them. Likewise, one hundred single kernels from thirty separate sample sets were used as a validation set. Each one hundred kernel set was loaded into an automated hopper for single automated measurements of NIR spectra collection, single kernel hardness, and single kernel moisture. NIR spectra were collected from 400 nm to 1700 nm in reflectance mode. Eight spectra were collected per sample and averaged into a single spectrum. All kernels were first classified as soft, hard or mixed at various kernel amount averages ranging from one kernel to fifty kernels. The hardness measurement used was hardness index with a score greater than forty-six corresponding to hard and less than forty-six corresponding to soft. The thirty kernel average group was then chosen to create a PLS calibration model correlating the NIR spectra to hardness. Results are shown below.
Hardness Classification:
| 1 Kernel Average | R² = 0.49 |
| 5 Kernel Average | R² = 0.83 |
| 10 Kernel Average | R² = 0.86 |
| 20 Kernel Average | R² = 0.90 |
| 30 Kernel Average | R² = 0.91 |
| 50 Kernel Average | R² = 0.91 |
Correct Classification between Hard and Soft Kernels Compared to Reference Method: 97%
| Hardness PLS Model | R² = 0.91 | SECV= 7.70 |
The results here confirmed the potential of using NIR spectroscopy and calibration models to both classify kernels based on grain hardness and to quantify hardness index. One factor must be noted as using another spectroscopic method as the reference method when building calibration models using NIR spectra can often introduce error, even when the spectroscopic method is a certified AACC method. Results would likely improve using a different hardness test for the reference values. Still, the correlation coefficient having a value higher than 0.9 indicates that the correlation is accurate. It is advised that more study be done before using this method in a real-time setting.
334AACChardness.pdf (usda.gov)
Modeling Research on Wheat Protein Content Measurement Using Near-Infrared Reflectance Spectroscopy and Optimized Radial Basis Function Neural Network
NIR spectroscopy was examined as a method for determining protein content in wheat. One hundred forty wheat samples from a dozen different wheat producing areas were provided by the Institute of Agricultural Quality and Safety in China. Protein content in the samples ranged from 10.85% to 18.31% and were chosen from areas representative of the actual wheat growing conditions in China. Samples were scanned from 850 nm to 1050 nm at 2 nm intervals. Ten scans were collected per reading and averaged into one spectrum. Reference values for protein were determined by the semimicro-Kjeldahl method, which is time-consuming and impractical for implementing on a large scale. Instead of the traditional Partial Least Squares (PLS) algorithm, the artificial neural network algorithm known as Radial Basis Function (RBF) was used to correlate the spectral data to protein value. RBF is favored by many researchers for its ease of use, high fitting, and high nonlinear approximation. The Particle Swarm Algorithm (PSA) was used to optimize the number of cluster centers in the hidden layers of the RBF network. One hundred samples were used to create the RBF model and the remaining samples were used as a validation set for independent predictions.
| Protein | R² = 0.975 | RMSEP = 0.266% |
The results of this study were excellent and proved the feasibility of using NIR spectra, protein values, and the RBF algorithm to predict protein in wheat. The independent prediction confirmed the validity of the model. NIR spectroscopy can be used to replace traditional time-consuming and expensive methods for determining protein content in wheat.
Rapid Estimation of Wheat Straw Decomposition Constituents Using Near-Infrared Spectroscopy
 In areas where wheat in grown and rainfall amounts can vary from region to region, crop and soil management practices must be adjusted to account for high and low rainfall. One example of this is using no-till production systems for wheat crops, which is an excellent technique for reducing soil erosion. It is important for wheat straw residue to decompose rapidly in winter months in high rainfall regions to avoid planting complications in the spring. Likewise, in low rainfall regions, wheat straw residue needs to decompose slowly to cover the soil during the entirety of the fallow season. Fallowing is an old term for soil management defined as allowing soil time to rest and recover. A need exists for determining wheat straw decomposition parameters that is effective, fast, non-destructive, and requires minimal labor. NIR spectroscopy was examined for this purpose. Straw from a panel of four hundred eighty soft winter wheat cultivars from the Pacific Northwest were provided for the study. This region is particularly known for variance in annual rainfall totals and the samples were from two separate regions, one known for high annual rainfall and the other for low annual rainfall. Reference tests were performed for the following parameters: Neutral Detergent Fiber (NDF), Acid Detergent Fiber (ADF), Acid Detergent Lignin (ADL), Cellulose, Hemicellulose, Carbon, and Nitrogen. Samples were scanned from 400 nm to 2498 nm at 2 nm intervals in a sampling cup. Each sample was rotated 90 degrees after the first scan and scanned again, with the two spectra for each sample then averaged into one spectrum. Various pre-processing methods were applied to the spectral data before chemometric modeling. Partial Least Squares (PLS) calibration models were created correlating the NIR spectra to the parameters of interest. Results are shown below.
| NDF | R² = 0.87 | SECV 1.52% |
| ADF | R² = 0.89 | SECV 1.38% |
| ADL | R² = 0.68 | SECV 0.56% |
| Cellulose | R² = 0.91 | SECV 1.10% |
| Hemicellulose | R² = 0.45 | SECV 1.10% |
| Carbon | R² = 0.76 | SECV 1.12% |
| Nitrogen | R² = 0.75 | SECV 0.05% |
Cross-validation was used to pull out representative samples from the calibration models and perform independent predictions. Prediction results were successful in predicting NDF, ADF, and cellulose with an accuracy suitable for screening purposes. Accuracy was lower for the other parameters and not suitable to be used in any real-time setting. Results may improve if more samples were incorporated into the calibration set. For real-time use, classifying wheat straw samples into a high or low category for decomposition potential by predicting NDF, ADF, and cellulose along with subsequent tests for carbon and nitrogen using another reference method would work to provide a good estimate of fast or slow decomposition potential.
Characterization of Key Parameters for Biotechnological Lignocellulose Conversion Assessed by FT-NIR Spectroscopy
Wheat straw and oat straw are lignocellulosic materials that contain around 30% to 35% cellulose, 20% to 25% hemicelluloses, and 17% to 20% lignin. The carbohydrates in these materials can be hydrolyzed to fermentable sugars, which are precursor substances for biotechnological conversion to biofuels or building blocks for chemical syntheses. However, pretreatment for delignification is required to open up the lignocellulose structure and to increase the accessibility to microbial enzymes. Traditional methods for determining key parameters like weight loss, residual lignin content, and hydrolysable sugars entail expensive and time-consuming wet chemistry methods which are impractical to implement for large scale testing. NIR spectroscopy was examined as a method for determining key parameters for biotechnological lignocellulose conversion in wheat straw and oat straw. Eighty wheat straw samples and fifty-three oat straw samples were procured for the study. Initial wet chemistry analysis showed the following composition: 63% polysaccaharides, 21.5% lignin, 11.4% extractives, and 4.2% ash for wheat straw and 51% polysaccaharides, 19.6% lignin, 20.5% extractives, and 8.9% ash for oat straw. Samples were chopped to 1 cm length and 20 g per sample were treated at varying concentrations of acid, acid/H2O2, alkali, and alkali/H2O2. Samples were then rinsed and dried before wet chemistry reference testing to determine conversion parameter values. An FT-NIR spectrometer was used to scan samples from 10000 cm-1 to 4000 cm-1 at 8 cm-1 resolution. One hundred scans were collected per reading and averaged into one spectrum. This process was repeated four times for each sample and the four collected spectra were then averaged into one single spectrum per sample. Various pre-processing methods were applied to the spectral data before chemometric modeling. Partial Least Squares (PLS) models were created correlating the NIR spectra to the parameters of interest. Results are shown below.
Wheat Straw:
| Weight Loss Range: 4.0% to 33.5% | R² = 0.85 | RMSEP= 3.5% |
| Residual Lignins Range: 7.9% to 20.7% | R² = 0.95 | RMSEP= 0.9% |
| Reducing Sugars Range: 128 mg/g – 1000 mg/g | R² = 0.94 | RMSEP= 83 mg/g |
Oat Straw:
| Weight Loss Range: 5.0% to 44.0% | R² = 0.96 | RMSEP= 3.4% |
| Residual Lignins Range: 8.3% to 18.5% | R² = 0.99 | RMSEP= 0.8% |
| Reducing Sugars Range: 131 mg/g – 812 mg/g | R² = 0.96 | RMSEP= 64 mg/g |
The results here show the potential to use NIR Spectroscopy as a method for determining parameters essential for biotechnological lignocellulose conversion of both wheat straw and oat straw. Further calibration work was done to determine the feasibility of measuring parameters for anaerobic conversion of wheat straw to biogas: biogas production, total solids, and volatile solids content. While the results were not good enough for quantitative measurement of these parameters from NIR spectra, they were considered decent enough for estimation of values. Further study and more samples may improve these results. Overall, NIR spectroscopy shows promise as a fast, non-invasive, and non-destructive method for determining important precursor parameters of biofuel production in wheat straw and oat straw.
Tracing the Geographical Origin of Durum Wheat by FT-NIR Spectroscopy
Durum wheat is a cereal crop that is mainly cropped in the Mediterranean basin and is used to manufacture a wide range of products. Characteristics include large kernel size, hardness, bright yellow color, high protein content, and gluten strength. It is especially popular for making pasta and Italy is the country with both the highest production and consumption of durum wheat. Consumption of durum wheat is so high in Italy that despite being the largest producer of it, imports are required to meet demand. As is the case with many natural products, durum wheat can vary greatly in nutritional quality and market price based on origin. While labeling origin is a requirement of the EU, this is difficult to enforce in practice as current methods for determining origin require destructive and expensive methods such as isotopic, compositional, and elemental analysis that are impractical to implement for large scale testing. NIR spectroscopy was examined as a method for determining geographical origin of durum wheat. Fifty-nine durum wheat samples from eleven different regions coming from three separate geographical areas of Italy were procured for the study. Twenty-nine samples from eight different foreign countries were obtained as well. Samples were ground before scanning using an FT-NIR spectrometer from 10000 cm-1 to 4000 cm-1 at 8 cm-1 resolution. Thirty-two scans were collected per reading and averaged into one spectrum. For some samples, multiple separate portions of each sample were scanned as well and in total, one hundred eighty-one spectra were collected for the Italian samples. Likewise, a total of seventy-five spectra were collected for the non-Italian samples. Different pre-processing methods were applied to the NIR spectra before classification analysis. Two separate Principle Component Linear Discriminant Analysis (PC-LDA) classification models were created from the NIR spectra: one classifying the Italian samples based on the Northern, Central, and Southern geographical origins and the other classifying the Italian samples from non-Italian samples.
| Italian Samples: Overall Discrimination Rate (OD) | 96.7% |
| Non-Italian Samples: Overall Discrimination Rate (OD) | 100% |
Both classification models showed excellent results and were validated by using NIR spectra of separate samples from those used to create the calibration models. Some misclassification occurred between samples from the Northern and Central regions of Italy while the Southern region was almost always classified correctly. This likely occurred because growing conditions in Northern Italy are humid and cold while conditions in Southern Italy are warmer and dryer, leading to differences in the chemical composition in the wheat. A perfect discrimination rate was obtained for the Italian samples and samples from other countries. This study demonstrated the potential of NIR spectroscopy for use as a fast and non-invasive method for classifying durum wheat based on geographical origin.
Effective Identification of Low-Gliadin Wheat Lines by Near Infrared Spectroscopy (NIRS): Implications for the Development and Analysis of Foodstuffs Suitable for Celiac Patients
Gluten proteins account for 80% to 85% of total grain protein in wheat, with about 30% being gliadins and 50% being glutenins. These proteins are associated with celiac disease, which may affect up to 7% of the world’s population, and non-celiac gluten sensitivity (NCGS), which is estimated to be prevalent in up to 6% of the United States population. For people suffering from these ailments, it is recommended to follow a completely gluten-free diet. In practice, this is difficult to do as wheat is such a large part of food products and additives. One promising approach for reducing gluten toxicity for those affected with these disorders is the down regulation of immunodominant gluten peptides by RNA interference (RNAi), resulting in low-gliadin wheat lines. Research and testing has demonstrated the potential of this technology in bread wheat to develop food products that can be tolerated by those suffering from celiac disease and NCGS. There is a need to develop a system capable of distinguishing normal wheat lines from transgenic low-gliadin wheat lines and NIR spectroscopy was examined for this purpose. Two sets of samples were obtained for the study: Four hundred and nine wild and one hundred twenty-six transgenic whole grain samples and four hundred and fourteen wild and one hundred fifty-six transgenic flour samples. All samples were scanned using an NIR spectrometer from 400 nm to 2500 nm at a 2 nm scanning interval. Each sample was scanned twice and the results were averaged into a single spectrum. Various pre-processing methods were applied to the spectral data before chemometric analysis. Different Partial Least Squares-Discriminant Analysis (PLS-DA) classification models were created using different wavelength ranges and pre-processing methods on the spectral data. The best results obtained are shown below.
| Whole Grain Classification | 96% correct |
| Flour Classification | 99% correct |
PLS-DA models use an arbitrary number for two classification groups and a number is chosen based on the NIR spectra to classify samples. An independent validation set of samples was used for both whole grain and flour to perform predictions and the results were excellent. Further validating the results is that the validation set for both groups was used from two separate harvesting years, indicating that any classification is not based on different harvests. This study proved the feasibility of using NIR spectra and classification models to successfully classify wild and transgenic whole grain wheat and wheat flour.
The post Wheat Analysis appeared first on NIR-For-Food.
]]>The post Rice Analysis appeared first on NIR-For-Food.
]]>Introduction
 Rice is the most widely consumed food in the world and approximately one-half of the world population is wholly dependent on rice, especially in Asia. It is estimated that one-fifth of all calories consumed worldwide come from rice and proper planting, harvesting, processing, storage, and transport are essential. Starch and protein are two important nutritional components in rice. Starch content is measured by amylose, the linear and helical molecule that comprises 20% to 25% of starch in rice. Both breakdown and setback viscosities have been correlated both positively and negatively with sensory attributes of rice after it has been cooked, such as stickiness, firmness, and hardness, making these important measurements in final product quality. Moisture content of rice should be between 20% and 25% at the time of harvesting and drying is important before storage to reduce fungal growth and insect infestation. Other important nutritional parameters include antioxidant activity and Gamma Oryzanol, which measure organic molecules that promote health by protecting cells from damage caused by free radicals and reactive oxygen species that may exert harmful metabolic effects. With the vast amount of rice produced, authentication of different species and brands of rice is extremely important. The same species of rice can vary greatly in nutritional value from brand to brand, making higher-quality brands subject to adulteration with cheaper ones. The development of hybrid rice that produces more plant yield also presents challenges for monitoring and identifying species. Discrimination of transgenic rice as well as monitoring wall polymer features and biomass saccharification are important as research and production of transgenic rice continues to increase. Insect infestation is a big problem for rice producers and they often use far more pesticide than needed for fumigation because there is no easy way to determine the exact level of pest infestation. Using too much pesticide wastes product and can also create health issues for the rice consumer. There is a need to develop fast, non-invasive testing methods to meet the evolving challenges in producing quality rice. One such method that has been examined is NIR Spectroscopy.
Analytes
- Amylose
- Protein
- Breakdown viscosity
- Setback viscosity
- Moisture
- Total Phenol Content (TPC)
- Radical scavenging activity by DPPH
- Species and brand authenticity
- Hybrid rice ID
- Chlorophyll content of leaves
- Transgenic rice discrimination
- Wall polymer features and biomass
- saccharification in transgenic rice
- Weevil quantity in rice stock
Summary of Published Papers, Articles, and Reference Materials
Prediction of Some Quality Properties of Rice and its Flour by NIR Analysis
 Bulk samples of the Iranian rice variety Kharaz were procured for the study. Initial moisture content was determined and then paddies were dried using a laboratory dryer. A portion of each sample was crushed with a husk and milled. Five grams of each sample were scanned in a rotating cup from 870 nm to 2450 nm in reflectance mode at 6.5 nm increments. Each sample was scanned three times with sample repacking for each individual scan and the three scans per sample were averaged into a single spectrum. This process was conducted for both milled rice and rice flour from the samples. In total, one hundred eleven samples (eighty-four for calibration and twenty-seven for validation) for rice flour and one hundred and nine (eighty-one for calibration and twenty-eight for validation) were used for the study. Reference tests were conducted on each sample to determine amylose content, protein content, breakdown visosity, and setback viscosity. Principle Component Analysis (PCA) was performed for outlier determination and various pre-processing methods were applied to the spectral data before chemometric analysis. The spectral data and reference values were used to create Partial Least Squares (PLS) models correlating the spectra to the parameters of interest.
Grain
| Amylose | R² = 0.881 | RMSEC = 0.303% |
| Protein | R² = 0.948 | RMSEC = 0.27% |
| Breakdown Viscosity | R² = 0.984 | RMSEC = 2.59 RVU |
| Setback Viscosity | R² = 0.927 | RMSEC = 3.11 RVU |
Flour
| Amylose | R² = 0.851 | RMSEC = 0.393% |
| Protein | R² = 0.994 | RMSEC = 0.07% |
| Breakdown Viscosity | R² = 0.961 | RMSEC = 2.57 RVU |
| Setback Viscosity | R² = 0.962 | RMSEC = 1.33 RVU |
The models showed good correlation between the spectral data and parameters of interest. Independent predictions from the validation samples spectra proved the validity of the models. The results of this study demonstrated the potential to use NIR spectroscopy as a fast and non-invasive method for predicting amylose, protein, breakdown viscosity, and setback viscosity in both rice and flour.
Measurement of Moisture Content for Rough Rice by Visible and Near-Infrared Spectroscopy
Two separate spectrometers were procured to examine the feasibility of determining moisture content in rice samples. Three different types of rice were used: single kernel, multi-kernel, and cracked multi-kernel. Samples were collected and were dried at different levels ranging from 11.5% to 28.7% moisture. One spectrometer had a wavelength range from 400 nm to 1050 nm while the other had a range of 400 nm to 2498 nm. Both Multiple Linear Regression (MLR) and Partial Least Squares (PLS) algorithms were used to create models using the reference values for moisture and spectral data after various pre-processing methods. In total, seventy-two different models were created. The best results were shown using a PLS model with first derivative processing over the wavelength range from 400 nm to 2498 nm with an R² value of 0.97 and an SEC of 1.3% moisture. The results proved the feasibility of using NIR spectra and chemometric modeling to predict moisture content in rice.
Analysis of Antioxidant Activity of Chinese Brown Rice by Fourier-Transformed Near Infrared Spectroscopy and Chemometrics
 Brown rice is known as a food with the potential to improve human health because it is high in antioxidative compounds which have the ability to both inhibit the formation and to reduce the concentrations of reactive cell damaging free radicals. Standard reference methods for measuring these compounds are time-consuming, expensive, and impractical for measuring a large number of samples. The potential for using NIR spectroscopy to measure antioxidant activity in rice expressed as Total Phenol Content (TPC) and Radical Scavenging Activity by DPPH – both expressed as Gallic Acid Equivalent (GAE), a measurement of the amount of phenolics in a substance – was examined. One hundred twenty-one brown rice samples were collected from five separate producing areas for the study. Samples were ground into powder before scanning. Diffuse reflectance spectra were collected for all samples from 12000 cm-1 to 4000 cm-1 with 4 cm-1 resolution and a scanning interval of 1.929 cm-1. Sixty-four scans were collected for each reading and averaged into one spectrum. Reference tests were performed on each sample to determine TPC and DPPH. Various pre-processing methods were applied to the spectral data before chemometric modeling.
| TPC | R² = 0.962 | RMSEP = 0.062 mg GAE/g |
| Radical Scavenging Activity by DPPH | R² = 0.974 | RMSEP = 0.141 mg GAE/g |
Good correlation was shown for both antioxidant parameters in the chemometric models. The wavelength ranges from 5600 cm-1 to 4800 cm-1 and 6400 cm-1 to 6000 cm-1 showed the best results for the TPC model and the ranges from 5200 cm-1 to 4400 cm-1 and 6400 cm-1 to 6000 cm-1 showed the best results for the DPPH model. While promising, it must be noted that the results here are for measuring very low concentrations of these parameters that are below the usual threshold of detection for measurements using NIR spectroscopy. It is possible that the models are making an indirect correlation of other parameters that are correlated with the antioxidant activity. While indirect correlations are acceptable if properly validated, more study will be necessary before using this application in a real-time, practical setting.
Study on evaluation of gamma oryzanol of germinated brown rice by near infrared spectroscopy
Gamma Oryzanol is a substance found in rice bran as well as wheat bran and in some fruits and vegetables. It is often extracted as rice bran oil and is considered valuable for its high nutritional value due to its mixture of antioxidant compounds. The feasibility of measuring Gamma Oryzanol in germinated brown rice using NIR spectroscopy was examined. Both rough rice samples and samples that were already germinated and purchased from local markets in Thailand were procured for the study. The rice was soaked in water at room temperature for either twenty-four or forty-eight hours and dried at intervals ranging from no drying time to thirty-six hours. Two hundred eighteen samples in total were used for the study. Samples were scanned in a rotating cup from 12500 cm-1 to 4000 cm-1 at 16 cm-1 resolution. Sixty-four scans were collected per reading and averaged into one spectrum. Various pre-processing methods were applied to the spectral data before chemometric modeling.
| Gamma Oryzanol | R² = 0.934 | RMSECV= 0.88 X 10⁻⁴ mg/100 g |
Different groups and pre-processing methods were used to create different Partial Least Squares models for different varieties and groupings of rough rice and rice purchased from markets. The results shown above were for the germinated rice purchased from markets. Other groups showed mixed results for correlation. While promising, it must be noted that the results here are for measuring very low concentrations of gamma oryzanol that are below the usual threshold of detection for measurements using NIR spectroscopy. It is possible that the models are making an indirect correlation of other parameters that are correlated with the Gamma Oryzanol concentration. While indirect correlations are acceptable if properly validated, more study will be necessary before using this application in a real-time, practical setting.
https://www.worldscientific.com/doi/pdf/10.1142/S1793545814500023
Authenticity Detection of Black Rice by Near-Infrared Spectroscopy and Support Vector Data Description
Black rice is a very important rice species in Southeast Asia and varieties often differ in nutritional value due to genetic and environmental factors. The quality and price of different brands can vary greatly and lower quality brands are often sold as higher quality brands. Current methods for determining the quality of black rice are either objective human sensory methods or by expensive methods that are impractical because of cost and the inability to implement them on a large scale, especially when considering that adulteration usually occurs in small town markets. The feasibility of discriminating between different brands of black rice using NIR spectroscopy was examined. A total of one hundred forty-two black rice samples from three separate brands was procured for the study. Samples were scanned in a rotating cup from 10000 cm-1 to 4000 cm-1 at 3.856 cm-1 resolution. Thirty-two scans were collected per reading and averaged into one spectrum. Principle Component Analysis (PCA) was used for exploratory analysis and three separate algorithms were used for classification analysis: Support Vector Data Description (SVDD), Nearest Neighbor Method (NNM), and Gaussian Method.
| SVDD | Specificity – 100% | Sensitivity – 94% |
The results using SVDD for a classification method to sort the three separate brands of rice using NIR spectra were excellent and proved the feasibility of the method. The other two algorithms showed good results as well. This study showed that NIR spectroscopy can be used to replace sensory and chemical analysis as methods for authenticating different brands of black rice. More samples and data analysis would be needed before implementing this method in a practical setting.
Authentication of Rice (Oryza sativa L.) Using Near Infrared Spectroscopy Combined with Different Chemometric Classification Strategies
 Vietnam is among the top five exporters of rice and it is estimated that there are more than one hundred thirty brands of rice on the market, with no single brand accounting for more than 3% of the total. The market is fragmented and sellers often mix a low quality brand of rice with a higher quality brand or even pass off a low quality brand as a high quality one. Current methods for determining rice authenticity are time-consuming, costly, can require extensive sample preparation, and are not suitable for large-scale measurements. Two separate varieties of rice from different regions were procured for the study – one known as higher quality (J85) and one known as lower quality (DT8). Adulterated samples were prepared by adding 5% and 10% by weight of DT8 to J85 rice. In total, seventy-two authentic and one hundred twenty-eight adulterated samples were used. Samples were scanned in a rotating cup from 740 nm to 1070 nm using a hand-held spectrometer at a 1 nm scanning interval. Three spectra were collected per sample. Various pre-preprocessing methods were performed on the spectral data. Partial Least Squares Discriminant Analysis (PLS-DA) was performed on different classifications of the data, including pure vs. both groups of adulterated samples as well as pure vs. 5% adulterated and pure vs. 10% adulterated.
| PLS-DA | 84% correct classification of pure samples vs. 10% adulterated |
The results here show that NIR spectroscopy is a viable method for classifying pure high quality rice samples and adulterated samples at 10% adulteration. The classification results were worse when using just the 5% adulterated samples and both the 5% and 10% adulterated samples, indicating that the method is best suited for detecting 10% and higher levels of adulteration. It is almost certain that better results would be achieved using a spectrometer with a longer wavelength range and including samples at a level of adulteration higher than 10%. The short wavelength leaves out areas of the NIR spectrum that likely show spectral differences that could be used for classification and using samples that are adulterated at a level higher than 10% would increase the range for the discriminant analysis and provide a basis for better discrimination between sample groups.
Vis/NIR Reflectance Spectroscopy for Hybrid Rice Identification and Chlorophyll Content Evaluation for Different Nitrogen Fertilizer Levels
The use of hybrid rice has become prominent to increase yield in fields where rice is grown. New higher-yield varieties are being continuously developed. Nitrogen is an important nutrient indicator for crops and is closely correlated with the chlorophyll content of leaves as well as the photosynthetic ability of crops. NIR spectroscopy was examined as a method for classifying varieties of hybrid rice and six different nitrogen fertilizer levels as well as quantifying chlorophyll content in rice leaves. The five varieties of hybrid rice were all cultivated in one experimental field in China which was divided into thirty separate zones. During the entire growing period, six separate levels of nitrogen fertilizer were provided in the different zones. When the rice reached the maturity stage, five whole plants were collected from each zone. The plants were placed into pots filled with water to prevent the leaves from drying. Four rice leaves at different heights were retrieved from each plant, making for a total of six hundred leaves. Leaves were scanned using a portable spectrometer from 250 nm to 2200 nm. Various preprocessing methods were applied to the spectral data before chemometric analysis. The Support Vector Machine (SVM) algorithm was applied to identify the five varieties of hybrid rice and the six levels of nitrogen fertilizer. Some success was achieved in classifying the five hybrid rice varieties, but three of the varieties had the same female parent plant and these three varieties were often misclassified amongst each other. There was also error in classifying the hybrid varieties at the highest nitrogen level, which likely occurred because the excessive nitrogen level resulted in abnormal growth. Better results were achieved for classifying based on nitrogen level, especially when classifying the no nitrogen plants vs. plants that do have nitrogen. This classification resulted in 100% success using an independent validation set. The spectral data and chlorophyll content values were used to create a Partial Least Squares (PLS) model correlating the chlorophyll content to the NIR spectra.
| Chlorophyll Content | R² = 0.978 | RMSECV = 0.506 SPAD |
The reference values for chlorophyll content were determined using an SPAD meter, which measures leaf transmittance at a few individual wavelengths to determine chlorophyll. Good correlation was shown from the chemometric model and an independent validation set confirmed the prediction results. This study proved the feasibility of using NIR spectroscopy to identify rice varieties and evaluate nitrogen fertilizer levels. More work will be necessary by adding more sample varieties before implementing this method in a practical setting.
Discrimination of Transgenic Rice Based on Near Infrared Reflectance Spectroscopy and Partial Least Squares Regression Discriminant Analysis
Genetically modified foods are continuously researched for potential improvements such as resistance to disease, pests, and herbicides as well as increased nutritional content. The use of such foods is both highly regulated and controversial as there are concerns about human health and safety, environmental impact, and economic issues. Traditional detection methods for transgenic rice are expensive, difficult to use, and impractical for large-scale use. NIR spectroscopy was examined as a method for classifying wild rice and transgenic rice as well as classifying the same variety of transgenic rice transformed with the protein gene and regulation gene. The wild type rice Zhonghua 11 (ZH11) was used as the transgenic material. Two single copy transgenic rice lines were developed using the OsTCTP and Osmi166 genes into ZH11 and designated as TCTP and mi166. All rice lines were planted, harvested, and dried in the same field under the same conditions. A total of one hundred ninety-two rice grains were used for the study. Spectra were collected from 10000 cm-1 to 4000 cm-1 at 8 cm-1 resolution. Thirty-two scans were collected per reading and averaged into one spectrum. Three grains were used and repositioned three times for each sample for a total of three hundred seventy-six spectra. Principle Component Analysis (PCA) was applied for initial discrimination analysis and outlier detection. Partial Least Squares Discriminant Analysis (PLS-DA) was applied to discriminate between the wild vs. transgenic rice and the two separate transgenic lines.
PLS-DA
| Wild rice vs. Transgenic Rice | Correct Classification: 100% |
| TCTP vs. mi166 | Correct Classification 100% |
The results of this study were excellent and proved the feasibility of discriminating wild rice from transgenic rice as well as the same variety of transgenic transformed with different genes. A validation set was used to prove the validity of the calibration models. The potential was demonstrated for using NIR spectroscopy as a discrimination method for transgenic rice.
A precise and consistent assay for major wall polymer features that distinctively determine biomass saccharifcation in transgenic rice by near-infrared spectroscopy
The genetic modification of plant cell walls is considered to reduce lignocellulose recalcitrance in bioenergy crops. It is important to develop a precise and rapid assay for the major polymer features that affect biomass saccharification in transgenic plants. In this study, the feasibility of using NIR spectroscopy for predicting biomass enzymatic saccarification and major polymer wall features was examined. Two hundred forty-six transgenic rice plants and one wild rice plant were procured for the study. Before NIR spectra of the rice straws were collected, wall polymer features and biomass enzymatic saccarification were determined after alkali pretreatment. Correlation analysis indicated that crystalline cellulose and lignin levels negatively affected the hexose and total sugar yields released from pretreatment and enzymatic hydrolysis in the transgenic rice plants. The arabinose levels and arabinose substitution degree (reverse xylose/arabinose ratio) exhibited positive impacts on the hexose and total sugars yields. After this correlation analysis was performed, all samples were scanned from 400 nm to 2500 nm. Calibration models were created for different wall polymers and biomass saccarification parameters.
Wall Polymers
| Cellulose | R² = 0.88 | SECV = 1.59% Dry Matter |
| Hemicellulose | R² = 0.84 | SECV = 1.20% Dry Matter |
| Lignin | R² = 0.80 | SECV = 0.75% Dry Matter |
Biomass Saccarification
| Pretreatment | R² = 0.98 | SECV = 0.42% Total |
| Enzymatic Hydrolysis | R² = 0.98 | SECV = 1.38% Total |
| Total Sugar Released | R² = 0.91 | SECV = 1.38% Dry Matter |
| Fermentable Hexoses | R² = 0.97 | SECV = 2.20% Total Hexoses |
All models showed good correlation for the wall polymer features and biomass saccharification parameters. A rapid and precise screening method for biomass samples could be groundbreaking in determining a strategy for genetic modification of plant cell walls. Cellulose and hemicellulose modification and cell wall remodeling in transgenic rice lines could greatly improve biomass enzymatic digestibility in rice and the NIR method studied here provides a potential method for rapid screening of the parameters of interest.
Feasibility study on estimation of rice weevil quantity in rice stock using near-infrared spectroscopy technique
Premium grade rice requires that nearly all grains be perfectly whole with a minimum amount of foreign particles. Rice weevils are especially detrimental and can degrade premium rice into low-quality rice. The current practice is for rice millers to use excess fumigation to eliminate weevils, a practice that not only wastes product but can also leave excess pesticide residues that can cause health problems when the rice is consumed. There is a need for a rapid, low-cost method to determine the level of weevil infestation in rice and NIR spectroscopy was examined for this purpose. A total of sixteen hundred and eighty samples of both milled Hommali rice and brown rice Hommali rice were procured for this study. A total of twenty different levels of weevil infestation ranging from ten to two hundred rice weevils per sample in increments of ten were prepared. For each sample, rice was added to the weevils to make a 100 g portion and then each sample was gently mixed twenty times. A sample with no weevil infestation was included as well. Samples were scanned from 780 nm to 2500 nm at 0.5 nm scanning interval. Sixty-four scans were collected and averaged into a single spectrum. Further averaging was done by scanning ten portions of each sample and averaging those ten spectra into one spectrum. Various pre-processing methods were applied to the spectral data. Two separate Partial Least Squares (PLS) calibration models were created correlating the spectral data to weevil infestation level: one for milled rice and one for brown rice.
| Milled Rice Weevil Infestation Level | R² = 0.96 | RMSEP = 10.4 |
| Brown Rice Weevil Infestation Level | R² = 0.90 | RMSEP = 18.7 |
The results of this study demonstrated the potential to use NIR spectroscopy as a screening tool for estimating the level of weevil infestation in both milled and brown rice. Having a rapid method for determining infestation level can enable millers to reduce the amount of pesticide used to eliminate weevils, resulting in both reduced product used and cost savings as well as lower pesticide residues in the rice, improving safety for rice consumers.
The post Rice Analysis appeared first on NIR-For-Food.
]]>The post Oilseeds Analysis appeared first on NIR-For-Food.
]]>Introduction
Oilseeds are the seed of many different types of plants that are used as a source for their vegetable oil. They contain high concentrations of energy as well as moderate amounts of protein and fiber. Soybeans are the most widely used oilseeds and the term “vegetable oil” is synonymous with soybean oil in the United States. They account for over half of all oilseeds produced worldwide. Other popular oilseeds are groundnuts/peanuts, sunflower, sesame, and rapeseed/canola. The meal from oilseeds is used as livestock feed and biofuel from oilseed oil is becoming more prevalent as awareness of environmental concerns and sustainable alternative energies increases. Production and trade of oilseeds has increased in recent years, with many types reaching ten-year production records in 2020 aided by higher demand and improved crop yield per acre. Different oilseeds vary in oil yield and production per crop acre, although the process for manufacturing oil, biofuel, and meal from oilseeds is similar for most types. Final product quality is very dependent on processing and there are many nutritional parameters that must be monitored in oilseeds, such as oil, moisture, protein, carbohydrates, and fatty acids. Other important quality components in oilseeds include flavor and aroma, seed viability, oil yield, and seed variation. Seed variation can occur from a number of factors, including aging, geographical origin, and color. Standard methods for measuring quality parameters of interest in oilseeds are often expensive, time-consuming, require the use of toxic chemicals and solvents, and require destruction of the tested sample. As oilseeds continue to play a large role in the world food, animal feed, and biofuels market, there is a need to develop fast, non-invasive testing methods to meet the evolving challenges in producing quality oilseeds. One such method which has been examined is NIR Spectroscopy.
Analytes
- Oil content
- Moisture
- Protein
- Fatty acids
- Lipids
- Ash
- Carbohydrates
- Oleic acid
- Linoleic acid
- Erucic acid
- Amino acids
- Pearson correlation coefficient analysis between nutritional components determined by NIR spectroscopy and volatile compounds determined by GC-MS
- Oil yield of sesame seeds used for Traditional Aqueous Extraction Processing (TAEP)
- Classification of viable and non-viable castor seeds
- Geographical origin and age of Torreya grandis seeds
- Determining sesame seed variation based on origin and light/dark seeds
- Variation in major components of sesame seeds in different countries
Summary of Published Papers, Articles, and Reference Materials
Review of NIR Spectroscopy Methods for Nondestructive Quality Analysis of Oilseeds and Edible Oils
 Oilseeds and edible oils play a vital role in human health and are both consumed and produced on a significant level worldwide. They are an important energy source for people and provide many important nutritional components, such as starch, protein, fatty acids, amino acids, vitamins, phytosterols, and polyphenols. The quality of edible oils is dependent on the quality and proper processing of oilseeds and in recent years, there has been a significant increase in interest of the quality and safety of oilseeds. With this increased interest, there is a need for fast, non-invasive, and cost-effective testing methods. NIR spectroscopy has been used as a quality assessment tool for numerous parameters in both oilseeds and edible oils and here the different parameters, methods, and applications are examined.
Oilseeds that have been used in NIR spectroscopic applications include soybeans, rapeseed, sesame, and peanuts. Traditional testing methods for quality control are often expensive and time-consuming. Some of these include Soxhlet extraction for oil content, Kjeldahl method for protein, titration for acid value, and GC or GC-MS for fatty acid composition. Building a NIR method requires the scanning of samples with known reference values for the parameters of interest. Chemometric modeling is then used to correlate the NIR spectra to the parameters of interest. Once models are created, they can use the NIR spectra to predict the modeled parameters. A distinct advantage of NIR spectroscopy is that a single spectrum scan can be used to predict multiple components as long as the chemometric models are created. Listed below are some oilseed types and parameters that have used NIR spectroscopy for predicted values in various studies.
| Rapeseed Oil Content | Variance – 0.027 |
| Rapeseed Linoleic Acid | No statistics given |
| Erucic Acid | No statistics given |
| Rapeseed/Mustard Seed Oil Content | R² – 0.94 |
| Moisture | R² – 0.87 |
| Protein | R² – 0.91 |
| Sesame Protein | SEP – 0.827% |
| Soybean Crude Protein | No statistics given |
| Moisture | No statistics given |
| Lipid | No statistics given |
| Ash | No statistics given |
| Carbohydrates | RMSECV – 0.4% to 2.3% for all parameters |
| Soybean Oleic Acid | R² > 0.91 |
| Soybean Amino Acids | R² – 0.83-0.90 |
| Peanut Oil Content | No statistics given |
| Fatty Acids | Residual % Deviation > 5 |
| Peanut Protein | R² – 0.99 |
NIR spectroscopy has been studied for more specific nutritional components as well with mixed results, as the threshold of detection for compounds like tocopherols is often too low to use NIR as a suitable method. However, NIR spectroscopy can be successful in creating prediction profiles and estimated values of low concentration components if parameters like protein and fatty acids can be shown to be correlated with the low concentration compounds. One successful study did correlate glucosinolates , the component in pungent plants like mustard and cabbage, to NIR spectra of Rapeseed/Mustard seeds with an R² of 0.983. Tracing of geographical origin of oilseeds is important as the quality can vary greatly for oilseeds that come from different areas. Visual sorting can be difficult and impractical and due to the variance in nutritional content, NIR spectroscopy has been successful as a tool for determining geographical origin and adulteration detection in oilseeds. As oilseed production and consumption continues to grow worldwide, NIR spectroscopy will continue to emerge as a fast, non-invasive, and cost-effective method for quality control of oilseeds as new applications are developed for its use.
Analysis of Peanut Using Near-Infrared Spectroscopy and Gas Chromatography–Mass Spectrometry: Correlation of Chemical Components and Volatile Compounds
Peanuts contain protein, oil, oleic acid, and linoleic acid and flavor is largely determined by pyrazine and aldehyde compounds. Both the nutritional value and flavor components are important quality control standards. While the nutritional components are proven parameters that can be measured using NIR spectroscopy, flavor components have a concentration below the threshold for NIR correlation. However, correlating detectable compounds to lower concentration compounds is a method for creating profiles that can be used to estimate the lower concentration components. In this study, NIR spectroscopy was examined for determining nutritional components in peanuts and GC-MS was used to isolate and determine volatile compounds with the purpose of identifying the major aroma components so that the nutritional components can correlated with flavor components. This correlation can then enable the use of NIR spectroscopy to predict flavor components. Twelve different peanut cultivars from China were procured for the study. Peanuts were grown, dried in the sun until the moisture content was less than 10%, and then stored at 4°C. Shelled peanuts were scanned using an FT-NIR spectrometer from 12000 cm-1 to 4000 cm-1 using about half a cup of sample in a spinning cup of 5 cm diameter. Calibration models were developed using values from reference tests for the parameters of interest. The range of values for the nutritional compounds in the peanut samples is shown below:
| Oleic Acid | 35.69 g to 82.79 g/100 g oil |
| Linoleic Acid | 2.92 g to 44.19 g/100 g oil |
| Protein | 26.97 g to 33.07 g/100 g raw materials |
| Oil | 45.53 g to 55.53 g/100 g raw materials |
Volatile compounds were extracted using headspace solid-phase micro-extraction. Samples were analyzed in triplicate and were absorbed at the GC-MS injection port for analysis. Identification and compound concentration were determined from a NIST mass spectra library search, the peak area of identified compounds, and an internal standard. In total, fourteen flavor compounds were identified: six pyrazines, four aldehydes, two methyl pyrroles, maltphenol, 2,3-dihydro coumarone, and 4-vinyl-2-methoxy phenol. The pyrazines and aldehydes are the main flavor compounds in roasted peanuts and 2,5-dimethyl pyrazine is most correlated with aroma in previous studies. A Pearson correlation coefficient analysis was performed to determine the relationships between the four nutritional components and the fourteen volatile compounds. The results showed close correlation between various compounds. Pyrazine compounds showed a strong correlation with oleic acid. Aldehydes were incompletely positively correlated with six of the pyrazine compounds. While more work and more peanut varieties would be required before using a model like this in a practical setting, the results show the potential to analyze and develop the relationships between nutrients and flavor in peanuts. The use of NIR spectroscopy in such a quality control model would enable manufacturers to develop simple tests that can predict the flavor of roasted peanuts based on the composition of raw peanuts. Such a model would be hugely beneficial as NIR spectroscopy is far cheaper, faster, and easier to use than GC-MS and similar methods.
Rapid Determination of the Oil and Moisture Contents in Camellia gauchowensis Chang and Camellia semiserrata Chi Seeds Kernels by Near-infrared Reflectance Spectroscopy
Camellia is a native plant to China and one of the most important sources of high quality edible plant oil. It is widely grown with more than twelve million acres in production and annual production exceeds one hundred fifty million kilograms. An essential cooking oil that contains high nutritional value, Camellia has unsaturated fatty acids ranging from 85% to 92% and a variety of other healthy components, such as Vitamin E, phytosterols, squalene, and flavonoids. It is essential to analyze quality characteristics like oil and moisture at harvest and during processing. Traditional methods for analyzing these parameters are expensive, time-consuming, and often require the use of toxic and volatile chemicals. NIR spectroscopy was examined for the purpose of determining oil and moisture in Camellia seeds. One hundred ten samples of each of two separate varieties of Camellia seeds were procured for the study: Camellia gauchowensis Chang and Camellia semiserrata Chi seeds. Each individual sample weighed approximately two hundred grams. In order to ensure that the models accounted for variability in samples and encompassed a large range for the parameters of interest, samples were selected from five separate growing regions. Seeds were planted, collected upon ripening, dried, dehulled, and stored with proper ventilation and humidity. Reference values were determined for oil using Soxhlet extraction and moisture using oven drying. NIR spectra were collected from 950 nm to 1650 nm at a 5 nm scan interval. Each sample was scanned in triplicate and the three spectra were averaged into a single spectrum. Various preprocessing methods were applied to the spectral data before chemometric modeling. Principle Component Analysis (PCA) was performed for outlier analysis and to check variability in the spectra. Partial Least Squares (PLS) calibration models were created for oil and moisture for the two separate varieties of seeds. Results are shown below.
Camellia gauchowensis Chang
| Oil | R² = 0.98 |
|---|---|
| Moisture | R² = 0.92 |
Camellia semiserrata Chi
| Oil | R² = 0.95 |
| Moisture | R² = 0.89 |
The results of this study proved the feasibility of using NIR spectra and chemometric models to determine oil and moisture content in two separate varieties of Camellia seeds. Correlation coefficients were high and considering the relative small sample set and different varieties used, the models showed the potential for developing NIR spectroscopy as a large scale quality control method for Camellia seeds. Large-scale testing using traditional methods is impractical and NIR spectroscopy could be used as a tool to facilitate quality control as well as improve the economics of Camellia seed trading.
Nondestructive On-Site Detection of Soybean Contents Based on An Electrothermal MEMS Fourier Transform Spectrometer
Soybeans are a significant source of plant oils and proteins. They are widely used in both food and industry. Fat, protein, and moisture are very important quality control parameters in soybeans. Protein is especially important because the price of soybeans in international trade markets is often determined by protein content. While traditional methods for determining these parameters are accurate, they are impractical for implementing on a large scale. There is a need for a quick and accurate method for determining quality parameters in soybeans that can be used for on-site analysis. In this study, a MEMS-FT portable spectrometer was used to determine the feasibility of determining fat, protein, and moisture in soybeans. Three hundred and fifty-eight soybean samples from different growing areas were procured for the study. Each sample weighed approximately two hundred grams. Samples were scanned from 1000 nm to 2500 nm. A portion of each sample was loaded into the sampling cup and scanned three separate times. The three spectra per sample were then averaged into a single spectrum. Traditional reference tests were performed to determine reference values for fat, protein, and moisture. Various preprocessing methods were performed on the spectral data before chemometric modeling. 80% of the samples were chosen as a calibration set for modeling. Partial Least Squares (PLS) models were created correlating the NIR spectra to fat, protein, and moisture. The remaining 20% of the samples were used as a validation set and independent predictions were performed used the spectra of these samples and the calibration models.
| Moisture Range – 5.1% to 11.9% | R² = 0.92 | SEP – 0.31% |
| Protein Range – 32.8% to 49.3% | R² = 0.92 | SEP – 0.56% |
| Fat Range – 15.1% to 22.3% | R² = 0.85 | SEP – 0.69% |
Correlation is good for all three calibration models and the independent sample set predictions proved the validity of the models. All predictions were within 3% error of the reference test values for all parameters. Other statistical analysis and values offer further proof that the models are valid, such as high values for RPD. This study showed that a portable MEMS-FT spectrometer can be used for accurate on-site testing of fat, protein, and moisture in soybeans in a fast, non-invasive manner that can be implemented on a large scale.
Nondestructiv-1e Near-Infrared Reflectance Spectroscopic Analyses of the Major Constituents of Sesame(Sesamum indicum L.) Whole Seeds with Different Coat Color
Sesame is an important oilseed plant and has gained considerable attention in Japan as an alternative crop to rice. A need exists for a rapid testing of quality parameters in sesame seeds for breeding selection. NIR spectroscopy was examined as a method for determining fat, oil, and moisture in sesame seeds and seeds of different colors were specifically chosen to determine if color affected NIR spectroscopic analysis. Thirty different kinds of samples were collected by the Seed Bank Project of Japan International Cooperation Agency and fifty-two other samples of different varieties and breeding lines were obtained from the National Institute of Crop Science. These samples included yellowish-brown, dark brown, black, and white coated seeds. NIR spectra were collected from 1100 nm to 2500 nm at 2 nm intervals. Each sample was scanned in three separate positions and the three spectra were averaged into a single spectrum per sample. Traditional methods were used to determine reference values for fat, protein, and moisture. Various preprocessing methods were applied to the spectral data before chemometric modeling. Visual examination of the NIR spectra showed a marked difference between the spectra of the black seeds and the other three groups. Partial Least Squares (PLS) calibration models were created correlating the NIR spectra to moisture, oil, and protein in the sesame seed samples.
| Moisture | R² = 0.979 | SEP = 0.318% |
| Oil | R² = 0.931 | SEP = 1.234% |
| Protein | R² = 0.939 | SEP = 0.830% |
The results of this study proved the feasibility of measuring moisture, oil, and protein in sesame seeds from NIR spectra and calibration models. Cross-validation was used for independent predictions and prediction results showed good correlation between the NIR method and reference values. Most importantly, the different colors of the sesame seeds did not appear to have an effect on modeling results. Results shown in this study are similar to other studies that used NIR spectroscopy to measure these parameters. NIR spectroscopy can be used to determine major constituents in sesame seeds that can make a quick and non-invasive analysis of the seeds for breeding selection.
Near-Infrared Spectroscopy Combined with Multivariate Calibration to Predict the Yield of Sesame Oil Produced by Traditional Aqueous Extraction Process
Sesame is one of the main oil crops in China and Asia. It is cultivated in tropical and subtropical regions with over 7.5 million hectares of crops and annual seed yield exceeds over three million tons. China accounts for approximately a quarter of all worldwide sesame production. It is rich in many fatty acids including oleic, linoleic, palmitic, and stearic acids. It is popular for health benefits, reported oxidative stability, and a unique and pleasant aroma and flavor which makes it recognized as a top-grade vegetable oil. While mechanical pressing or solvent extraction are used for large scale production of sesame oil and these methods do obtain a high oil yield, they also degrade quality because of heat treatment. They denature the proteins in the meal as well which is used as feedstock for animals. An alternative method for these oil extraction methods is Traditional Aqueous Extraction Process (TAEP), which grinds sesame seeds at low temperature and adds pure water to replace the oil from the sesame sauce. While this method improves oil quality, it does reduce yield. It is beneficial for sesame oil manufacturers to find high quality seeds when using TAEP, but no rapid and effective method that can be implemented on a large scale exists for this purpose. In this study, NIR spectroscopy was used to develop multivariate calibration models that can predict TAEP oil yield from NIR spectra. One hundred and forty-five sesame seed samples from nine different producing areas and multiple markets in China were procured for the study. All seeds were harvested in the same year and consisted of five different colors. Black seeds were excluded from the study because they have a higher price and are rarely used for oil extraction. Seeds were dried in the sun and stored under cool and dark conditions before scanning. All seeds were scanned using an FT-NIR spectrometer from 12000 cm-1 to 4000 cm-1 at 4 cm-1 resolution and at a 1.929 cm-1 interval. Sixty-four scans were collected per reading and averaged into one spectrum. This process was repeated three times for each sample and the three spectra were averaged into a single spectrum per sample. After NIR spectra were collected, all seed samples were extracted in an oil mill using the TAEP method. Oil yield was calculated by dividing the net weight of oil obtained by TAEP by the net weight of sesame seed. Various preprocessing methods were applied to the spectral data before chemometric modeling, including an algorithm to separate the spectra into a training and test set. Least-Squares Support Vector Machines (LS-SVMs) calibration models were created using the pre-processed spectra and different wavenumber ranges to correlate the NIR spectra to oil yield. Results are shown below.
| Oil Yield | RMSEP = 1.15% w/w | (Smoothing, SNV, 2nd derivative, 9000 cm-1 to 4000 cm-1) |
The results of this study were excellent and proved the feasibility of using NIR spectroscopy to determine oil yield from the TAEP process by using NIR spectra of sesame seeds and a calibration model. The RMSEP shown here was the lowest after using many different preprocessing algorithms and wavenumber ranges. The transformations used can help remove unwanted variations in the raw spectra as well as reduce the effects of baseline shifts, noise, and particle size differences. This model provides a practical method for using NIR spectroscopy to predict oil yield in sesame seeds, enabling manufacturers to choose high quality seeds when using TAEP for sesame oil manufacturing.
Use of Near-Infrared Spectroscopy for Estimating Fatty Acid Composition in Intact Seeds of Rapeseed
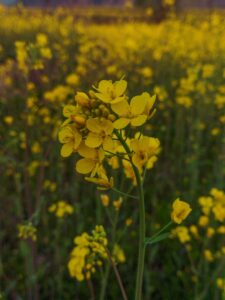 Rapeseed is one of the most important and widely produced oilseed crops used as a source of vegetable oil and as a substitute for fossil diesel fuel. Protein and fatty acid profile are important quality parameters when rapeseeds are processed into edible oil for humans, meal for livestock and poultry feed, and industrial biodiesel. The oil in rapeseed is approximately 40% of the seed weight and is comprised of numerous fatty acids, including unsaturated fatty acids like palmitic, stearic, oleic, linoleic, linolenic, eicosenoic, and erucic acids. Research is being conducted to develop new genotypes for quality breeding of rapeseeds and determining the fatty acid composition in a large number of breeding lines is required for such research. The traditional method for determining fatty acid profiles is chromatography which is time-consuming, expensive, and requires sample destruction. There is a need for a fast, non-invasive method for determining fatty acid profiles in rapeseed and NIR spectroscopy was examined for this purpose. Three hundred forty-nine samples of rapeseed germplasm were procured for the study. Each sample contained about two grams of seeds. All samples were scanned using an NIR spectrometer from 400 nm to 2500 nm at 2 nm intervals. Reference testing to determine fatty acid profiles for the samples was conducted using Gas/Liquid Chromatography, a process that took about twenty minutes for each sample and expressed individual fatty acids as a percentage of the total fatty acids. Various preprocessing methods were applied to the spectral data before chemometric analysis. The samples were split into two sets: two hundred and forty-nine samples for a calibration set and one hundred samples for a validation set. Shown below are the ranges of values expressed by percentage of total fatty acids for samples, the mean values, and modeling statistics.
| Sample | Range | Mean | R² | SEC |
|---|---|---|---|---|
| Palimitic | 2.0 to 7.4 | 4.01 | 0.795 | 0.355 |
| Stearic | 0.8 to 3.7 | 1.61 | 0.850 | 0.193 |
| Oleic | 6.2 to 70.4 | 32.9 | 0.980 | 2.679 |
| Linoleic | 5.7 to 26.3 | 15.9 | 0.908 | 1.005 |
| Linolenic | 1.8 to 13.6 | 7.70 | 0.848 | 0.626 |
| Eicosenoic | 0.6 to 29.6 | 9.00 | 0.509 | 3.701 |
| Erucic | 0.0 to 62.9 | 28.8 | 0.983 | 2.606 |
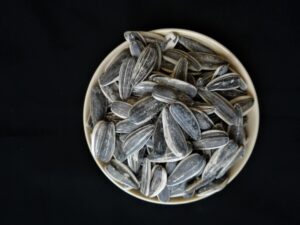 Results were excellent for oleic, linoleic, and erucic acids and independent predictions using the validation set proved the validity of these models. The results were worse for the other four types of fatty acid, especially eicosenoic acid, and this likely occurred because the mean values of the percentage of fatty acids for these types is below 10%, making their concentration below the level of detection for NIR analysis. However, more calibration work and a larger sample set may improve the results enough to create models that can be used for screening purposes. It must be noted that seventy of the samples contained 0% erucic acid and a more evenly distributed sample set should be used for a calibration model before this application is used in a practical setting. Erucic acid concentration is very important because studies have shown high concentrations of it can cause heart disease in rats and the use of products containing it is strictly regulated. Mustard oil is banned from sales and imports in many countries because of a high erucic acid concentration and rapeseed oil must have an erucic acid concentration below 2%. The potential was demonstrated to use NIR spectroscopy as a fast and non-invasive method for determining oleic, linoleic and erucic acid in rapeseed seeds.
Characterisation of Castor (Ricinus communis L.) Seed Quality Using Fourier Transform Near-Infrared Spectroscopy in Combination with Multivariate Data Analysis
Castor is a non-edible oil seed crop that is used for biodiesel production. The oil in castor seeds accounts for 42% to 58% of the total weight and the oil is more than 90% ricinoleic acid, an acid that enables it to dissolve in alcohols at a low temperature. This property makes castor oil advantageous over other vegetable oils for biodiesel production because less energy is required for transesterification to reduce oil viscosity. Castor is also known for variation in maturity stages at harvest because of differences between racemes. The final harvest can consist of seeds of different size, weight, and physiological maturity, leading to differences in quality. Heavier seeds contain more oil and the seed weight can be positively correlated with the germination ability of the seeds. NIR spectroscopy was examined as a method for characterizing castor seeds based on viability and oil content. Two sample sets were procured for the study: Three hundred castor seeds from two separate ecotypes that were grown under both controlled and water-stressed conditions and twelve hundred seeds for the two ecotypes that were individually weighed and classified by weight. The three seed weight groups were light (less than 0.1455 g), medium (0.1455 g to 0.2348 g), and heavy (greater than 0.2348 g). Individual seeds were scanned using an FT-NIR spectrometer from 965 nm to 1701 nm. 32 cm-1 resolution was used and scans were collected at 2 nm intervals. Sixty-four scans were collected per reading and averaged into one spectrum per seed. After NIR spectra were collected, the seeds from the first sample set were placed on wet filter paper for germination. After visual inspection for fourteen days, the seeds with radicle protrusion greater than 2 mm were classified as germinated. For classification purposes, the non-viable seeds were assigned an arbitrary value of 0 and the viable/germinated seeds were assigned a value of 1. Principle Component Analysis (PCA) was performed to analyze spectral differences between the groups. A Partial Least Squares Discriminant Analysis (PLS-DA) model was created using the NIR spectra of the first set of samples and the arbitrary numbers. A PLS-DA model predicts the arbitrary number from the NIR spectra and uses the predicted value to classify the sample into one of the groups.
| PLS-DA | 99.6% Prediction Accuracy | 1.1% Classification Error |
The results of this study proved the feasibility of classifying viable and non-viable castor seeds using NIR spectra and a PLS-DA model. The PCA analysis showed that the light seeds from the second sample set grouped well with the non-viable seeds from the first set while medium and large seeds grouped well with the viable seeds. This is especially important analysis for castor seeds because of the marked variation of seeds during harvesting. NIR spectroscopy has potential to sort castor seeds based on viability as a quality control tool to ensure that only viable seeds are used for oil extraction in a manufacturing setting.
Rapid Analysis of Geographical Origins and Age of Torreya grandis Seeds by NIR Spectroscopy and Pattern Recognition Methods
Torreya is a rare cash crop tree found in southern and eastern China. It is well-known as a potent folk medicine and contains a number of rich components that possess biological and medical activities. Seeds are potent in proteins, fatty acids, carbohydrates, calcium, phosphorus, and iron. They are served as a high quality nut and cakes, biscuits, and candies are made from the seed kernels. Oil content of the seeds is between 55% and 61% of the total weight and is bright yellow with pleasant fruit flavors. Nearly 80% of the fatty acids are unsaturated. Because torreya seeds are such a valuable product, they are subject to adulteration through mislabeling of the province of origin and the age of the seeds. It is known that some provinces in China grow higher quality seeds than other places and one in particular, Zhuji, maintains a Protected Geographical Indication (PGI) and is known for the extra high quality of the seeds. Two other provinces, Anhui and Jiangxi, grow seeds that are similar in appearance but have an inferior taste and texture to Zhuji. Seeds that are aged tend to oxidize and spoil, making any extracted oil much lower in quality. NIR spectroscopy was examined for the purpose of discriminating Torreya seeds based on province and age. Two hundred forty samples from the three previously mentioned provinces were procured for the study. Samples came from different growing areas within the three provinces and some samples from one particular province were designed as old while the remainder of the samples were designated as fresh. Seeds were scanned from 12000 cm-1 to 4000 cm-1 using an FT-NIR spectrometer. Scanning interval was 7.714 cm-1. Various preprocessing methods were applied to the spectral data before chemometric analysis. Principle Component Analysis (PCA) was performed for outlier detection and to analyze differences in the spectral data. Partial Least Squares Discriminant Analysis (PLS-DA) was performed for classification of the samples based on both geographical origin and age discrimination.
Geographical Origin
| Sensitivity = 1 | Specificity = 1 | Classification Rate – 100% Correct |
Age Discrimination
| Sensitivity = 0.939 | Specificity = 0.871 |
Perfect results were obtained for classifying the seeds based on geographical origin using NIR spectra and the PLS-DA model. The model for age discrimination did not show results as good as the geographical origin model, but they are still considered sufficient for screening purposes. One possible reason for this is that the aged samples only came from one province and the fresh samples also contained samples from this province, while all samples from the other two provinces were fresh. Better distribution of aged and fresh samples from different provinces and growing areas may improve the results. The potential was demonstrated to use NIR spectroscopy as a tool for classifying Torreya seeds based on geographical origin and age.
Near-infrared reflectance spectroscopy reveals wide variation in major components of sesame seeds from Africa and Asia
Sesame is an important oilseed crop in both Asia and Africa because of high nutritional value and market value. Many natural products can show marked variation in quality depending on the area of the world they are grown in, as well as in different areas of the same country. NIR spectroscopy is one potential tool for determining variation in natural products because it is fast, non-invasive, does not require the use of toxic chemicals and solvents, and has the ability to measure multiple parameters with a single light scan. In this study, NIR spectroscopy was used to examine the variation in sesame seeds from different countries in Asia and Africa. A total of one hundred thirty-nine samples of cultivated sesame from twenty-eight different countries (fourteen in Africa and fourteen in Asia) were procured for the study. The samples encompassed different landraces and were all considered elite modern cultivars. All samples were scanned using an NIR spectrometer from 1100 nm to 2500 nm at an interval of 2 nm and were scanned in duplicate. Prebuilt calibration models for light and dark seeds were loaded into the spectrometer software. The models predicted oil, oleic acid, linoleic acid, and protein in the samples. For some samples, traditional reference tests were performed for the purpose of comparing the reference values to the values predicted from the NIR calibrations. There was good agreement between predicted results from the NIR method and the traditional reference tests. Analysis revealed interesting variation among the samples. Light seeds displayed higher nutritional quality as they had higher values of protein, oil, and linoleic acid than dark seeds. Samples from Africa had higher oil and linoleic acid contents, while the Asian samples had higher oleic content. West African samples had particularly high values for nutritional components, giving them potential for increased market value. Overall, the results of this study showed that NIR spectroscopy can be used to determine variation in sesame seeds from different areas in the world. Samples from Africa and Asia showed high variation in nutritional components. Similarly, a study like this could be used to determine ideal sesame seed samples for breeding programs.
The post Oilseeds Analysis appeared first on NIR-For-Food.
]]>The post Flour Analysis appeared first on NIR-For-Food.
]]>Introduction
Flour is an important staple food in many parts in the world and is used to make numerous types of food, such as bread, pasta, noodles, crackers, cakes, and pastries. While wheat accounts for around 85% of all global flour products, other types of flour are made such as rice, oat, corn, and potato, especially in parts of the world where wheat is not easily grown. It is a significant source of starch and carbohydrates. Cereal flour consists of the endosperm, germ, and bran together (also known as whole-grain flour) while refined flour is the endosperm alone. The flour milling process can be complex based on the desired product and proper milling and blending requires skilled millers, even in large plants. As is the case with all agricultural products, proper processing, storage, and transport are essential. The proper product and food it is best suited to make is very much dependent on the quality control parameters and nutritional composition of the desired product. For example, high gluten protein flour is best suited for making breads and results in a harder and stronger flour. Low gluten protein flour is softer and better suited for baked goods. There are different classifications of flour based on the protein content. Extraction yield measured by ash is another significant quality parameter. The use of NIR spectroscopy to determine ash content in flour is a certified AACC method. Whole-grain flour has a higher nutritional content and an extraction yield typically close to one hundred percent. Refined flour (almost always treated to make it white and subsequently fortified with nutrients) has a lower extraction yield between 50% and 70% because it only contains the endosperm. Like many foods, flour is subject to adulteration. Different species and brands can vary greatly in nutritional content and market value. Visual differentiation is especially difficult for white flours and standard methods using wet chemistry are impractical to implement, especially in small markets. While gluten-free flour products do exist, the prevalence of wheat flour which does contain gluten creates a need to develop gluten-free wheat products including flour. Genetic engineering and transgenic wheat are a subject of research for this purpose, but the practice is controversial and no gluten-free wheat flour product has been approved for commercial use. There is a need to develop fast, non-invasive testing methods to meet the evolving challenges in producing quality flour. One such method that has been examined is NIR Spectroscopy.
Analytes
- Moisture
- Protein
- Fat
- Total Polyphenol Content (TPC)
- DPPH radical scavenging activity
- Ash
- Amylose
- Resistant starch
- Digestible starch
- Total starch
- Blend content in potato and wheat flour blends
- Flour species classification
- Oat flour adulteration
- Tuber flour discriminant analysis
Summary of Published Papers, Articles, and Reference Materials
Near-Infrared Reflectance Spectroscopic Analysis of Moisture, Fat, Protein, and Physiological Activity in Buckwheat Flour for Breeding Selection
 Soba noodles made from buckwheat are a popular food in Japan and are considered nutritious because of high mineral and protein content. While standard nutritional parameters such as moisture, fat, and protein have been analyzed extensively, such methods can involve expensive and time-consuming wet chemistry tests and provide insufficient data for breeding projects. Breeding projects aim to improve grain yield through plant structure improvement and the necessary analysis is far too difficult for a large number of breeding lines. NIR spectroscopy was examined as method for determining moisture, fat, and protein in both common buckwheat and tartary buckwheat as well as for the physiological activity parameters Total Polyphenol Content (TPC) and DDPH radical scavenging activity in common buckwheat flour. Common and tartary buckwheat grain samples from three consecutive harvest seasons were procured for the study. Most samples came from different areas of Japan but many other countries were included, such as Canada, China, France, Nepal, Pakistan, and Russia. Grain was milled, sieved, and stored as flour at 5°C until analysis. NIR spectra were collected from 1100 nm to 2500 nm at 2 nm intervals. After scanning, standard reference tests for moisture, fat, protein, Total Polyphenol Content, and Radical Scavenging Activity were performed on the samples. For the first three parameters, samples from the first two harvest seasons were used for the tests while the third harvest season samples were used for the physiological activity tests. Various pre-processing methods were performed on the NIR spectra before chemometric modeling. Based on initial data analysis of the NIR spectra, significant wavelengths were chosen and Multiple Linear Regression (MLR) analysis was performed on the data to correlate the moisture, fat, protein, and physiological activity parameters to the NIR spectra.
| Moisture | R² = 0.918 | SEP= 0.147% |
| Fat | R² = 0.969 | SEP= 0.095% |
| Protein | R² = 0.957 | SEP= 0.389% |
| Total Polyphenol Content | R² = 0.938 | SEP= 0.164 GA Equivalence |
| DDPH Radical Scavenging Activity | R² = 0.973 | SEP= 0.915 Trolox Equivalence |
Results were excellent for moisture, fat, and protein and proved the feasibility of using NIR spectroscopy as a method for measuring these parameters in buckwheat flour. A separate validation set verified the validity of the models. The physiological activity parameters warrant closer examination. Units for both of them are expressed as values determined in the standard reference tests – mg-GA Equivalence/g for TPC and nmol-Trolox Equivalence/g for the DPPH radical scavenging activity. While the R² correlation coefficients are high, validation predictions showed that the NIR method was suitable for measuring the component in Total Polyphenol Content but not the actual activity. However, an estimation of radical scavenging activity can be made from TPC and such an estimation can be used for simple and rapid breeding selection. Overall, this study showed that moisture, fat, and protein can be determined at a level sufficient for quality control and physiological activity can be estimated at a level sufficient for quality evaluation using NIR spectroscopy. CiNii Articles - Near-Infrared Reflectance Spectroscopic Analysis of Moisture, Fat, Protein, and Physiological Activity in Buckwheat Flour for Breeding Selection
Application of Near Infrared Transmission for the Determination of Ash in Wheat Flour
Ash is an important constituent for wheat flour quality and an indicator of flour purity. Even under optimum conditions, the milling process cannot fully separate the starchy endosperm from the bran. Ash indicates how completely and efficiently the endosperm has been separated from the bran and is defined as the mineral residue of flour determined by oven burning. While a standard and simple method, it is time-consuming and a quick method for ash determination has always been a need for the milling industry. NIR spectroscopy was examined for this purpose and using NIR spectroscopy to determine ash content in flour is a certified AARC method. One hundred and thirteen wheat flour samples from four separate mills were procured for the study. A NIR analyzer with a pre-built calibration for ash was used to scan the samples from 850 nm to 1050 nm. The calibration is designed to work for ash values from 0% to 1.10%. Using the collected spectra and calibration model, values were calculated for ash of the samples. A standard reference test was then used to determine the ash content of all samples. By definition, ash is the quantity of mineral matter which remains as an incombustible residue of the tested substance. Samples were burned to ashes at 900°C and the ash quantity was expressed to dry matter.
| Ash | R² = 0.954 | SEP= 0.054% |
The correlation coefficient showed good agreement between the NIR method and traditional reference method for ash. The SEP was higher than expected but some factors were likely the cause of this. The error was very low for samples from certain mills while higher for others. When using pre-built calibrations, a bias and slope correction is often necessary when using different types of samples and this analysis was not performed in this study. It is also known that ash content better correlates to higher wavelengths in the NIR spectrum and the range of the spectrometer used in this study was limited. Other studies have shown a much lower SEP and an R² as high as 0.99. More calibration work is necessary but this study showed the feasibility of using an NIR spectrometer and a pre-built calibration model to determine ash content in wheat flour. Application of Near Infrared Transmission for the Determination of Ash in Wheat Flour – CORE
Simultaneous Determination of Ash and Protein Contents in Wheat Flour Using NIR-PLS and DRIFT-PLS
 Protein and ash are two essential quality control parameters in flour. The protein level is important for determining whether a flour is better suited for a bread or baked good product. Higher protein makes a flour harder and more binding while lower protein makes a flour softer and more refined. Ash is a good indicator of extraction yield and whole-grain starch has a much higher extraction yield than white flour because it still contains the mineral parts of the outer section of the grain. A need exists for a fast, non-invasive method for determining protein and ash content in wheat flour and NIR spectroscopy was examined for this purpose. One hundred samples of wheat flour from different mills were procured for the study. Reference tests indicated that the protein values ranged from 8.85% to 13.23% and the ash values ranged from 0.330% to 1.287%. The traditional methods of Kjeldhal for protein and gravimetric were used for ash. NIR spectra were collected using an FT-NIR spectrometer. Various pre-processing methods were applied to the spectral data before chemometric analysis. Partial Least Squares (PLS) calibration models were created using the NIR spectra and reference values for protein and ash.
| Protein | R² = 0.998 | SEC= 0.33% |
| Ash | R² = 0.997 | SEC= 0.07% |
The modeling results were validated using cross-validation and the predictions showed that the models could be used to accurately determine protein and ash content in wheat flour. The potential exists for NIR spectroscopy to replace traditional expensive and time-consuming methods for determining ash and protein in wheat flour. (PDF) Simultaneous determination of ash content and protein in wheat flour using infrared reflection techniques and partial least-squares regression (PLS) (researchgate.net)
Simultaneous Estimation of Amylose, Resistant, and Digestible Starch in Pea Flour by Visible and Near-Infrared Reflectance Spectroscopy
Pea is one of the major legumes in the world and production of peas has greatly increased over the last decade in the Northern Great Plains area of the United States. Much of the pea product produced in the United States is exported to Asia and while dry pea is not considered a major starch source compared to other precursors of flour, it is widely processed into noodles. After mung bean, pea starch is considered the second best source of all grain legumes for processing starch noodles. Starch consists of amylose and amylopectin and based on digestibility, pea starch can be classified into digestible starch (DS) and resistant starch (RS). RS is resistant to digestion in the small intestine and can be fermented in the colon to produce short-chain fatty acids, which may lead to health benefits. Research shows that higher amylose levels are correlated with RS. A need exists to determine RS content in flour, but traditional methods are expensive, time-consuming, and are impractical for implementing for large-scale testing. NIR spectroscopy was examined for determining starch contents in pea flour. One hundred twenty-three pea seed samples from Montana were procured for the study and ground into flour. A Vis-NIR spectrometer that scans from 200 nm to 1080 nm and 900 nm to 2300 nm was used to scan the samples. Each sample was scanned from 300 nm to 900 nm and 900 nm to 2300 nm and both wavelength ranges were combined into a single spectrum for each sample. Standard reference tests were used to determine amylose, RS, and DS for the sample. Total starch was calculated from the sum of RS and DS. Various pre-processing methods were performed on the spectral data before chemometric analysis. Partial Least Squares (PLS) calibration models were first created using the full spectral range to determine the wavelength bands of interest. The relevant wavelength ranges were then used to create Multiple Linear Regression (MLR) models, which only use specific wavelengths to correlate the spectral data to the parameters of interest.
| Amylose | R² = 0.97 |
| RS | R² = 0.80 |
| DS | R² = 0.85 |
| Total Starch | R² = 0.93 |
Results for the MLR models showed good correlation and the cross-validation results were in good agreement with the reference values for the samples. Each model used between eight and thirteen different wavelengths for the correlation. This study showed the feasibility of using NIR spectroscopy to determine starch parameters in pea flour. For use in a practical setting, more calibration work and a larger sample set would likely help to improve the results. https://www.tandfonline.com/doi/pdf/10.1080/10942912.2018.1485027
Development of a Predictive Model to Determine Potato Flour Content in Potato-Wheat Blended Powders Using Near-Infrared Spectroscopy
Potato is a good source of dietary energy and micronutrients. The development of staple foods using blends of potato flour and wheat flour has become prevalent in recent years, especially in China. Because flour is a worldwide staple food, it can be subject to adulteration and there is a need for fast, non-invasive, and large-scale testing methods to both prevent adulteration and to determine quality for market regulation purposes. NIR spectroscopy is a proven method for determining quality parameters in potatoes, such as dry matter, starch, protein, and sugar. For the first time, NIR spectroscopy was examined as a method for quantifying potato flour content in blends of potato flour and wheat flour. Both potato flour and wheat flour were purchased from a local manufacturer for the study. Blends were prepared by mixing wheat flour with potato flour at 1% by weight increments from 0% to 100% wheat flour for a total of one hundred and one samples. Samples were mixed in a mixer. Some samples were split in half to use as validation samples. Samples were scanned from 890 nm to 1100 nm. Three spectra were collected per sample and averaged into one spectrum. Various pre-processing methods were applied to the spectral data before chemometric modeling. A Partial Least Squares (PLS) calibration model was created correlating the NIR spectra to the percentage of potato flour in the blends. In total, ninety-two samples were used for the calibration model and fifteen were used for independent predictions.
| Potato Flour Content | R² = 0.9995 | SEP= 0.69% |
While the correlation coefficient for determining the potato flour content was high and the SEP was low, the results shown here warrant closer examination. It is possible that the calibration model is actually correlating to the changes in blend content but with only two sets of samples used, this is unclear and unproven. If the two sets of samples have any differing chemical and physical properties (such as moisture) and they are being blended together with the ratio of those properties changing, the model may very well be correlating to something else entirely besides the blend content. For further validation, this study should be conducted incorporating different sources of variability into the potato flour and wheat flour samples. Samples procured from different growing areas, different manufacturers, and different harvests would prove that the calibration model was actually determining blend content and not correlating to another property. Development of a predictive model to determine potato flour content in potato-wheat blended powders (tandfonline.com)
Quantitative Analysis of Adulterations in Oat Flour by FT-NIR Spectroscopy, Incomplete Unbalanced Randomized Block Design, and Partial Least Squares
Oat is a widely utilized food for both human consumption and industrial uses. It has high nutritional value and a characteristic flavor. Oat flour is an important food in breakfast cereals and offers an alternative to wheat flour. However, the yield when producing oat flour is less than that of wheat flour, making oat flour more expensive than wheat and some other types of flour. The appearance of oat and wheat flours is similar, making oat flour subject to adulteration with wheat flour. A need exists for a fast, non-invasive method that can be implemented on a large scale to determine adulteration of oat flour and NIR spectroscopy was examined for this purpose. Sets of oat and wheat kernels were procured from domestic markets in China, all coming from the same harvest season. In total, oat kernels came from five separate markets and wheat kernels came from seven separate markets. The kernels were dried, milled, and filtered through a sieve to make flour. Adulterated oat flour samples were created by adding increments of 5% weight of wheat flour to oat flour. Samples ranged from pure oat flour with 0% wheat flour to 50% oat flour and 50% wheat flour. In total, one hundred twenty samples were prepared for developing calibration models and another one hundred samples were prepared for model validation. NIR spectra were collected using an FT-NIR spectrometer. Samples were scanned from 12000 cm-1 to 4000 cm-1 at 4 cm-1 resolution at a scanning interval of 1.929 cm-1. Sixty-four scans were collected per reading and averaged into one spectrum. After the first spectrum was collected for a sample, the powder was mixed, another spectrum was collected, and then this process was repeated for a total of three spectra per sample, which were then further averaged into one spectrum. Various pre-processing methods were applied to the spectral data before chemometric modeling.
| Wheat Flour Adulteration | RMSEC= 1.781% |
The results of this study were excellent, especially when considering that the samples used were from different markets. The independent predictions proved the validity of the model and showed that wheat flour adulteration in oat flour can be accurately predicted from NIR spectra and a calibration model to an accuracy of around 2%. NIR spectroscopy offers a fast, non-invasive, and cost-effective method for determining adulteration in oat flour that can be implemented for large-scale testing. Quantitative Analysis of Adulterations in Oat Flour by FT-NIR Spectroscopy, Incomplete Unbalanced Randomized Block Design, and Partial Least Squares (hindawi.com)
Discrimination of Cassava, Taro, and Wheat Flour Using Near-Infrared Spectroscopy and Chemometrics
 Different species of flour can differ in many ways, such as nutritional value and market price. However, they often do not differ in appearance, making them subject to adulteration. One example of this is taro flour, which is obtained from taro tubers and has a high starch, protein, and fiber content compared to some other types of flour. In Indonesia, taro flour has a higher market price than some common species of flour, such as wheat flour and cassava flour. NIR spectroscopy was examined as a method for discriminating between taro, wheat, and cassava flours. Taro flour samples were made by obtained taro tubers which were washed, drained, sliced, dried in an oven, and then grounded and sieved to make flour. Cassava flour was prepared in a similar fashion except the tubers were not soaked in water. Wheat flour samples were purchased from a local market. Samples were scanned from 1000 nm to 2500 nm using an NIR spectrometer. Resolution was 4 cm-1. Each sample was scanned three times and the three spectra were averaged into one spectrum per sample. Various pre-treatment methods were applied to the spectral data before chemometric analysis. Principle Component Analysis (PCA) was first performed to establish a grouping pattern and examine variance between the three groups of samples. Discriminant Analysis (DA) was used to create a model to determine if the groups can be classified based on NIR spectra.
| Taro | Samples – 16 | Correct Predictions – 16 |
| Cassava | Samples – 13 | Correct Predictions – 13 |
| Wheat | Samples – 9 | Correct Predictions – 9 |
The results of this study were excellent and proved that NIR Spectroscopy and a classification model can be used to determine if a flour sample is taro, cassava, or wheat. The independent predictions were correct at a perfect 100% rate. NIR spectroscopy offers a fast, non-invasive, non-destructive, and accurate method for discriminating between these three types of flour. Discrimination of cassava, taro, and wheat flour using near-infrared spectroscopy and chemometrics | Rafi | Jurnal Kimia Sains dan Aplikasi (undip.ac.id)
Application of Fourier Transform Near-Infrared (FT-NIR) and Fourier Transform Infrared (FT-IR) Spectroscopy Coupled with Wavelength Selection for Fast Discrimination of Similar Color of Tuber Flours
Tubers are a major food in Indonesia and are usually consumed as an alternative food to rice. They are rich in carbohydrates and a source of a number of valuable nutritional components. They have a high metabolic activity after harvesting and are more perishable than grains. Because of this, they are usually processed into flours to prolong shelf-life. In flour form, they are used for standard foods like noodles, biscuits, snacks, and bread. Three prominent species of tubers are very similar in appearance but vary in market and nutritional value: Canna edulis, modified cassava, and white sweet potato. Visual differentiation is nearly impossible and traditional methods using chemical analysis to determine the type of tuber flour are expensive and impractical for implementing for large-scale testing. Both NIR and IR spectroscopy were examined as a method for differentiating between these three species of flour tubers. Samples of all three types of tubers were procured from ten different sellers for the study. In total, three samples were taken from each purchased flour, making for thirty samples for each type of tuber and a total of ninety samples. All samples were scanned using an FT-NIR spectrometer from 10000 cm-1 to 4000 cm-1 at 4 cm-1 resolution. Thirty-two scans were collected per reading and averaged into one spectrum. The wavenumber range for the IR spectrometer was from 4000 cm-1 to 650 cm-1. Various pre-processing methods were applied to both sets of spectral data and a PLS-DA (Partial Least Squares-Discriminant Analysis) model was created for both the NIR and IR spectral data sets.
| NIR | R² = 0.999 | SEP = 0.03 |
| IR | R² = 0.999 | SEP = 0.08 |
A PLS-DA model uses arbitrary numbers for classification analysis and as shown, the results were excellent for both the NIR and IR models. Cross-validation was used to prove the validity of the models and all predictions chose the correct type of flour at 100% accuracy. NIR and IR spectroscopy can used to classify different types of flour tubers and offer a fast and non-invasive method for properly classifying flours that cannot be easily discriminated without using expensive and time-consuming chemical tests. Application of Fourier Transform Near-Infrared (FT-NIR) and Fourier Transform Infrared (FT-IR) Spectroscopy Coupled with Wavelength Selection for Fast Discrimination of Similar Color of Tuber Flours | Masithoh | Indonesian Journal of Chemistry (ugm.ac.id)
The post Flour Analysis appeared first on NIR-For-Food.
]]>The post Corn Analysis appeared first on NIR-For-Food.
]]>Introduction
Corn is not only an important staple food for human consumption but is used to create many different types of products and by-products. These include animal feed, biofuel, corn starch, corn oil, and many different forms of corn syrup. More corn is produced than any other cereal plant worldwide. Sweet corn has become particularly appealing to consumers for its good taste and high nutritional content. Corn is comprised of four parts: endosperm, germ, pericarp, and tip cap, all showing distinct characteristics and containing different portions of the precursors of corn products. There are many different biotypes that can be grown in different parts of the world under varying climate conditions. Demand for corn is increasing rapidly and market growth is expected to be strong over the next decade, especially for animal feed and corn starch products. Corn is processed by either wet milling or dry milling. Wet milling separates the corn into separate components which can then be processed into various products. Dry milling is similar to wheat flour production and is used mostly for producing flour and as the precursor for processing corn into ethanol. Genetic engineering of corn has been going on for decades and always remains the subject of great debate. Many transgenic varieties have been created with traits like herbicide, pest, and drought resistance. Research continues to be conducted at a fast pace to improve the quality of corn and its products. With demand continuing to grow and research moving forward at a rapid pace, there is a need for new testing methods to meet the challenges of optimizing corn breeding, harvesting, growing, and processing. Traditional methods are often expensive, time-consuming, and impractical for use on a large scale. One method which has shown potential for measuring parameters of interest in corn that is fast, non-invasive, and able to be implemented for large-scale testing is NIR spectroscopy.
Analytes
- Sweet corn cultivar sorting
- Viable and non-viable supersweet corn seed sorting
- Effects of varieties, producing areas, ears, and ear positions of single maize kernels on NIR spectra
- Non-Structural Carbohydrates (NSC)
- Water Soluble Carbohydrates (WSC)
- In Vitro Organic Dry Matter Digestibility (IVOMD)
- Organic Matter (OM)
- Crude Protein (CP)
- Neutral Detergent Fiber (NDF)
- Acid Detergent Fiber (ADF)
- Starch
- Nutritional value of silage from Brazil
- Corn seed germination rate
- Detection of fusarium infused diseased maize grains
- Gross Calorific Value (GCV)
- Cell wall residues
- Degradability
- Lignin content
- Lignin structure
- p-Hydroxycinnamic acids
- Structural sugars
- Transgenic vs. non-transgenic discriminant analysis
- Macronutrient content as a tool for breeding selection
Summary of Published Papers, Articles, and Reference Materials
Cultivar Classification of Single Sweet Corn Seed Using Fourier Transform Near-Infrared Spectroscopy Combined with Discriminant Analysis
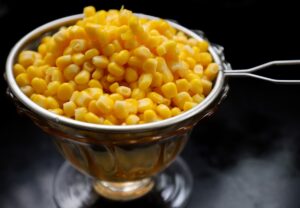 The sweetness of sweet corn is a major factor in consumer satisfaction and breeders are always working to breed sweeter cultivars. It is usually consumed when immature because of high nutrition and increased sweet flavor. A uniform maturity time is important to choose the optimal harvest time and then to obtain a good shelf-life time as the sweet flavor changes quickly after harvesting. Different cultivars of sweet corn vary in the maturity cycle, even when planted under the same conditions. Mixing of cultivars is undesirable for a number of reasons, such as differences in maturity cycle times, variation in nutritional value, and resistance to diseases and pests. The purity of a seed cultivar is defined as the ratio of seeds belonging to a cultivar to the total tested seeds. Improving purity maximizes quality and yield, leading to increased economic benefits but traditional methods for determining cultivar purity like protein electrophoresis and DNA molecular markers are expensive, time-consuming, and impractical for large-scale use. FT-NIR spectroscopy was examined for distinguishing between different cultivars of single-kernel sweet corn seeds. Three hundred and eighty sweet corn seeds from each of two separate cultivars were procured for the study. Initial examination was done by scanning a few seeds on both the embryo side and endosperm side of the seeds. After visual examination of the NIR spectra, it was determined that the embryo side spectra would be used for the study. All seeds were scanned from 10000 cm-1 to 4000 cm-1 at 4 cm-1 intervals. Thirty-two scans were collected per reading and averaged into one spectrum per sample for a total of seven hundred and sixty spectra. Various pre-processing methods were applied to the NIR spectra before chemometric analysis. Principle Component Analysis (PCA) was performed for outlier detection and to determine differences in the spectral data. After PCA, a genetic algorithm (GA) was applied to determine the feature wavelengths in spectral differences and one hundred and twenty-six wavelengths were selected. Four separate classification algorithms were used with various wavelength ranges for modeling: K-Nearest Neighbor (KNN), Soft Independent Modeling of Class Analogy (SIMCA), Partial Least Squares Discriminant Analysis (PLS-DA), and Support Vector Machine Discriminant Analysis (SVM-DA). The spectra were split into two groups: two-thirds for a calibration group and one-third for a validation group.
SVM-DA
| Full Wavelength Range | 99.59% Correct Classification |
| Featured Wavelengths | 99.19% Correct Classification |
The best results were obtained using the SVM-DA algorithm and as shown, there was over 99% accuracy using both the full wavelength range and featured wavelength range for the models. This study proved the feasibility of classifying different corn cultivars using FT-NIR spectroscopy and the SVM-DA classification algorithm. Using a classification model like this could be a method used in seed sorting machinery to select high-purity seeds of the same cultivar, helping to optimize product quality and yield in sweet corn.
https://elibrary.asabe.org/abstract.asp?aid=50687
Single-Kernel FT-NIR Spectroscopy for Detecting Supersweet Corn (Zea mays L. Saccharata Sturt) Seed Viability with Multivariate Data Analysis
 Sweet corn has become a very popular vegetable in many countries because of pleasant flavor and high nutritional value. However, low germination rate and seedling vigor of sweet corn seed have limited the development of the sweet corn industry. High soluble sugar content and lower starch cause seeds to rapidly deteriorate compared to other corn seeds. This likely occurs because less starch means less endosperm tissue can be reserved as an energy source for seed metabolism. This effect is magnified with supersweet corn seeds and the high soluble sugar content also inhibits the drying of the seed crop in the field, often necessitating artificial drying after harvesting. Proper temperature is essential during drying as it has a strong effect on germination and storability. The sensitivity of supersweet corn seeds creates a need for determining seed quality to prevent non-viable seeds from entering the market and ultimately the planting and sowing process. However, conventional methods like the germination test and tetrazolium test are time-consuming, expensive, destructive to samples, and impractical for implementing for large-scale testing. NIR spectroscopy was examined as a method for determining viability in supersweet corn seeds. Three hundred supersweet corn seeds from Huameitian No. 8, a well-known variety in China were procured for the study from South China Agricultural University. More seeds were provided but three hundred seeds that were not cracked, broken, or discolored were chosen. It is assumed that deterioration of supersweet corn seeds is caused by either excessive heating during the drying process or improper storage conditions. In order to simulate this, one hundred seeds were subjected to deterioration by tempering the moisture to 20%, placement in a plastic bag and treating by incubation for seven days, and then dried back to the 20% moisture content. This process simulates artificial aging. Another one hundred seeds were subjected to microwave treatment. Both groups exhibited no changes to the naked eye and the remaining one hundred seeds had no treatment. All seeds were scanned using an FT-NIR spectrometer from 10000 cm-1 to 4000 cm-1 at 4 cm-1 intervals on both the embryo and endosperm side. Thirty-two scans were collected per reading and averaged into a single spectrum per sample. After scanning, germination rate was checked for all seeds using the standard germination test method. Seeds in the control group had a germination rate as high as 98% while the treated seeds had a 2% rate for the deterioration group and 5% for the microwaved group. In reality, these seeds are considered non-viable because of their weak roots which would be unable to support healthy seedlings. Various pre-processing methods were applied to the spectral data before chemometric analysis. Six separate Partial Least Squares Discriminant Analysis (PLS-DA) models were created: Artificially Aged vs. Control, Heat-Damaged vs. Control, and All Damaged vs Control (for both embryo and endosperm spectra).
| Heat Damaged vs. Control (Embryo) | 100% Viable | 96.0% Non-Viable Classification |
| Heat Damaged vs. Control (Endosperm) | 99.3% Viable | 98.0% Non-Viable Classification |
| Artificially Aged vs. Control (Embryo) | 100% Viable | 98.0% Non-Viable Classification |
| Artificially Aged vs. Control (Endosperm) | 99.3% Viable | 94.0% Non-Viable Classification |
| All Damaged vs. Control (Embryo) | 99.6% Viable | 98.7% Non-Viable Classification |
| All Damaged vs. Control (Endosperm) | 99.1% Viable | 98.7% Non-Viable Classification |
The prediction models determined that FT-NIR spectroscopy and PLS-DA classification models can be used to accurately detect non-viable supersweet corn seeds damaged by overheating and artificial aging. Results were similar for both the embryo and endosperm sides of the seeds. Results can be explained by the physical and chemical changes caused by the deterioration process. There are other reasons that can cause seeds to be non-viable that have not been examined and published in an NIR spectroscopy study yet, such as frost damage during growth and natural aging. Further work would entail examining some different types of seed damage as well as encompassing a larger sample set with different varieties and batches of seeds. There is great potential to use NIR spectroscopy as a sorting tool for viable and non-viable corn seeds.
Effects of Varieties, Producing Areas, Ears, and Ear Positions of Single Maize Kernels on Near-Infrared Spectra for Identification and Traceability
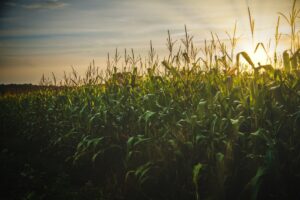 Maize is an important source of food and industrial materials and demand for seeds is high, especially in China. The quality of a maize seed is related to varieties and producing areas and identification of seeds is important to prevent adulteration. Seeds from different provinces exhibit different characteristics even among the same variety, usually related to environmental factors like climate, daylight conditions, and soil. While successful studies using NIR spectroscopy for identifying different varieties of maize seeds and wheat of the same species cultivated in different areas have shown distinct differences in NIR spectra that are sufficient for identification, no comprehensive study examining different factors and their degree of influence on NIR spectra of maize seeds has been conducted until now. In this study, NIR spectroscopy was used to determine the degree of influence of genetic and environmental factors on large amounts of maize seeds of different varieties and from different producing areas. A total of one hundred and thirty maize inbred lines harvested from Hainan and Beijing in China were procured for the study, all from the same harvest year. Five ears were randomly selected from each inbred line harvested from Hainan. Five seeds were collected from each ear from each position: ear tip, middle of the ear, and bottom of the ear. For each line harvested in Beijing, twenty seeds were collected randomly. In total, twelve thousand three hundred and fifty seeds were procured for the study. Seeds were scanned with an FT-NIR spectrometer from 12000 cm-1 to 4000 cm-1 at 8 cm-1 resolution. Twenty scans were collected per reading and averaged into a single spectrum per seed. All seeds were scanned on the embryo side. Various pre-processing methods were applied to the spectral data and the wavenumbers from 12000 cm-1 to 9000 cm-1 were eliminated from the data because of noise. Principle Component Analysis (PCA) was first performed to examine differences in the NIR spectra. The NIR spectral difference was calculated to determine the degree of influence of varieties, producing areas, ears, and different ear positions on the NIR spectra. The one hundred thirty inbred lines from Hainan were used to calculate the influence from degree of variety. After pretreatment, the difference between the spectra of each inbred line and the average spectrum was calculated and the average of these differences was the influence of degree of variety on the spectra. Likewise, differences between the spectra from the two different producing areas was calculated to determine the degree of influence of producing areas. Spectral differences between the spectra of different ears and different ear positions from the Hainan samples were also determined. It was determined that wavelength bands from 1300 nm to 1470 nm, 1768 nm to 1949 nm, 2010 nm to 2064 nm, and 2235 nm to 2311 nm were strongly influenced by the producing area. The degree of influence for the four factors was as follows: 45.40% for variety, 42.66% for producing areas, 8.22% for ears, and 3.72% for ear positions. These results show that genetic differences among maize inbred lines are the main factor in differences in NIR spectra, with producing area accounting for a slightly smaller degree of influence. The results provide a basis for variety authentication and breeding optimization. Further study should be conducted on seeds from different harvest years to determine the degree of influence from year to year.
NIRS Determination of Non-structural Carbohydrates, Water Soluble Carbohydrates and Other Nutritive Quality Traits in Whole Plant Maize with Wide Range Variability
Forage maize is an important source of fodder for dairy farms in Spain, where the need for silage for cow feeding extends from five to seven months each year. The nutritional content of forage is extremely important in determining the end product of cow milk as even small differences in nutritional content of forage can change the output and nutritional content of milk. These parameters include non-structural carbohydrates (NSC), water soluble carbohydrates (WSC), in vitro organic dry matter digestibility (IVOMD), organic matter (OM), crude protein (CP), neutral detergent fiber (NDF), and acid detergent fiber (ADF). NSC has a strong influence on the utilization of other nutrients while WSC is the substrate for growth of lactobacilli needed for acid lactic fermentation. The other parameters are all important for energy and digestibility in cow forage. Current methods for testing these parameters are time-consuming, expensive, and impractical for implementation on a large scale. NIR spectroscopy was examined for determining components of forage maize. Maize whole plant samples were collected over an eight year period from different locations in Spain and in diverse environmental conditions. To further expand the diversity of the sample set, samples were also collected from different genetic diversity sources, different countries, different tillage systems, and different maturity stages. Over three thousand samples were scanned using an NIR spectrometer from 1100 nm to 2500 nm. Various preprocessing methods were applied to the NIR spectra before chemometric analysis. All samples were analyzed for the parameters of interest using traditional methods. In total, four hundred and fifty samples were chosen for a calibration set and eighty-seven were chosen for a validation set. Sample selection was based on expanding the variability of the spectra by adding appropriate outlier samples to previous calibrated equations after determination of reference values. Partial Least Squares (PLS) calibration models were created to correlate the NIR spectra to the parameters of interest. Results are shown below.
| OM | R² = 0.91 | SEC= 0.23 g/100 g Dry Matter |
| CP | R² = 0.93 | SEC= 0.29 g/100 g Dry Matter |
| NDF | R² = 0.91 | SEC= 1.61 g/100 g Dry Matter |
| ADF | R² = 0.92 | SEC= 0.98 g/100 g Dry Matter |
| IVOMD | R² = 0.77 | SEC= 2.30 g/100 g Organic Matter |
| WSC | R² = 0.90 | SEC= 1.34 g/100 g Dry Matter |
| NSC | R² = 0.87 | SEC= 2.57 g/100 g Dry Matter |
| Starch | R² = 0.90 | SEC= 2.67 g/100 g Dry Matter |
The independent validation set was used for predictions to validate the models and out of the parameters, WSC and NSC showed the best results with good accuracy obtained in the predicted results. Starch, NDF, ADF, OM, and CP showed accurate results as well. The prediction results for IVOMD were not as good as the rest of the parameters and it was speculated that error in the reference method may have contributed to the higher prediction error. Still, the results were considered sufficient for screening purposes and to distinguish between high and low values for IVOMD. This study proved the feasibility of using NIR spectroscopy to determine nutritive components in forage maize and the potential to replace traditional time-consuming and expensive reference methods for determining these parameters.
463-471_3316-391-12_NIRS (ciam.gal)
Nutrition Value of Silage from Corn Hybrids in the State of Mato Grosso, Brazil
Rainfall in the Brazilian savanna between October and March causes considerable seasonality in forage production and thus difficulties in maintaining product regularity and income of producers. Evaluating the chemical composition of silage of corn cultivars is very important because it determines the food quality available for animal intake, especially in the case of neutral detergent fiber (NDF) because reduced NDF increases dry matter (DM) digestibility. In this practical application, NIR spectroscopy was used to determine the nutritional value of corn silage from different hybrids cultivated on an experimental farm in Brazil. Twenty-three different hybrid corn varieties from different seed companies of three repetitions each were planted for the study. Harvesting and slicing of corn plants for ensiling occurred one hundred days after plant emergence when the grains were at the hard flour stage. Forage was cut at an average particle size between two and three cm and placed in sealed silos for ninety days. After opening the silos, samples were collected from the middle of each silo. A portion of each sample was set aside for pH and ammoniacal nitrogen tests. Samples were scanned using an NIR spectrometer and calibration models were used to determine dry matter (DM), crude protein (CP), neutral detergent fiber (NDF), acid detergent fiber (ADF), and the minerals Ca, P, K, and Mg rates from the NIR spectra. From these parameters, rates of total digestible nutrients (TDN), net lactation energy (NLE), net energy gained (NEg), net energy for maintenance (NEm), digestibility in vitro of DM (DIVDM) and dry matter intake (DMI) were calculated. All pH and ammoniacal nitrogen tests showed expected values. Twelve of the hybrids showed lower NDF and thus higher estimated DMI values. This practical application showed the benefits of using NIR spectroscopy as a tool to determine variation in corn hybrid silage as performing traditional reference tests to determine the parameters of interest in this study would have been expensive, time-consuming, and required the use of expensive chemicals and solvents.
https://www.scielo.br/j/asas/a/5gWjXTymZX6TjdhshwFW5wQ/?format=pdf
Near Infrared Reflectance Spectroscopy and Multivariate Analyses for Fast and Non-Destructive Prediction of Corn Seed Germination
Seed viability and germination rate are crucial parameters in planning agricultural production. It can be significantly influenced by both ecological factors, biochemical metabolism of the seed, and improper storage after harvesting. Traditional methods for determining these parameters include tetrazolium, conductivity, immunoassay, and germination tests which are not only expensive, time-consuming, and require the use of toxic chemicals and solvents but can also be very dependent on the experience and sensitivity of the technicians performing the tests. There is a need for a fast, non-invasive, and cost-effective testing method to determine corn seed germination rate and NIR spectroscopy was examined for this purpose. Eighteen different commercial samples of corn seed were procured for the study. Fourteen of the eighteen samples belonged to the same genotype of various ages that were stored for periods ranging from three months to two years under uncontrolled room conditions. Samples were scanned using an FT-NIR spectrometer from 10000 cm-1 to 4000 cm-1 using 4 cm-1 resolution. Thirty-two scans were collected per reading and averaged into one spectrum. This process was done three times per sample for a total of fifty-four spectra. Germination rate of the seeds was determined using a standard International Seed Testing Association (ISTA) method. Seeds were placed in moist germination paper, rolled, placed in a plastic container, and incubated at 25°C for seven days. When the emerging radicle was at least 2 mm, the seed was considered germinated. A significant variation was detected between corn genotypes in terms of germination rates and made the effect of seed storage period clear on germination rate. Rates varied from 0% for a non-viable seed to 18% for the slowest germinating seed to 100% germination. A Partial Least Squares (PLS) calibration model was created correlating the germination rate to the NIR spectra. Results are shown below.
Germination Rate R² = 0.98% SEP= 4.61%
The results of this study show promise for determining the germination rate of corn genotypes using NIR spectroscopy and a calibration model. However, it must be noted that the sample set is very limited and in order to use this model in a practical setting, more samples and multiple genotypes must be added to the calibration set. With such a small sample set, it is unclear exactly what parameters the calibration model is using to determine the basis for the correlation. It is recommended that a sample set with a minimum size of one hundred samples using multiple genotypes be used before using this application in a practical setting.
An Approach for Identification of Fusarium Infected Maize Grains by Spectral Analysis in the Visible and Near Infrared Region, SIMCA Models, Parametric and Neural Classifiers
Fusarium is a genus of fungi that is widely distributed in soil and associated with plants. While most species are harmless, some produce mycotoxins in cereal crops that can be toxic to humans and animals if consumed. Fusarium spp. Fusarium verticillioides is one such disease and it is important to determine that maize grains are free of this disease before entering the food chain. Traditional testing methods typically involve chromatography and while accurate, they are expensive, time-consuming, and impractical for large-scale testing use. Fluorimetric testing can be used as well but this method still takes about fifteen minutes to examine one single seed. A need exists for a fast, non-invasive testing method that can test large amounts of maize grains for disease and NIR spectroscopy was examined for this purpose. A total of nine hundred grains from the most popular variety of corn in Bulgaria were procured for the study. Samples were sorted into healthy and diseased grains and were scanned on both the endosperm and embryo sides. NIR spectra were collected using an NIR spectrometer from 400 nm to 2498 nm at 2 nm intervals. Each sample was scanned three times for a total of twenty-seven hundred spectra. Sample spectra were divided into a calibration set and validation set with six hundred samples chosen for calibration and three hundred for validation. Various preprocessing methods were applied to the spectral data before chemometric analysis. Three different classification algorithms were used to classify the grains based on NIR spectra: Soft Independent Modeling of Class Analogy (SIMCA), K-Means, and Probabilistic Neural Network (PNN).
Endosperm
| SIMCA | Healthy – 98.7% | Diseased – 96.0% |
| K-Means | Healthy – 95.3% | Diseased – 90.6% |
| PNN | Healthy – 99.3% | Diseased – 98.7% |
Embryo
| SIMCA | Healthy – 99.3% | Diseased – 93.3% |
| K-Means | Healthy – 94.6% | Diseased – 92.0% |
| PNN | Healthy – 99.3% | Diseased – 99.3% |
Best results were obtained using the PNN algorithm with the NIR spectra of the embryo side of the seeds. Spectra of the validation set were used with the classification algorithm to validate the model. However, it must be noted that the threshold of detection of mycotoxin concentration is far too low to directly detect it using NIR spectroscopy. It is quite possible that the mycotoxin concentration is affecting chemical and physical parameters in the seeds that can be detected using NIR spectroscopy and the results of this study reflect the changes in these parameters that occur in diseased maize grains. In order to properly validate a study of this nature, a thorough examination of the wavelengths showing differences in the NIR spectra of the two groups of seeds and tests on the nutritional content of the two groups of seeds is recommended.
www.clbme.bas.bg/bioautomation/2010/vol_14.2/files/14.2_03.pdf
Gross Calorific Value Estimation for Milled Maize Cob Biomass Using Near-Infrared Spectroscopy
Maize cob is the waste product after the maize seed is removed. While it has been used as a fertilizer, it takes a long time to decompose and is not popular among farmers for this reason. However, maize cob can be used as a biofuel. When burned, it has a calorific value of approximately 17,000 kJ/kg and has a long burning time as well. An important measurement in waste residues for biofuel use is gross calorific value (GCV), the total energy released in the burning process. This particular measurement takes the latent heat of vaporization of water into account during the combustion process. The traditional method for determining GCV is a bomb calorimeter which is expensive and takes about thirty minutes per sample, making it impractical for large-scale testing. A need exists for a fast, non-invasive, and cost-effective method to determine GCV in maize cob and NIR spectroscopy was examined for this purpose. Sixty samples of maize cobs were collected from different growing areas for the study. After harvesting, samples were crushed and dried to a constant weight in an oven. Samples were scanned using an FT-NIR spectrometer from 12500 cm-1 to 3600 cm-1 at 8 cm-1 resolution. Each sample was scanned thirty-two times per reading and the scans were averaged into a single spectrum per sample. Out of the sixty sample spectra, fifty were chosen for the calibration set and the remaining ten for a validation set. After scanning, reference tests were performed on 0.5 g of each sample using a bomb calorimeter to determine GCV values. Various pre-processing algorithms were applied to the NIR spectra before chemometric modeling. A Partial Least Squares (PLS) calibration model was created correlating the NIR spectra to GCV. Results are shown below.
| GCV | R² = 0.83 | RMSECV= 91 J/g |
Modeling results showed good correlation and the independent validation set was used to confirm the validity of the model. The RMSECV is quite low considering that each sample has a GCV in between 17000 J/g and 18000 J/g. It is possible that using only 0.5 g for the reference tests contributed to a lower correlation coefficient as the variation between that sample size used for the reference test and the sample scanned with the spectrometer may have been significant. The sample set was limited and before using this model in a practical setting, more samples from different growing areas and different varieties of maize cob should be added to the calibration set to make the model more robust and confirm the validity of the calibration. Overall, the results show promise for using NIR spectroscopy as a fast, non-invasive, and cost-effective method for determining GCV in maize cob with the potential to replace traditional time-consuming and expensive reference methods.
Water Deficit Responsive QTLs for Cell Wall Degradability and Composition in Maize at the Silage Stage
In order to use lignocellulosic biomass for animal feed or biorefining, optimization of the degradability of the material is required. Much work is put into adapting biomass crops to changing climate and in particular to drought resistance. Lignocellulosic biomass consists primarily of cell wall polymers. Few studies have been conducted that use quantitative trait loci (QTL) to determine agronomical and cell-wall related traits related to water deficit. In this study, the mapping power of a maize recombinant inbred line population was combined with NIR spectroscopy calibration models to track the response to water deficit of traits associated with biomass quality. Over three separate years, the inbred line population was cultivated under two contrasted water regimes and harvested at silage stage. NIR predictive equations were established for various biochemical cell wall related traits, such as cell wall residues, degradability, lignin content, lignin structure, p-Hydroxycinnamic acids, and structural sugars. Results showed that cell wall degradability and β-O-4-linked H lignin subunits were increased in response to water deficit, while lignin and p-coumaric acid contents were reduced. A mixed linear model was fitted to map QTLs for agronomical and cell wall-related traits. These QTLs were categorized as “constitutive” (QTL with an effect whatever the irrigation condition) or “responsive” (QTL involved in the response to water deficit) QTLs. Fifteen clusters of QTLs encompassed more than two-thirds of the two hundred and thirteen constitutive QTLs and thirteen clusters encompassed more than 60% of the one hundred and forty-nine responsive QTLs. The results showed that water deficit favors cell wall degradability and that breeding of varieties that show improved resistance to drought and biomass degradability is possible. NIR spectroscopy proved to be a powerful tool in this study by enabling the quick analysis of the various traits needed to determine the effect of water deficit on the maize samples.
Screening of Transgenic Maize Using Near Infrared Spectroscopy and Chemometric Techniques
Plant breeding uses molecular biology to produce new crop varieties and lines by using genetic engineering to introduce desirable traits into plants. One important technique in breeding is selection, the process of effectively propagating plants with desirable traits and eliminating those with less desirable traits. Breeders must screen large populations of crops to find plants with desired traits. Traditional screening methods used for this purpose are DNA and protein based, such as polymerase chain reaction (PCR) and microarrays. Such methods are time-consuming, expensive, and impractical for use when studying large numbers of samples, especially in the procedure of leaf DNA extraction. NIR spectroscopy was examined for the purpose of classifying transgenic and non-transgenic maize plants. Seeds of transgenic maize created with both herbicide and insect tolerant traits along with seeds from its parental line were procured for the study. Seeds were sown and grown in a greenhouse for two months. The second or third leaf that formed from each plant was selected for NIR sampling. Before NIR scanning, PCR was used to check the integrity of the copies of the genes introduced during the breeding phase. In total, one hundred and sixty-three of each of the transgenic and non-transgenic leaves were chosen for NIR scanning. Samples were scanned using an NIR spectrometer from 900 nm to 1700 nm. Each leaf was scanned three times and the three scans were averaged into one spectrum. Various pre-processing methods were applied to the spectral data before chemometric analysis. Principle Component Analysis (PCA) was performed on the NIR spectra to analyze spectral differences and wavelength ranges that were relevant to differences in the spectra. A total of five separate classification algorithms were applied to build discrimination models that can separate the transgenic and non-transgenic samples using the NIR spectra. Models were created using both the full wavelength range and sensitive wavelengths identified from PCA. The best results are shown below:
| Extreme Learning Machine (ELM) | 95.20% |
In order to validate the models, cross-validation was performed by removing sample spectra from the models and then classifying the samples based on the spectra that were removed. The best results were obtained with the ELM algorithm using the full wavelength range. The sensitive wavelength range models showed worse results. It is common for natural products to show variations in NIR spectra that are not related to the parameters of interest and models using the full wavelength range for agricultural products in particular need a large wavelength range to be robust and predict accurately. The potential was demonstrated for using NIR spectroscopy as a screening tool for transgenic plants that could replace expensive, time-consuming, and slow traditional reference methods.
Grain Quality of Drought Tolerant Accessions Within the MRI Zemun Polje Maize Germplasm Collection
Maize is among the three most widely grown crops in the world. Breeders are conducting research to identify superior genotypes, particularly in relation to drought tolerance as drought is one of the most important factors that limits production of maize. Even in areas where the average rainfall is sufficient for maize growing, the distribution of rainfall can be insufficient and causes yield loss in the crops. The incorporation of genetic research in breeding programs that can create lines that are more drought resistance and thus having most stable yields is growing rapidly, but current testing methods for determining genetic lines with these traits are impractical for large-scale use. In this study, NIR spectroscopy was used as a tool for determining nutritional content of forty different accessions that were created from an elite drought tolerant core gene bank from multiple inbred lines, introduced populations, and landraces. The purpose was to determine if macronutrient content gain among the different generic groups could be correlated to genetic gain and thus identify these groups as potentially favorable sources for a specific trait, in this case drought tolerance. The forty different accessions from the core were grown, multiplied, and at least eighty ears of maize were collected per multiplied population. Samples were scanned using an NIR spectrometer and calibration models were used to determine values for oil, protein, and starch. It was noted that the oil, protein, and starch contents were significantly higher in the introduced populations than for the landraces. Oil in particular showed the greatest progress from the selection based on the expected genetic gain at 14.74%, indicating that the greatest progress in breeding could be determined from increased oil content with accessions from an unknown group. The potential was shown in this study to use NIR spectroscopy as a tool for determining macronutrient content in maize which can then be used to identify accessions with favorable traits to assist breeders in selecting plants with desirable qualities for improved breeding.
The post Corn Analysis appeared first on NIR-For-Food.
]]>The post Cereals & Barley Analysis appeared first on NIR-For-Food.
]]>Introduction
Cereals have played an essential role in the development of human civilization and have been cultivated for nearly ten thousand years. By definition, a cereal is any cultivated grass grown for the edible components of its grain and can also refer to the resulting grain itself. The edible components of cereal grain are the endosperm, germ, and bran. Unprocessed grains have high nutritional content and are a rich source of vitamins, minerals, carbohydrates, fats, oils, and protein. The bran and germ are often removed in processed cereal products and the endosperm is composed of mostly carbohydrates. Cereal grains can be used for human food, animal feed, biodiesel, and as a starch source for conversion into fermentable sugars. Cereals are grown in greater quantities and provide more food energy worldwide than any other type of crop. The long shelf life, high caloric content, and nutritional composition of grains makes them an ideal food source, especially in impoverished and developing countries. The most widely produced cereal crops worldwide are maize, wheat, rice, barley, and sorghum. Many types of cereals are adaptable to different climates and growing conditions and others are specific to certain parts of the world. Barley in particular is known for being versatile and adaptable to unfavorable climate and soil conditions. It is a top source of animal feed for cattle and has superior properties for malting and brewing. Barley flour is used in many types of foods, such as stews, soups, pastas, noodles, sauces, and baked products. One important processed product made from cereal grains is breakfast cereals, which have gained popularity as a ready-to-eat food that is being repositioned as not only a breakfast food but as a snack or dessert in cereal bar food. Companies are constantly marketing new and eye-catching flavors along with playing to increased consumer awareness of health and nutritional benefits of foods. There are many different types of breakfast cereals and quality control during manufacturing is very important to meet proper specifications. With demand continuing to grow and research moving forward at a rapid pace, there is a need for new testing methods to meet the challenges of optimizing cereal grain breeding, growing, harvesting, and processing as well as manufacturing of different cereal based products. Traditional methods are often expensive, time-consuming, and impractical for use on a large scale. One method which has shown potential for measuring parameters of interest in cereals that is fast, non-invasive, and able to be implemented for large-scale testing is NIR spectroscopy.
Analytes
- Starch
- Amylose
- Sugars
- Protein
- Waxy wheat discrimination analysis
- Viscosity parameters
- Degree of gelatinization
- Dry matter
- Nitrogen
- Hardness
- Soluble sugars
- Oil
- Moisture
- Toxin levels
- Crude protein
- Lipids
- Endosperm texture Superoxide Dismutase (SOD) Activity
- Total Amino Acids (TAA)
- Fusarium infection
- Selection of optimal high yield and high quality malt barley varieties
- Optimization of processing conditions in barley milk manufacturing
- Glucose
- Fructose
- Sucrose
- Total sugars
- Classification of breakfast cereal bars
A Review on the Role of Vibrational Spectroscopy as an Analytical Method to Measure Biochemical and Biophysical Properties in Cereals and Starchy Foods
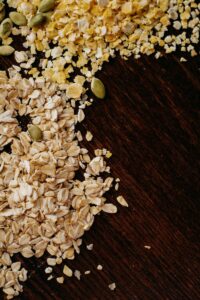 Starch is the major component of cereal grains and other starchy foods. Stored starch in the seeds and tubers of many agricultural crops provides the main source of energy in human diets, including cereal crops like maize, wheat, rice, barley, and sorghum. Changes in the biochemical and biophysical properties of starch are directly related to the ratio of amylose and amylopectin. Amylose is a polysaccharide that makes up about 20% to 30% of total starch in most starch containing plants. It has a tightly packed helical structure, making it more resistant to digestion than other starch molecules and an important component of resistant starch. Amylopectin makes up 70% to 80% in most starch containing plants, although it varies depending on the source. It is a water soluble polysaccharide bearing a linear chain with linked glucose units that can branch into side chains. Amylopectin is higher in medium-grain rice, waxy potato starch, and waxy corn, can be up to 100% in glutinous rice, and is lower in long-grain rice and amylomaize. The ratio of the two starch components influences properties like viscosity and gelatinization that affect the end use of the compound. Current methods for measuring chemical and physical properties of starch are slow, require sample preparation and destruction, and are often impractical for large-scale use. Two such methods are Differential Scanning Calorimetry (DSC) and Rapid Visco Analyzer (RVA). One example of RVA use in cereal analysis is to determine the effects of rain damage on grain quality at the point of delivery. Over the last twenty-five to thirty years, vibrational spectroscopy and chemometric techniques have been examined for developing rapid methods for determining biochemical and biophysical properties of interest in cereals and other starchy foods. NIR spectroscopy is particularly well-suited for measuring starch-related parameters, offering the advantages of fast analysis, no sample destruction, minimal or no sample preparation, and the ability to measure multiple parameters from one light scan. According to one report, NIR spectroscopy is currently applied in three different ways in cereal and starchy foods analysis: straightforward and rapid determination of composition, a screening tool in plant breeding, and an in-line tool to monitor chemical and physical changes during processing. This review paper examines various applications for measuring and monitoring both biochemical composition (amylose, amylopectin, and starch) and biophysical properties (pasting properties, viscosity) in cereals and starchy foods.
Amylose, Amylopectin, Starch, and Granule Structure
Parameter Sample Statistics
| Starch Buckwheat Flour | R² = 0.93 | |
| Starch Sweet Potato | R² = 0.95 | SEP = 1.91% |
| Starch-Amylose (SAC) Corn | R² = 0.96 | SEP = 5.1% |
| Starch Potato Tubers | R² = 0.90 | SECV = 0.74% |
| Amylose Sorghum | R² = 0.75 | SEP = 0.77% |
| Starch Yam Tubers | R² = 0.84 | |
| Sugars Yam Tubers | R² = 0.86 | |
| Proteins Yam Tubers | R² = 0.88 | |
| Starch Taro | R² = 0.89 | |
| Sugars Taro | R² = 0.90 | |
| Amylose Rice | SEP = 0.31% | |
| Amylose Beans | SEP = 12.8 g/kg | |
| Amylose Barley | SEP = 1.09% | |
| Starch Barley | SEP = 0.98 | |
| Amylose Yam | SEP = 3.71% | |
| Starch Yam | SEP = 1.78% | |
| Crude Starch Maize | SEP = 0.96% |
Waxy Wheat vs. Partial Waxy Discriminant Analysis – Accuracy greater than 90%
The statistics shown above are from various application studies examining the feasibility of measuring biochemical parameters in starch-based foods. High correlation coefficients and low SEP measurements were found for starch in many of the samples, with a correlation coefficient greater than 0.90 for buckwheat flour, sweet potato, corn, and potato tubers. In the case of sweet potatoes, good predictions were obtained from samples from the same harvests but the model could not account for variances in samples from other harvests or years, indicating that further calibration work is necessary before using the calibration model in a practical setting. Slight lower correlation and reasonable SEP numbers were found for yam, yam tubers, taro, and barley as well as for crude starch in maize. Application studies for amylose showed good correlation as well, especially in the case of starch-amylose content (SAC) in corn. This particular study used a set of genotypes with endosperm mutations, creating a range from 8.5% to 76% in SAC. This large range likely contributed to the good results. Amylose in sorghum was determined using both whole and ground samples, with better results coming from the ground samples. This is expected when measuring a biochemical property as ground samples are more homogenous. Good results were also obtained measuring sugars, proteins, and starch in yam tubers. In the case of the discriminant analysis study for wheat, waxy wheat that was developed free of amylose was used along with partial waxy and wild genotypes. The Linear Discriminant Analysis (LDA) model was able to discriminate the waxy wheat with an accuracy over 90%, although results were less accurate for the other two types. The authors of the study suggested that the spectral sensitivity to waxiness diminishes with reduction of the lipid-amylose complex that is lowered as waxiness decreases. Overall, these studies show the feasibility of using NIR spectroscopy and chemometric models for determining biochemical parameters of interest in cereals and other starch-based foods.
Gelatinization, Pasting Properties, and Retrogradation of Starch
| PV | Peak Viscosity |
| BD | Breakdown |
| SB | Setback |
| HPV | Hot Pasting Viscosity |
| TH | Though |
| FV | Final Viscosity |
| RVU | Rapid Visco Units |
Parameter (RVU) Sample Statistics
| BD Rice | R² = 0.88 | SEP = 10.2 |
| SB Rice | R² = 0.92 | SEP = 13.6 |
| PV Rice | R² = 0.74 | SEP = 20.99 |
| BD Rice | R² = 0.80 | SEP = 21.47 |
| SB Rice | R² = 0.97 | SEP = 22.23 |
| TH Rice | R² = 0.80 | SEP = 7.37 |
| FV Rice | R² = 0.95 | SEP = 13.2 |
| PV Sweet Potato | R² = 0.91 | SEP = 13.1 |
| BD Sweet Potato | R² = 0.81 | SEP = 10.67 |
| SB Sweet Potato | R² = 0.92 | SEP = 1.82 |
| PV Maize | R² = 0.92 | SEP = 183 |
| BD Maize | R² = 0.92 | SEP = 232 |
| SB Maize | R² = 0.92 | SEP = 412 |
| Degree of Gelatinization Pasta | R² = 0.97 | SEP = 0.24 |
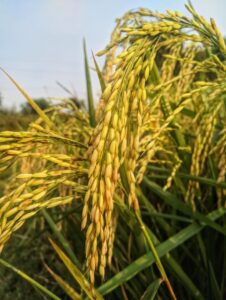 RVA instruments are widely used in assessing cooking and processing characteristics in food, especially in rice. One study examined NIR spectral changes due to changes in structure of starch from gelatinization. Numerous wavelengths showed notable changes in the second derivative spectra, especially in the wavelength range from 2100 nm to 2280 nm. The authors speculated that effects on particle size explained the changes in the NIR spectra, as high correlation exists between particle size and degree of gelatinization. Numerous studies have shown that NIR spectroscopy and calibration models can be used to predict biophysical viscosity parameters with good accuracy as is shown in the statistics listed above. The variability of results in these studies can be attributed to a number of factors, such as the accuracy of the reference method, interferences with other properties, range of values in the parameters of interest, number of samples used, and sources of variability in natural products. It is often the case that differences in climate, soil composition, harvest year, breed, genotype, and variety in agricultural products can create differences in NIR spectra that are not directly attributed to changes in the parameters of interest. Calibration models must contain samples that cover all these sources of variability in order to make accurate predictions and the process of making such a model is called creating a “robust” model. There are challenges in the interpretation of complex data using multivariate methods and calibration development, but the advantages of using NIR spectroscopy as a fast, non-invasive, and cost-effective method to predict parameters of interest in cereals and starchy foods ensures that continued research and development will occur.
An Overview on the Use of Infrared Sensors for in Field, Proximal, and at Harvest Monitoring of Cereal Crops
There is a demand from farmers for rapid, cost-effective, green, and non-destructive methods for monitoring changes in the physical and chemical properties of crops. Monitoring properties throughout the lifecycle of the plant can help establish the optimum harvest date, improve agronomic management practices, and improve crop diagnostics. The concepts of water and nitrogen use and efficiency have been around for a long time but their use is minimal as part of the decision making process and are often not used as metrics for evaluating farm performance due to a lack of adequate tools and sensors. Farmers, researchers, and instrument manufacturers are constantly looking for ways to develop new sensors that can evaluate efficiency to improve production and processes. Proximal sensors can provide a powerful tool for analysis of soil physical properties, chemical properties, and crop diseases. One potential tool for monitoring cereal and agricultural crops is NIR spectroscopy. NIR spectroscopy provides the advantages of being fast, non-invasive, no sample destruction, little or no sample preparation, requires no toxic chemicals or solvents, and the ability for large-scale monitoring as well as being able to measure multiple parameters of interest with a single light scan. Research and development is happening with a number of applications and the use of NIR spectroscopy as a practical tool is dependent on multiple factors, such as instrument cost and availability, using the instrument in the field or on-line, and model robustness, accuracy, and precision. This review paper examines application studies using NIR spectroscopy to monitor dry matter (DM), yield, nitrogen, and pest and diseases in various cereal crops.
Dry matter is one of the most important parameters in crop production as it is directly related to production costs. The significance of determining water status in plants has been increased in the context of climate change and scheduling irrigation times and volumes, preserving water, and manipulating composition are of utmost importance. Water is a proven parameter that can be measured using NIR spectroscopy as water is very absorbing of NIR light in the wavelength range above 1000 nm and even small changes create marked differences in the NIR spectra. However, there are logistical and technical challenges in making measurements of plants or crops on a farm. These include the creation of robust calibration models that cover variability in NIR spectra caused by differences in soil, breed, variety, genotypes, and other sources of variability in agricultural products. In recent years, the development of portable field instruments has facilitated the direct measurement of samples in the field. Such analysis is advantageous for monitoring fresh plant samples without the need for drying, grinding, or sending the sample to the laboratory. Numerous authors have reported that one of the major causes for low nitrogen use efficiency is the poor synchrony between soil nitrogen supply and crop demand. Traditional reference methods for determining nitrogen concentration are the Kjeldahl and Dumas methods which are accurate but are also time-consuming, expensive, require the use of chemicals and solvents, and are ill-suited for widespread testing. Studies in recent years have demonstrated the potential of NIR spectroscopy in determining nitrogen concentration in grass samples and as a replacement for wet chemistry methods with online field screening, helping to facilitate improved nitrogen uptake efficiency and total concentration.
The feasibility of using NIR spectroscopy has been evaluated for multiple harvest applications in cereal crops. Cereal grains can be analyzed whole, as ground powder, or in some cases as single seeds when determining different chemical properties. Classification of maize kernels based on starch composition, hardness, and toxin levels has been examined in application studies. Likewise, dry matter, starch, soluble sugars and crude protein in several types of cereal grains have been studied using NIR spectroscopy and these four parameters have all shown good results in studies. In the case of single seeds, best results have been obtained from plants with small seeds and a relatively uniform distribution of seed constituents, such as rapeseed, wheat, sunflower, soybean, and cottonseed. Oil and protein are two examples of parameters in single seeds that can be measured using NIR spectroscopy. Spectroscopic techniques have also been examined for detection of both symptomatic and asymptomatic plant diseases as well as pest infestation. One study examined the percentage of Aspergillus fungal infection in rice samples and another identified aflatoxin B1 in paddy rice samples. Other studies examined deoxynivalenol and other mycotoxins in various types of cereals. It must be noted that the concentration of these toxins in plants is often far below the threshold of detection for NIR spectroscopy. It is likely that calibration models are actually correlating to a measurable parameter that is being affected directly by the toxic contamination. While such an indirect correlation is acceptable, such models must be examined carefully when building the calibration to ensure the models are valid. Overall, these studies have shown the important role and potential of NIR spectroscopy in cereal crop analysis. It can optimize manpower and expenditure required for crop analysis, reduce sampling error, and deliver more representative measurements of plots on a farm. Farmers in Australia, Canada, Europe, and the United States are using NIR spectroscopy to determine parameters like protein and dry matter during harvest. Research and development continue and the potential savings, quick analysis time, and environmentally friendly nature of using NIR spectroscopy could one day lead to the application of NIR spectroscopy across the entire food supply chain.
Development of NIRS Equations for Food Grain Quality Traits Through Exploitation of a Core Collection of Cultivated Sorghum
Sorghum is a major food cereal in Asian and African countries. Some examples of traditional foods made with sorghum include porridge in western Africa, ugali in Eastern Africa, couscous, masa, and tortillas. Grain quality is determined by biochemical and physical parameters that influence rheological and sensory properties of sorghum dishes. For example, the consistency of thick porridge is significantly correlated with amylose content but negatively correlated with protein and lipid content. Cooked couscous firmness correlates positively with amylose while waxy sorghums that contain little or no amylose produce sticky masa and tortillas with poor rollability. Endosperm texture and hardness affect grain mold resistance, grain storage ability, milling behavior, flour particle size, and cooking properties. Hard grains produce flours that have a high proportion of coarse particles with low ash content. These grains yield a high proportion of desirable sorghum couscous granules. Standard laboratory methods for measuring these parameters are time-consuming, expensive, often require the use of toxic chemicals and solvents, and are impractical for measuring samples on a large scale. NIR spectroscopy was examined for determining quality traits in sorghum. It offers the advantages of being fast, non-invasive, no sample destruction, little or no sample preparation, and the ability to measure multiple parameters with a single light scan. The objective of the study was to use a large and diverse sorghum core collection to develop NIR calibration models for amylose, protein, lipids, endosperm texture, and hardness for the purpose of varietal comparisons and genetic analyses in the framework of a breeding program. Two hundred and five accessions of the core collection were analyzed from five basic races and five intermediate races. The accessions originated from thirty-nine different countries. Most samples were harvested from an irrigated trial conducted during a single dry season in Senegal. Eight local varieties were also added to the study and in total, two hundred and seventy-eight samples were procured for the study. All grains were cleaned, sifted through a sieve adapted to the average grain size of each sample, and moisture content was measured to calculate the quantity of water needed to reach 11.5% moisture. Water was added and the samples were stored in sealed containers for a minimum of eight days before use. 20 g of each sample was ground in a 0.8 mm sieve. For each sample, both whole grains and ground portion were scanned using an NIR spectrometer from 400 nm to 2500 nm at 2 nm intervals. Thirty-two scans were collected per reading and averaged into a single spectrum. Whole grain samples were collected in duplicate while only one spectrum was collected for ground samples. Traditional reference methods were used on the samples to determine values for the parameters of interest. Various pre-processing methods were performed on the spectral data before chemometric analysis. Principle Component Analysis (PCA) was performed to determine variations in the NIR spectra and for outlier analysis. Partial Least Squares (PLS) calibration models were created using the NIR spectra and reference values of the parameters of interest.
Ground Sorghum Calibration Models
| Amylose | R² = 0.75 |
| Protein | R² = 0.98 |
| Lipids | R² = 0.91 |
| Endosperm Texture | R² = 0.88 |
| Hardness | R² = 0.90 |
Whole Grain Sorghum Calibration Models
| Amylose | R² = 0.70 |
| Protein | R² = 0.95 |
| Lipids | R² = 0.84 |
| Endosperm Texture | R² = 0.85 |
| Hardness | R² = 0.88 |
Results for the calibration models using the NIR spectra of both ground and whole grains showed good correlation for all parameters with the exception of amylose, which likely occurred because of a small range of values in the samples. Results would likely improve by extending the range of values for amylose by using waxy and non-waxy grains as well as using progenies obtained by crossing contrasted varieties. Previous studies using other cereals that compared ground grain sample vs. whole grain sample calibrations showed comparable results. The reasons for this include homogeneity of the ground samples and scattering effects on the spectra of whole grain samples due to differences in particle size. This study proved the feasibility of using NIR spectroscopy and calibration models to determine quality traits in both whole and ground sorghum grains.
Fast Analysis of Superoxide Dismutase (SOD) Activity in Barley Leaves Using Visible and Near Infrared Spectroscopy
 Barley is widely cultivated around the world, especially in Asia and Northern Africa. It is considered one of the most adaptable cereal grain species and can be produced at higher altitudes and latitudes as well as further into the desert than any other cereal crop. Oxidative stress is one of the detrimental effects of reduced oxygen and is an important phenomenon in many biological systems. Superoxide dismutase (SOD) is one of the protective enzymes that plays an important role in protection against environmental adversity. It can remove free radicals and improve stress tolerance. The traditional method for determining SOD activity is to measure its ability to inhibit the photochemical reduction of nitroblue tetrazolium, which requires the use of toxic chemical reagents and sample destruction. NIR spectroscopy was examined for determining the feasibility of predicting SOD activity in barley leaves. Samples were procured from a farm in China. A herbicide was used as a stressor with five different concentrations (0, 50, 100, 500, and 1000 mg/L) applied at the two leaf stage. Seventy-five sample were collected during the growing period at intervals of five, ten, and fifteen days after herbicide treatment. NIR spectra of the barley leaves were collected from 325 nm to 1075 nm at 1.5 nm intervals. Three spectra were collected per sample and averaged into one spectrum. All leaf samples were tested for SOD activity by the standard reference method. Various preprocessing methods were applied to the spectral data before chemometric analysis. Four separate regression algorithms were used to correlate the NIR spectra to SOD activity: Partial Least Squares (PLS), Multiple Linear Regression (MLR), Least Squares-Support Vector Machine (LS-SVM), and Gaussian Process (GP). Fifty samples were used as a calibration set to create the regression models and the remaining twenty-five samples were used as an independent validation set.
| LS-SVM | R² = 0.9064 | RMSEP = 0.5536 U/mg Pro |
The first PLS model used the entire spectral range for the calibration and obtained decent results with pre-processed spectra. The regression coefficients from the PLS model were then used to select thirty effective wavelengths as input for the LS-SVM model. The best results were obtained from this model and both the LS-SVM and SP models showed better results than PLS and MLR. LS-SVM and SP are both non-linear calibration algorithms and proved to be more suitable for determining SOD. Independent predictions from the validation set proved the validity of the model. While further study and more samples would be necessary before using this model in a practical setting, this study showed the potential and feasibility of using NIR spectroscopy to determine SOD activity in barley leaves.
Quantitative Analysis of Total Amino Acid in Barley Leaves Under Herbicide Stress Using Spectroscopic Technology and Chemometrics
Barley is one of the earliest cultivated cereal grains and is attracting renewed interest for its use as food and as a bioethanol feedstock. It is known for drought resistance and the ability to mature in climates with a short growing season. Amino acid content is an important physiological indicator of environmental stress during plant growing season. A recently developed herbicide, ZJ0273, has been applied to remove and control weeds in barley fields (the same herbicide used in the above SOD leaves study). It is an ALS (acetolactate synthase) inhibiting herbicide which affects the formation of branch chain amino acids like aspartic acid, valine, and proline. Total amino acids (TAA) is an important parameter for understanding the effects of herbicides on barley growth. The traditional method for measuring TAA is an automatic amino acid analyzer which is expensive, time-consuming, requires sample destruction, and is impractical for measuring large numbers of samples. NIR spectroscopy was examined for the purpose of determining TAA in barley leaves, offering a fast, non-destructive method for helping to measure the effects of herbicide injury on barley plants. Seventy-five barley leaf samples were procured from a farm in China for the study. ZJ0273 was applied during the seeding stage at concentrations of 0, 50, 100, 500, and 1000 mg/L. All samples were scanned using an NIR spectrometer from 325 nm to 1075 nm at 1.5 nm intervals. Thirty scans were collected per reading and averaged into one spectrum. Three separate spectra were collected per sample and further averaged into one spectrum. Various pre-processing methods were applied to the spectral data before chemometric analysis. Two separate regression algorithms were used to correlate the NIR spectra to TAA: Partial Least Squares (PLS) and Least Squares-Support Vector Machine (LS-SVM). PLS is a bilinear modeling method while LS-SVM can be used for both linear and non-linear relationships between variables. Fifty samples were used as a calibration set for both models while the remaining twenty-five samples were used as an independent validation set for predictions.
| PLS | R² = 0.935 | RMSEP = 0.558 |
| LS-SVM | R² = 0.936 | RMSEP = 0.309 |
Results were successful using both calibration methods. The first PLS model was created using the full spectral range and from the regression coefficients, significant wavelengths and latent variable were chosen as the inputs for the PLS and LS-SVM models shown above. While the sample set was limited, the results showed the feasibility of using NIR spectroscopy to measure TAA in barley leaves. Further study would be warranted before using these models in a practical setting and more variability needs to be incorporated into the calibration models, such as leaf samples at different growth stages and more varieties of barley.
Classification of Fusarium Infected Korean Hulled Barley Using Near-Infrared Reflectance Spectroscopy and Partial Least Squares Discriminant Analysis
Fusarium is a pathogen that can grow in the heads of cereal crops such as barley and wheat that can decrease yield and degrade grain quality, resulting in enormous economic losses to farmers. It can grow rapidly at temperatures between 10°C and 25°C in a high humidity environment after heavy rainfall. The pathogen can winter in seeds, straw, stubbles, and soil after harvest, leading to formation of molds that can damage ears with a brown discoloration at the early stage and gradually covering them with red conidiospores. In 1998 in Korea, fusarium infection damaged nearly forty thousand hectares of fields, which corresponds to 47.8% of the total cultivation area in the country. It can lead to the production of mycotoxins like deoxynivalenol, nivalenol, and zearalenone, which can cause intoxication of livestock and major diseases in humans if consumed, particularly as a carcinogen. Traditional methods for inspecting barley for fusarium and mycotoxin contamination include high performance liquid chromatography (HPLC), gas chromatography (GC), and enzyme-linked immunosorbent assay (ELISA). While effective, these methods are time-consuming, expensive, require the use of toxic chemicals and solvents, and are impractical for measuring large amounts of samples. NIR spectroscopy was examined for discriminating between fusarium infected barley and normal hulled barley. It offers the advantages of being fast and non-invasive with no sample destruction and little or no sample preparation. Five hundred and fifteen kernels of hulled barley were collected from five different Korean provinces for the study. The samples were divided into a control group and experimental group. One hundred and twenty-seven samples from a single province were not infected with fusarium. The remaining samples were infected and came from four separate groups. All samples were scanned using an NIR spectrometer from 1175 nm to 2170 nm. Each sample was scanned three times each on the front of the barley which contains a crease and the back which has no crease. The three spectra for each side were averaged for a total of two spectra per sample. After collection of NIR spectra, samples underwent a culture experiment to determine if a fusarium infection was present and to verify if the classification of the samples was correct. Various pre-processing methods were applied to the NIR spectra before chemometric analysis. A Partial Least Squares-Discriminant Analysis (PLS-DA) model was used to discriminate between the fusarium infected and normal barley. A PLS-DA model uses arbitrary values of zero and one to classify between two groups. The model predicts a number from the NIR spectrum of the sample and uses that number to classify it. Two separate models were created for the crease side of the hulled barley and the side without a crease.
| PLS-DA with crease | R² = 0.948 | SEP – 0.105 | Accuracy 99.66% |
| PLS-DA without crease | R² = 0.939 | SEP – 0.113 | Accuracy 99.21% |
The results for both models were excellent and proved the feasibility of the discrimination analysis. Correlation coefficients were high and SEP were low for both models. Independent validation predictions showed a very high accuracy. This study showed that NIR spectroscopy has the potential to be used as a fast, non-invasive method for classifying hulled barley based on fusarium infection.
Performance Evaluation of Malt Barley (Hordeum vulgare L.) Varieties for Yield and Quality Traits in Eastern Amhara Regional State, Ethiopia
Archaeological evidence indicates that barley was first cultivated about ten thousand years ago in the Fertile Crescent and it continues to be an important feed, malt, and food crop in many countries all around the world. In Ethiopia, barley is grown in a wide range of environments at altitudes ranging from fifteen hundred to thirty-five hundred meters above sea level. The ratio of malt barley produced to food barley produced is quite small, despite favorable growing conditions and market demand for malt barley from domestic brewers. One brewery imported over fifteen thousand tons of malting barley in a single year. While production is increasing, certain regions and varieties produce more malt barley per hectare than others. Variance in production can be due to many factors, such as low yielding varieties, low and unevenly distributed rainfall, poor agronomic intercrop practices, lack of crop rotation, and disease and pest problems. There are important quality characteristics in barley such as kernel size, kernel protein content, malt extract, and diastatic power. Protein content between 9% and 12.5% is typically acceptable for brewers. If protein is too high, the malt has low extract yield and low protein level barley lacks the enzymes necessary to modify the barley kernel and to break down starch. Different genotypes vary in these characteristics and they are also influenced by environmental factors. Some genotypes may perform well in a particular environment but poorly in others.
There is one particular area of Ethiopia where malt varieties have not been evaluated for yield. It is an important area for barley farmers and especially for malt barley as a large local brewery is located nearby, resulting in increased demand for the product. A study was conducted to identify a high yield, early matured, and high quality malt barley variety in this area. NIR spectroscopy was used with other testing methods to identify a variety that optimizes the quality and quantity standards of the malt barley. Eight separate malt barley varieties were planted during the first week of July with three replications in each of different locations. Standard crop management practices were applied throughout the growing stage and plants were harvested in October. This process was conducted over two different years and growing seasons as well. After harvesting, cleaning, and threshing, one thousand kernel weight was determined as well as other plot-based and plant-based data. Grain quality data was determined using a NIR spectrometer and calibration models for protein, starch, and moisture. This data was used to determine grain yield and the moisture values were used to adjust the grain yield numbers accordingly. While all varieties showed acceptable numbers within the industry standards for one thousand kernel weight, protein, and moisture, three particular varieties were shown to be high yield genotypes and two were shown to be low yield genotypes. In this study, NIR spectroscopy was used as an important tool assisting in the selection of three high yield, optimal kernel size, and good protein content malt barley varieties in an area of Ethiopia where demand for this product is high. Farmers can use this information to improve yield and quality of their products, resulting in improved production.
Classification and Processing Optimization of Barley Milk Production Using NIR Spectroscopy, Particle Size, and Total Dissolved Solids Analysis
Barley is a grain with significant nutritional benefits as it is a very good source of dietary fiber, minerals, vitamins, phenolic acids, and phytic acids. It has become used more often for milk production as a replacement for cow milk as many consumers are looking for an alternative to traditional dairy products. The demand results from medical reasons such as lactose intolerance and cow milk allergy and a lifestyle choice as there is an increased demand for plant-based milk products with no cholesterol. Plant based milk substitutes are manufactured by extracting the plant material in water, removing the solids, product formulation, homogenization, and heat treatment. The resulting products are suspensions which contain plant materials and oils. Research has shown that phase separation, stability, and quality of emulsions in milk and milk products can be successfully measured and characterized using NIR spectroscopy. In this study, NIR spectroscopy was used with other testing methods to determine the optimal processing conditions for barley milk production and classification of finished barley milk. Barley that was produced, harvested, processed, and packed was obtained from a local market for the study. 60 g of the barley was soaked in 90 mL of water for twelve hours. An additional 135 mL of water was added to the soaked barley and blended for 15, 30, 45, and 60 seconds in a blender. The barley milk was then filtered and separated from the spent barley grain. Samples of the barley milk and spent barley grain for each blending time were stored at 4°C until analysis. NIR spectra of both the barley milk and spent barley grain were collected from 904 nm to 1699 nm. Three spectra were collected per sample and averaged into one spectrum. After collection of absorbance spectra, all spectra were processed into first and second derivative. Further tests were conducted for particle size distribution using a laser diffraction method, electrical conductivity, total dissolved solids, and light microscopy to identify particle types and structures present in the samples. The purpose of NIR spectra collection and the subsequent tests was to see if differences in the NIR spectra between the samples with different blending times were clear enough to show that collection of NIR spectra can be used to choose the optimal blending time instead of performing the subsequent tests. Principle Component Analysis (PCA) was first performed to investigate differences in the NIR spectra. Spectra of the barley milk and barley spent grain were clearly separated into two groups and within those groups, the separation between the four blending times was much clearer for the milk than the spent grain. Analysis of particle size distribution values showed little change in particle size diameter (about 25 µm) between samples blended for 45 and 60 seconds. Likewise, there was marked change in electrical conductivity and total dissolved solids from 15 seconds of blending time to 45 seconds but little additional change for 60 seconds. Based on these results, 45 seconds was shown as the optimal blending time for milk and the NIR spectra could be used as an alternative to the other tests because the spectral differences are marked enough to mark the blending time stop point. The benefits of using this information could be enormous. NIR spectroscopy offers the advantages of being fast and non-invasive as well as the ability to provide real-time measurements using optic fibers and a probe. Determining the optimal blending end point quickly in barley milk manufacturing can result in vast amounts of savings in time, energy, and manpower.
In Situ Monitoring of Sugar Content in Breakfast Cereals Using a Novel FT-NIR Spectrometer
Breakfast cereals are widely consumed worldwide because of their easy preparation, nutritional value, and assorted varieties and flavors. Some breakfast cereals are a good source of micronutrients, such as folic acid, vitamin C, iron, zinc, fibers, and antioxidants. However, large amounts of sugar are added to some breakfast cereals which can increase risk of obesity and diabetes as well as reduce the overall nutritional quality. Per FDA regulations, the difference between laboratory analysis of sugars in cereals and the amount declared on the nutrition label must be +/- 20%. Reports indicate that many store bought cereals have a significantly higher or lower sugar content than the label indicates. It is important to monitor and control sugar content of breakfast cereals at every step of the manufacturing process as well as in the final product. Traditional methods for measuring sugar in breakfast cereals often use chromatography or electrophoresis and are expensive, time-consuming, require skilled labor, can use toxic solvents and reagents, and are impractical for monitoring large numbers of samples. NIR spectroscopy was examined for the purpose of determining sucrose, glucose, fructose, and total sugars in breakfast cereals. The particular FT-NIR spectrometer used in this study was a novel prototype instrument with handheld capability and Bluetooth communication with a tablet. One hundred and sixty-four cereal samples were procured for the study. A snack manufacturer provided one hundred and four samples of sucrose coated cereal and the remaining sixty samples were commercial cereals purchased at grocery stores. Samples were ground in a blender to obtain even particle size. NIR spectra were collected from 1350 nm to 2560 nm at 16 nm resolution. NIR spectra were also collected on intact samples for the commercial cereals. Three spectra were collected per sample. Reference values for sucrose, glucose, fructose, and total sugars were obtained using HPLC. Various preprocessing methods were applied to the spectral data before chemometric analysis. Partial Least Squares (PLS) calibration models were created correlating the spectral data to sugar parameters. Results were shown below.
Ground Cereal Samples
| Sucrose | R² = 0.98 | SECV = 1.93% |
| Glucose | R² = 0.94 | SECV = 0.14% |
| Fructose | R² = 0.95 | SECV = 0.25% |
| Total Sugars | R² = 0.98 | SECV = 1.99% |
Intact Cereal Samples
| Sucrose | R² = 0.97 | SECV = 2.42% |
| Glucose | R² = 0.94 | SECV = 0.20% |
| Fructose | R² = 0.92 | SECV = 0.21% |
| Total Sugars | R² = 0.96 | SECV = 2.48% |
The results of this study were excellent and proved the feasibility of using NIR spectroscopy and calibration models to measure sugar parameters in breakfast cereals. Results were similar for both the ground and intact cereal samples and especially when considering there were a smaller number of intact samples used, the study proved that in-line monitoring of sugars during the breakfast cereal manufacturing process is suitable. Interestingly, the comparison of both reference HPLC values and predicted values using the NIR spectroscopic calibration models with the sugar values on the labels in the commercial samples showed that seven of the sixty samples had a much higher sugar value than indicated on the label while one sample had a lower sugar value. This difference reinforces the need for an online, fast, and non-invasive method like NIR spectroscopy for determining sugar parameters in breakfast cereals.
In Situ Monitoring of Sugar Content in Breakfast Cereals Using a Novel FT-NIR Spectrometer – DOAJ
Classification of Cereal Bars Using Near Infrared Spectroscopy and Linear Discriminant Analysis
There is increased demand among consumers for food with low calorie content. However, distinguishing between the meaning of different labels like “natural”, “light”, “diet”, “organic” and “functional” can be quite confusing when trying to select a low calorie food. Light and diet foods can be found in most supermarkets and are labelled as products with low fat, salt, protein, carbohydrates, or sugar contents. Per the National Health Surveillance Agency (ANVISA) in Brazil, the term “light” can be used when the quantity of calories is at least 25% less than the conventional product. “Diet” can be applied to foods with an absence of sucrose/glucose or foods indicated for diets with restrictions of certain nutrients, such as fat, carbohydrates, protein, and sodium. Cereal bars were introduced around twenty years ago and have become very popular as a quick snack with low caloric and high nutritional value. Cereal bars are often high in fibers, vitamins, and minerals and consumers often choose products based on the appearance, package description, and the nutritional information given. However, incorrect information and/or misreading the label can often lead consumers to select cereal bars that are not suitable to their dietary needs. Quality control in cereal bar manufacturing is done through physical and chemical tests which are often time-consuming, expensive, require the use of toxic chemicals and solvents as well as sample destruction, and are impractical for measuring a large number of samples. NIR spectroscopy was examined for the purpose of classifying three different types of cereal bars: diet, conventional, and light. A total of one hundred and twenty-one cereal bars were procured for the study. Thirty-five were diet, forty-four were conventional, and forty-two were light. All samples were crushed and sieved before NIR spectra collection. Samples were scanned from 10000 cm-1 to 4000 cm-1 at a spectral resolution of 8 cm-1. Sixteen scans were collected per reading and averaged into a single spectrum per sample. Ninety samples were used as a calibration set and the remaining thirty-one samples were used for independent predictions. Various pre-processing methods were applied to the spectral data before chemometric analysis. Principle Component Analysis (PCA) was first performed to determine differences in the spectral data and for outlier determination. Linear Discriminant Analysis (LDA) models were used to discriminate between the three types of cereal bars. Numerous models were created using different pre-processing methods and wavenumber ranges selected using various algorithms and the spectra of the independent prediction set were used to classify those samples. The best results are shown below.
LDA Model Using Genetic Algorithm (GA) for Wavelength Selection
28 out of 31 samples correctly classified
Results from the different models greatly varied and indicated that wavenumber selection was very important in obtaining the best results. The GA method is commonly used to generate solutions to optimization and search problems by relying on biologically inspired operators such as mutation, crossover, and selection. However, it must be noted that using different combinations of fifteen hundred wavelength areas extensively is creating a situation where the data fit must come into question. More extensive calibration work would be needed to ensure that the classification was actually based on the cereal bar type and not just from fitting the wavelength range as the ideal set of independent variables. The best model correctly classified twenty-eight of the thirty-one cereal bars, indicating that using NIR spectroscopy for classification of cereal bars has potential as an alternative method to traditional time-consuming and expensive methods for cereal bar quality control and analysis.
The post Cereals & Barley Analysis appeared first on NIR-For-Food.
]]>The post Beans Analysis appeared first on NIR-For-Food.
]]>Introduction
Beans are a valuable food product for both humans and animals. They are the seeds of one of several genera of the flowering plant family Fabaceae. Fabaceae is the third largest land plant by number of species with nearly twenty thousand known species. Beans are valued for both their health benefits and long shelf-life. They can be cooked in many different ways such as boiling, frying, and baking. There are numerous varieties grown all over the world that all have distinct features, textures, and flavors. Some of the most popular beans include green beans, lima beans, kidney beans, black beans, chickpeas, and soybeans. The popularity of beans is due to being affordable, easily transportable due to long shelf-life, and high nutritional content. Beans are a major source of protein, dietary fiber, carbohydrates, minerals, and vitamins. They offer high protein and amino acid content while being lower in calories and saturated fat than many high protein sources, such as meat and dairy products. Studies have shown that components in beans can act as antioxidants, anti-inflammatory agents, and can improve heart health. Other potential health benefits include reduction in blood sugar levels, lower blood pressure, improved gut health, and having fiber and healthy starches which can help food eaters feel full, helping to prevent overeating and aiding in weight loss. Growing and harvesting beans is relatively simple and the process is similar for most types of beans. One exception to this is green beans, which are best harvested when immature and when the pods are bulging past their peak. Properly dried beans are shipped all over the world and do not need to be refrigerated for a long period of time if the beans are to be frozen before shipping. They can be sold dry as is, canned, or processed into various products. Some examples of processed bean products include baked beans, bean pastes, puffed snacks, refried beans, rehydrated beans, and bean flours. There is an increasing demand for beans all over the world due to many factors, including higher consumer health awareness of plant based diets and a need for food with long shelf-life due to the COVID-19 pandemic. Consumers are looking for ways to replace less healthy meat and dairy products and beans is an ideal food type for doing that. With demand continuing to grow and research moving forward at a rapid pace, there is a need for new testing methods to meet the challenges of optimizing bean breeding, growing, harvesting, and processing. Traditional methods are often expensive, time-consuming, and impractical for use on a large scale. One method which has shown potential for measuring parameters of interest in beans that is fast, non-invasive, and able to be implemented for large-scale testing is NIR spectroscopy.
Analytes
- Protein
- Moisture
- Starch
- Fat/Oil
- Tannins
- Vicine
- Convicine
- Total polyphenols
- Starch
- Lipids
- Ash
- Carbohydrates
- Total dietary fiber
- Seed weight
- Hydration capacity
- Alcohol insoluble solids
- Dry matter
- Sensory attributes
- Amylose
- Calcium
- Magnesium
- Germination time
- Water content
- Ascorbic acid
- Total isoflavones
- Mineral and protein content based on contrasting tannins
- Discrimination between arabica and robusta green coffee beans
- Coffee roasting levels
Summary of Published Papers, Articles, and Reference Materials
Application of Infrared Spectroscopy for The Prediction of Nutritional Content and Quality Assessment of Faba Bean (Vicia faba L.)
 There is increasing demand for functional food products that have the potential to provide health benefits. Modern consumers are more connected than ever to information about nutritional content and health benefits. One food that has growing consumer interest and demand is faba bean. Faba bean is one of the world’s oldest cultivated crops and is also known as broad bean and fava bean. The high levels of antioxidant and phenolic compounds in faba beans are linked to numerous health benefits, such as protection against radicals, antihypertensive benefits, and anticancer activity. Traditionally consumed in the Middle East and Southeast Asia, production of faba beans has steadily increased in many developed countries over the last few decades. The COVID-19 pandemic has also fueled increased demand for faba beans due to increasing health awareness, desire for immune system strengthening, and the long shelf-life of faba beans which enables both exporting and storage for consumers. Increased demand and production have created a need for methods to assess the nutritional quality and bioactive compounds in faba beans. Traditional methods for analyzing parameters of interest are often expensive, time-consuming, require the use of toxic chemicals and solvents, and are impractical for implementing for large-scale testing. One method that has been extensively studied for measuring nutritional and bioactive components in faba beans is NIR spectroscopy. NIR spectroscopy has the advantages of being fast, non-invasive, requiring little or no sample preparation, the ability to measure multiple parameters with a single scan, and can be implemented for large-scale testing. Mid-infrared (MIR) spectroscopy has been studied as well and while it is not as well-suited for the quantitative measurement of parameters of interest in faba beans as NIR, it does have a larger array of absorption peaks for a range of chemical bonds, making it a powerful tool for analyzing certain kinds of molecular changes in faba beans and other foods. This review paper discusses and analyzes studies that have been performed to analyze faba beans using both NIR and MIR spectroscopy.
NIR spectroscopy has historically been the dominant form of infrared spectroscopy used for food analysis due to low instrumentation cost, high signal-to-noise ratio, and greater penetration into the sample matrix due to the longer wavelengths used. Shortwave NIR spectroscopy can penetrate centimeters into a sample and can even be used for transmission through certain solids, such as whole grains. Longwave NIR spectroscopy has shorter penetration and is better suited for reflectance surface analysis of homogenous samples. Technological advances in NIR spectrometers have also enabled their use as both a portable instrument and on-line process measurement tool. The term proximate nutritional composition refers to broad classes of macronutrients that compose the majority of food. Some of these include moisture, protein, starch, ash, oil, crude fat, and crude fiber. NIR spectroscopy has been examined for the determination of numerous proximate nutritional composition parameters in faba beans as well as for discrimination analysis of both varieties and growing locations, leaf analysis, and root analysis. Shown below is a list of reviewed application studies for various parameters in faba beans.
Analyte Matrix Accuracy
| Protein Milled Seed | RMSE 0.56% | R² 0.96 |
| Protein | Not Reported CV 1.13% | |
| Protein Milled Seed | RMSECV 0.34% | |
| Whole Seed | RMSECV 0.60% | |
| Moisture Milled Seed | RMSE 0.30% | R² 0.93 |
| Starch Milled Seed | RMSECV 0.72% | R² 0.86 |
| Whole Seed | RMSECV Not Reported | |
| Oil Milled Seed | RMSECV 0.17% | |
| Whole Seed | RMSECV 0.18% | |
| Tannins Whole Seed | SEP 0.54% | |
| Vicine and Convicine Flour | SECV 0.094% | |
| Total Polyphenols Milled Seed | RMSECV 0.40 mg/g | |
| Whole Seed | RMSECV 0.42 mg/g | |
| Glycine Betaine Leaflets | RPD 1.81 |
 Protein and moisture are two of the first NIR spectroscopic applications ever developed for food products and the first protein study shown above as well as the moisture study were conducted in 1978. Two separate models were developed: protein using the ratio of absorption at 2180 nm to absorption at 2100 nm and moisture using the ratio of absorption at 1940 nm to absorption at 1800 nm. Both models showed a correlation coefficient higher than 0.90 and considering the limited instrumentation available at the time, prediction error and correlation are excellent. Another study used a limited sample set of fifty samples to build a calibration model for protein and showed good correlation with validation predictions showing a standard deviation between values obtained from the NIR calibration model and reference Kjeldahl method of 0.28% and a coefficient of variability of 1.13%. Other protein studies included a study that determined protein content of faba beans in an attempt to optimize crop combinations of various plants to obtain the greatest protein yield per acre and a study that compared determining protein in ground faba bean powder with determining protein in intact seeds. Results and correlation were far better for the ground powder than intact seeds, with the powder model showing a correlation coefficient of 0.94 and a RMSECV of 0.34% and the intact seed model showing a correlation coefficient of 0.76 and a RMSECV of 0.60%. The higher error in the intact seed model is almost surely due to greater heterogeneity and light penetration of only the outer seed surface.
Starch is another important parameter in not only faba beans but all grain and legume products that plays an important role in determining overall nutritional quality. One study analyzed determining starch in ground faba beans with over two hundred samples, showing reasonable results of a correlation coefficient of 0.86 and RMSECV of 0.72%. The same study also analyzed oil content in both ground and whole faba beans. Results were similar for both types of samples with correlation coefficients of 0.66 and nearly identical RMSECV of 0.17% and 0.18%. Considering the range of values for oil was small, from 0.48% to 1.99%, these results are reasonable and the models are considered adequate for screening purposes. Polyphenols are one of the major groups of phytochemicals in faba beans. They are known for their health benefits, especially for positive cardiovascular effects. NIR spectroscopy has been examined to predict the total polyphenol content in ground faba bean with a correlation coefficient of 0.79 and RMSECV of 0.40 mg/g. These results show potential to replace the traditional reference method of the Folin-Ciocalteu assay, which is time-consuming and expensive to implement. Tannins are a complex group of polyphenols that are considered anti-nutritive because they can reduce the efficiency of nutrient uptake and metabolism. It is important to consider tannin concentration when developing new faba bean varieties and one study examined using NIR spectroscopy for this purpose. Sixty whole faba bean samples were used with a range from 0.01% to 7% w/w (although no samples from 1% to 3.5% were in the calibration) and good correlation was obtained with a correlation coefficient of 0.93 and SEP of 0.54%. Tannins are largely contained in the seed coat and this likely explains the strong correlation. Vicine and convicine are alkaloid glycosides that can cause problems if consumed by individuals with a certain type of blood enzyme. Although the concentration of these compounds in faba beans is typically low at around 0.6% to 0.9% w/w, one successful study reported good correlation in faba bean flour with a correlation coefficient of 0.968 and an RMSECV of 0.094%. It must be noted that calibrations of low concentration of micronutrients in faba beans and other foods may be actually measuring a secondary correlation of the micronutrients with certain macronutrients. While such a correlation is acceptable, it must be examined carefully and properly validated to determine if the correlation is real or not.
Other potential applications using NIR spectroscopy in faba beans include authentication of variety and growing area, leaf analysis of carbon and nitrogen, and root analysis. Mid-IR spectroscopy has also been examined and has shown good potential for a number of applications. It is better suited than NIR for molecular analytes like protein secondary structure, polymer characterization, starch crystallinity, and starch granular architecture. Mid-IR is also good for certain types of discrimination analysis, such as different colors of beans, cultivars, growing years, and high and low tannin varieties. While Mid-IR does contain a larger array of specific absorption peaks for a range of functional groups, the low light penetration, need to use Attenuated Total Reflectance (ATR) to increase signal amplitude, not being well-suited for both portability and on-line applications, and difficulty in use for quantitative measurements does limit it use. As more applications using infrared spectroscopy are studied and developed, there will be increased use of both NIR and Mid-IR spectroscopy to analyze faba beans and many potential applications could use both methods in conjunction with each other.
Near-Infrared Spectroscopy (NIRS) Applied to Legume Analysis: A Review
Legumes are a very important food in the human diet. They are known for their health benefits and high nutritional value. About twenty types of legumes are used as dry grains for human nutrition in many parts of the world and are sources of complex carbohydrates, protein, dietary fiber, vitamins, and minerals. These include common beans, peas, chickpeas, and lentils. Consumption of these products is increasing every year and there is a need to develop methods for analyzing parameters of interest in legumes. Conventional methods for determining nutritional composition in legumes are time-consuming, expensive, often require the use of toxic chemicals and solvents, require sample destruction, and are impractical for implementing for large-scale testing. One method that has been studied extensively for replacing traditional methods is NIR spectroscopy. While NIR spectroscopy does require collecting spectra of samples, performing reference tests, and building chemometric models that correlate the NIR spectra to parameters of interest, once this process is completed the advantages are enormous. NIR spectroscopy is fast, non-invasive, requires little or no sample preparation, does not destroy samples, and has the ability to measure multiple parameters with a single light scan once calibrations are made. There have been a number of application studies to determine the feasibility of using NIR spectroscopy as an analytical tool for analysis of legumes and many of these studies are reviewed here. Shown below is a list of application studies for various types of legumes.
Faba Bean
Sample Parameter Accuracy
| 244 milled & intact seeds Protein (Milled) | RPD = 4 | R² = 0.97 |
| Protein (Whole) | RPD = 2 – 2.5 | |
| Starch (Milled) | RPD = 3 | R² = 0.93 |
| Starch (Whole) | RPD = 2 – 2.5 | |
| Polyphenols (Milled) | RPD = 2 – 2.5 | |
| Oil | RPD = 2 – 2.5 | R² = 0.89 |
This application study for analyzing faba beans using NIR spectroscopy showed excellent results for protein in the milled samples. RPD is defined as Residual Prediction Deviation, the standard deviation of observed values divided by the Root Mean Square Error of Prediction (RMSEP). It is a metric of model validity and is considered more objective than RMSEP as well as more easily comparable across different model validation studies. Protein in intact seed samples showed lower correlation and this is most likely due to large differences in the size of the particles and the fact that milled samples are more homogenous. The starch model for milled samples also showed good predictive capacity. Whole seed models for starch, milled seeds for polyphenols, and oil did not show good enough results for practical use.
Soybean
Sample Parameter Accuracy
| 153 whole grains Crude Protein | R² = 0.97 | RMSEC = 0.61 | RMSEP = 0.76 |
| Fat | R² = 0.97 | RMSEC = 0.36 | RMSEP = 0.41 |
| 80 samples Total Dietary Fiber | R² = 0.80 | RMSEC = 1.7 | RMSEP = 0.86 |
The two application studies shown here determined crude protein, fat, and total dietary fiber in soybean. Results for protein and fat were excellent and demonstrate the potential of NIR spectroscopy to replace traditional reference methods for measuring these parameters in soybeans. The model for total dietary fiber was less accurate but still has an acceptable correlation coefficient and reasonable error in predictions, indicating that this model could be used for screening purposes.
Chickpea and Pea
Sample Parameter Accuracy (Milled/Whole)
| 156 pea samples Crude Protein | R² = 0.99/0.94 | SECV = 0.27/0.57 |
| Moisture | R² = 0.90/0.51 | SECV = 0.19/0.39 |
| 151 chickpeas Moisture | R² = 0.77/0.84 | SECV = 0.36/0.31 |
| Ash | R² = 0.77/0.72 | SECV = 0.19/0.39 |
| Seed Weight | R² = 0.89/0.88 | SECV = 1.50/1.50 |
| Hydration Capacity | R² = 0.82/0.90 | SECV = 3.33/2.65 |
| Percentage of Husk | R² = 0.64/0.74 | SECV = 5.46/5.05 |
| Peeling Efficiency | R² = 0.59/0.80 | SECV = 1.23/0.85 |
| Cooking Quality | R² = 0.53/0.71 | SECV = 2.93/2.40 |
The calibration models for pea showed excellent correlation for both types of samples for crude protein and good correlation for milled peas but poor correlation in whole peas for moisture. In general, the chickpea calibration models were better for the ground samples when measuring chemical composition but better for the whole samples when measuring physical or functional properties. The grinding of the samples makes them more homogenous, making the chemical properties more easily determined while likely causing a change in the physical properties.
Fresh and Frozen Peas
Sample Parameter Accuracy (Fresh/Frozen)
| 114 samples Alcohol Insoluble Solids | R² = 0.96/0.84 |
| Dry Matter | R² = 0.97/0.96 |
| Sensory Attributes | R² = 0.97/0.97 |
| Firmness of Flesh | R² = 0.83 (Fresh) |
| Sweet Flavor | R² = 0.82 (Fresh) |
| Strength of Flavors | R² = 0.76 (Fresh) |
| Brightness of Color | R² = 0.89 (Fresh) |
Results from this study were good and demonstrated the ability of NIR spectroscopy to measure chemical and physical indicators of maturity in peas. Decent correlation was attained for sensory attributes for texture and flavor. There is potential to use the methods developed here for on-line sorting of peas by degree of maturity in a pea processing factory.
Dry Pea Flour
Sample Parameter Accuracy
| 123 samples Amylose | R² = 0.95 |
| Resistant Starch | R² = 0.76 |
| Digestible Starch | R² = 0.80 |
| Total Starch | R² = 0.88 |
This application study used Multi-Linear Regression (MLR) calibration models to predict amylose, resistant starch, digestible starch, and total starch in dry pea flours. Values predicted by the calibration models were in good agreement with the laboratory reference values for the parameters of interest, proving the feasibility of the correlations and calibration models.
Common Bean
Sample Parameter Accuracy (Dispersive/FT-NIR)
| 54 genotypes (White and Colored) Protein | R² = 0.96-0.97 |
| Starch | R² = 0.95-0.96 |
| Amylose | R² = 0.94-0.95 |
This study compared two different types of NIR spectrometers for analyzing protein, starch, and amylose in different genotypes of common bean. Correlation was higher and predictive performance was better for models using an FT-NIR spectrometer than for models using a dispersive spectrometer.
Sample Parameter Accuracy
| 121 samples Moisture | R² = 0.94 | SEP = 0.39 |
| Starch | R² = 0.88 | SEP = 0.9 |
| Protein | R² = 0.94 | SEP = 0.56 |
| Fat | R² = 0.74 | SEP = 0.13 |
An independent validation set was used to confirm the validity of the models and there was good agreement between the predicted values from the NIR calibrations and reference methods, especially for starch and protein.
Sample Parameter Accuracy (Whole/Milled)
| 90 seed coats Dietary Fiber | SEP = 1.23/2.60 |
| Uronic Acids | SEP = 1.40/1.49 |
| Ash | SEP = 2.03/3.49 |
| Calcium | SEP = 2.40/3.57 |
| Magnesium | SEP = 1.33/1.50 |
The models developed in this application study showed sufficient results for screening of ash and calcium using NIR spectroscopy. Samples scanned were ground husk and all models with the exception of uronic acids, which showed very poor correlation, could be used for rough screening and classifying seed husks based on the parameter of interest. All studies discussed here have shown the potential to use NIR spectroscopy as a replacement for traditional expensive and time-consuming reference methods for determining parameters of interest in legumes.
https://www.ijeit.com/Vol%208/Issue%204/IJEIT1412201810_05.pdf
Near-Infrared Spectroscopy and Aquaphotomics for Monitoring Mung Bean (Vigna radiata) Sprout Growth and Validation of Ascorbic Acid Content
Mung bean is an important food commodity, especially in Asia. It is a cheap protein source in cereal based diets and can be either eaten whole, cooked, or fermented or milled into flour. Mung bean flour is used to make multiple products, including noodles, breads, and various bakery products. In addition to significant amounts of protein, mung bean also contains fiber, soluble fiber, potassium, vitamins, and minerals. Phosphorous content is significant and the molecules come in the form of phytate, an anti-nutritive component that binds with minerals and thus creates insoluble compounds. However, processes such as germination, soaking, fermentation, and cooking have all been proven to reduce these anti-nutritive effects of phytate. During sprouting, many nutritional compounds are formed and one significant compound is ascorbic acid, better known as Vitamin C. Ascorbic acid is significantly affected by the germination time. Initial content has been reported as low as 3 mg/100 g and the final content after germination can go as high as 98 mg/100 g. There are several quality components that can be used to determine germination time in addition to ascorbic acid, such as water content, pH, and conductivity. However, determining these components in sprouting mung beans is time-consuming, requires sample destruction, uses toxic chemicals and solvents for some tests, and is impractical for large-scale testing. NIR spectroscopy was examined as a method for determining germination time and ascorbic acid content in mung bean. Using NIR spectroscopy is often a correlative method, meaning that while the exact composition of the sample may not be measured after the creation of calibration models, a measurable component (such as water content) that is correlated with other parameters of interest (such as germination time and ascorbic acid) can indirectly determine the parameters of interest. In such cases, models must be carefully examined and validated to ensure proper correlation. One such method for doing this is known as aquaphotomics, which characterizes complex aqueous systems through changes in the hydrogen bonding network of water molecules from 1300 nm to 1600 nm. A simpler explanation is that low concentration components that are below the threshold of detection for NIR spectroscopy can in fact be measured indirectly if they cause a change in water molecules, which are highly absorbing of light in the near-infrared range.
Mung beans from Thailand were procured for the study. Six separate 400 g packages were homogenized and separated into twenty-one different holders, each containing about 100 g of beans. Germination time was set for zero hours to one hundred twenty hours. A standard soaking, draining, and incubation process with constant temperature and humidity was used for germination. At each desired germination time, the beans in that holder were dried and scanned using an NIR spectrometer. Twenty bean samples from each holder were scanned in triplicate from 900 nm to 1700 nm. After bean sprout scanning, 100 g of each sprout was weighed, mixed with distilled water, crushed, and filtered. The filtrate was divided into portions for reference tests for pH, conductivity, and ascorbic acid content. Another portion was also scanned using the same NIR spectrometer but after placement in a 1 mm quartz cuvette. Water content was determined by drying bean sprouts in an oven. Various pre-processing methods were applied to the spectral data before chemometric analysis. NIR spectra of the bean sprouts were used to create a Linear Discriminant Analysis (LDA) model to classify the germination time of bean sprouts at 24 h intervals. NIR spectra of the filtrate was used with reference values for germination time, water content, and ascorbic acid to create Partial Least Squares (PLS) models correlating the spectra to these parameters of interest. Models used the wavelength range from 1300 nm to 1600 nm.
Whole Beans LDA Classification Based on 24 Hour Intervals of Germination Time
Bean Sprout Extract | 100% Accuracy
| Germination Time (h) | R² = 0.960 | RMSEC = 8.18 |
| Water Content (% | R² = 0.966 | RMSEC = 2.34 |
| Ascorbic Acid (mg/100 g) | R² = 0.962 | RMSEC = 22.9 |
The results of this study show promise for determining germination time, water content, and ascorbic acid in mung bean. However, there was a fair amount of error in the predicted values for these parameters despite the high correlation coefficients. One likely reason for this is that reference tests were only performed for samples every twenty-four hours, creating a large number of samples that likely exhibited spectral differences but had the same reference values for the parameters of interest. Results are likely to improve with more frequent sampling and reference tests. Aquaphotomics analysis did determine a good correlation between water content, germination time, and ascorbic acid content. More work is needed before using these models in a practical setting but the potential was demonstrated to use NIR spectroscopy as a fast and non-invasive method for determining germination time, water content, and ascorbic acid content in mung beans.
Comparison and Application of Non-Destructive NIR Evaluations of Seed Protein and Oil Content in Soybean Breeding
Soybean is a major crop grown worldwide and plays an important role in agricultural production, industrial biofuel manufacturing, and international trade. On average, the dry weight of soybeans contains around 40% protein and 20% oil, with most of the remaining composition containing carbohydrates, minerals, and water. There are a number of reasons why analysis of nutritional components and other important traits is necessary. Breeders need to assess large numbers of breeding materials for multiple traits in a short period of time to select the desired genotypes in breeding populations with complicated variations. Soybean usage is very dependent on seed composition. High oil breeds are used for vegetable oil processing and biodiesel manufacturing, while high protein is preferred for human diet and soy food products. Determining protein and oil composition requires wet chemistry methods such as the Kjeldahl method for protein and the Soxhlet method for oil. While accurate, both methods are time-consuming, expensive, require sample destruction and the use of toxic chemicals, and are impractical for implementing for large-scale testing. NIR spectroscopy was examined as a method for determining protein and oil content. Two separate spectrometers with pre-built calibrations with protein and oil for soybeans were used in the study. One instrument is for laboratory use while the other is portable and can be used in the field. Whole seed samples of sixteen different genotypes were procured for the study. For four of the sixteen genotypes, additional samples were taken from either a different harvesting year or location to examine the variability from different seed sources. Protein and oil content were analyzed using the laboratory NIR spectrometer, portable NIR spectrometer, and wet chemistry methods. In total, seven hundred and sixty soybeans were scanned with the spectrometers.
Laboratory NIR Spectrometer – Correlation with Wet Chemistry Methods
| Protein | R² = 0.977 |
| Oil | R² = 0.960 |
Correlation with the reference methods was excellent when using the laboratory NIR spectrometer but much poorer when using the portable NIR spectrometer. However, this was expected as the laboratory NIR spectrometer used calibrations developed and updated by the manufacturer while the calibrations used for the portable instrument were the original installed calibrations. After analysis of the spectral data, it was determined that both genotype and particle size of the seeds had significant effects on the predictions. After analysis of the variations and bias corrections to the equations used for the calibrations, both correlation coefficients for the protein and oil models for the portable instrument increased to higher than 0.75. Results were validated by predicted values from an additional two hundred and forty samples scanned with the portable instrument. The study showed that the laboratory instrument could be used for quantitative analysis of protein and oil in soybeans while the portable instrument could be used for screening single plants in breeding selection.
Agronomy | Free Full-Text | Comparison and Application of Non-Destructive NIR Evaluations of Seed Protein and Oil Content in Soybean Breeding (mdpi.com)
Use of Near-Infrared Reflectance Spectroscopy for the Estimation of the Isoflavone Contents of Soybean Seeds
There has been increased interest in the composition and physiological functions of food products in recent years as consumers look for healthy and alternative foods in their diet. With this increased interest, it is important for food sellers to obtain and promote food with higher nutritional composition. Isoflavones are one family of compounds found in soybeans that may be associated with lower rates of postmenopausal cancer in women as well as helping to prevent osteoporosis. The traditional method for analyzing isoflavone content is HPLC which is effective, but time-consuming, expensive, requires sample destruction and the use of toxic chemicals, and is impractical for implementing for large-scale testing. NIR spectroscopy was examined for determining isoflavone content in soybeans. Forty-eight soybean samples were procured from different growing areas in Japan for the study. All samples were scanned using an NIR spectrometer from 1100 nm to 2500 nm at 2 nm intervals. After scanning, all samples were milled and the powdered samples were scanned again using the NIR spectrometer. Isoflavone content was determined by HPLC. Individual components of isoflavone were determined as well. Various pre-processing methods were performed on the NIR spectra before chemometric analysis. Multi-Linear Regression (MLR) calibration models were created for total isoflavone and individual components correlating the NIR spectra to parameters of interest. The NIR spectra for thirty-six samples were used as a calibration set and the remaining twelve samples were used for a validation set.
Total Isoflavone
| Intact Samples (mg/100 g) | R² = 0.92 | SEP = 38.51 |
| Powdered Samples (mg/100 g) | R² = 0.85 | SEP = 63.43 |
Results for total isoflavone showed high correlation for the powdered samples and decent correlation for the intact samples. The range of values for the calibration set was from 133.44 mg/100 g of dry weight to 633.42 mg/100 g of dry weight. Independent predictions using the validation set confirmed the validity of the models. Models were also created for the individual isoflavone components and while some of them had high correlation coefficients, it is almost certain that these models are correlating to something besides the individual isoflavone components as the concentration of these parameters is far below the threshold of detection for NIR spectroscopy. Some components had a mean value of less than 10 mg/100 g and the model for these is definitely correlating another parameter which is measurable using NIR spectroscopy. It is possible that the individual components are affecting macronutrient concentration which is then the basis for the correlation to the NIR spectra. However, such an indirect correlation must be examined and validated carefully. This study showed that measuring the total isoflavone content in soybeans is feasible in both intact and powdered samples of soybeans.
Seed Mineral Composition and Protein Content of Faba Beans (Vicia faba L.) with Contrasting Tannin Contents
Faba bean is widely grown around the world and is used as a source of protein in human diets, as fodder and a forage crop for animals, and also has a good ability to fix atmospheric nitrogen. It is also a good source of energy, fiber and minerals. Protein content is high ranging from 24% to 35% of the seed dry matter. Mineral content is especially important because an estimated two-thirds of the world’s population are at risk of deficiency of one or more essential minerals, such as calcium, magnesium, zinc, and potassium. One course of action that has been studied to help address mineral deficiencies in humans is genetic biofortification through plant breeding. The technique involves screening and developing micronutrient rich germplasm, conducting genetic studies, and developing molecular markers to facilitate breeding. While this method is effective, it does require testing that can be expensive, time-consuming, and difficult to implement on a large-scale. One potential way to help facilitate these kinds of studies and tests is to investigate variations in chemical and genetic composition by genotype, growing area, and other environmental factors and then correlate those with an easily measurable macronutrient component. In this study, different faba bean genotypes from different growing areas were investigated for variation of mineral components and protein using NIR spectroscopy and other testing methods to correlate these parameters with contrasting tannin contents. Twenty-five different faba bean genotypes grown at three different locations in Canada during two separate growing seasons were procured for the study. Each location had a different soil type as well. Plot samples were threshed, washed, and ground to a fine powder. Micronutrients were analyzed using the standard method of Inductively Coupled Plasma Mass Spectrometry (ICP-MS). Protein content was determined using an NIR spectrometer with a pre-built calibration for protein. It is known that genotypes that are white-flowered contain low tannins while spotted-flowered contain high tannins. The combination of year and location was considered as “environment” and two different data analysis algorithms were applied. Mixed Model Analysis of Variance (ANOVA) was used to determine variance with genotype as a fixed effect while location, year, and replications nested within the site-year were considered random effects. Principle Component Analysis (PCA) was used to characterize associations among genotypes, mineral elements, and protein. The data analysis indicated that both the seed minerals concentrations and protein were affected by environmental variation and the tannin profile. Specifically, low-tannin white-flowered faba beans were found to be rich in calcium, magnesium, iron, and zinc, which are minerals that are known to be deficient in the human diet for many people. A higher protein content was also found in these beans. The high heritability observed for mineral concentrations in the seeds suggest that genetic improvement is possible for these traits. While more study and a deeper examination would be required, this study shows the potential to use NIR spectroscopy as a tool for helping to correlate protein concentration in faba beans with tannin and mineral concentration to assist in genetic breeding.
Robust Prediction Performance of Inner Quality Attributes in Intact Cocoa Beans Using Near-Infrared Spectroscopy and Multivariate Analysis
Chocolate is made from raw cocoa beans that are extracted from the cocoa tree pod and then roasted, fermented, or ground into formation of processed products. It can be formulated into a paste or solid-state from a roasted or ground cocoa and fat combination. Chocolate is typically sweetened with additional sugar and other ingredients, formed into bars, and eaten as confectionery. There are two quality classifications for cocoa beans: bulk cocoa which is considered standard quality and flavor cocoa which is considered high quality. Chocolate manufacturers need to check their incoming cocoa beans to ensure they are high quality. Fat and moisture content are considered the two primary quality parameters in cocoa beans. Current methods for determining quality parameters in cocoa beans are time-consuming, expensive, require the use of toxic chemicals and solvents as well as sample destruction, and are impractical for implementing for large-scale testing. Fat testing is done by the Soxhlet method which is both time-consuming and uses solvents. Moisture testing requires a drying and gravimetric method which takes well over an hour. NIR spectroscopy was examined as a method for determining fat and moisture content in cocoa beans. One hundred and ten bulk cocoa bean samples that were harvested from June to August from the same plantations in Indonesia were procured for the study. Each bulk sample contains around 54 g of intact beans. All samples were scanned using an NIR spectrometer from 1000 nm to 2500 nm with a scan interval of 0.2 nm. Thirty-two scans were collected per reading and averaged into one spectrum per sample. Fat and moisture content were determined for each sample using the standard Soxhlet and gravimetric methods. Various pre-processing methods were applied to the spectral data before chemometric analysis. Partial Least Squares (PLS) calibration models were created correlating the fat and moisture content to the NIR spectra.
| Fat | R² = 0.86 | RMSEP = 0.79 |
| Moisture | R² = 0.92 | RMSEP = 0.41 |
The results indicate that NIR spectroscopy is a feasible method for determining fat and moisture content in cocoa beans. Cross-validation was performed by removing spectra from the calibration models, recalculating the models without those spectra, and then using the new models to predict values from the removed spectra. Predictions were in good agreement with the reference method values which confirms the validity of the models. Before using these models in a practical setting, further study and addition of data would be warranted. Samples from more growing areas and from different harvest seasons would likely improve modeling results. This study shows the potential to use NIR spectroscopy as a faster and cheaper alternative to traditional methods for determining fat and moisture content in cocoa beans.
Rapid Prediction of Moisture Content in Intact Green Coffee Beans Using Near Infrared Spectroscopy
Moisture is a very important quality parameter in green coffee beans and is strictly regulated by most countries that import and export coffee. The safe range for moisture is from 8% to 12.5% based on fresh matter. Moisture below 8% causes shrunken beans and an unwanted appearance. Moisture above 12.5% facilitates fungal and mycotoxin growth as well as the potential for problems during storage and the roasting process. NIR spectroscopy was examined as a method for measuring moisture content in both Arabica and Robusta green coffee beans. Twelve sets of samples were used for the study: Three Arabica species and four Robusta species of different origins for the calibration set and two Arabica species and three Robusta species of different origins for the validation set. NIR diffuse reflectance spectra were collected from all samples from 1000 nm to 2500 nm at 2 nm intervals. Each individual spectrum consisted of the average of sixty-four scans. Three replicates were acquired for each sample and these spectra were averaged as well, resulting in one hundred and eight total spectra of the twelve different samples. Reference values were obtained for moisture and these were used with the NIR spectra to create Partial Least Squares (PLS) calibration models for moisture content.
| Moisture (Full Wavelength Range) | R² = 0.9850 | RMSEP= 0.57% |
| Moisture (Selective Wavelengths) | R² = 0.9743 | RMSEP= 0.77% |
Two sets of PLS calibration models were created: one using the full wavelength range and the other using seven selective wavelengths that were chosen based on the correlation of the full range model. Some of these are moisture absorbing areas of the NIR spectrum and others correlate to organic compounds affected by a change in moisture: 1155 nm, 1212 nm, 1340 nm, 1409 nm, 1724 nm, 1908 nm, and 2249 nm. Prediction results on the validation set using both models proved the feasibility of the measurement. Results were comparable for both models and either could be applied in an on-line setting to determine moisture in green coffee beans.
Reliable Discrimination of Green Coffee Beans Species: A Comparison of UV-Vis-Based Determination of Caffeine and Chlorogenic Acid with Non-Targeted Near-Infrared Spectroscopy
Coffee consumption is increasing every year across the world and adulteration is a common problem in the coffee market. The two types of coffee beans are Arabica and Robusta. Arabica makes up around 58% of global production of coffee while Robusta makes up the remaining 42%. They differ in several aspects such as taxomonic classification, morphology, bean size and color, chemical compounds, and sensory evaluation. There are limitations to visual inspections of the beans because the physical characteristics can vary considerably between species and varieties due to different genotypes and environmental factors. Certain varieties of Arabica also have sensory properties very similar to Robusta, such as mouthfeel and bitterness. The average annual price of Arabica green coffee beans is around $2.51 per kg while the price of Robusta is around $1.63 per kg. The price difference makes substituting Robusta for Arabica enticing and thus there is a problem with adulteration that can also include substituting less desirable varieties from different geographical regions. Both NIR and UV-Vis spectroscopy were examined for discriminating between different species of green coffee beans. UV-VIS spectroscopy has been used as a method to determine caffeine and chlorogenic acid content in coffee beans and in this study, it was used to also discriminate between Arabica and Robusta beans. Seventy-four green coffee beans samples from different locations in Indonesia were procured for the study. The samples were chosen specifically to represent different environmental factors, agricultural practices, and genetic characteristics. They were sourced from thirty-eight different processing facilities during the same harvesting season. Thirty-two samples were Arabica and forty-two were Robusta. Caffeine and chlorogenic acid were determined using UV-VIS spectroscopy by standard methods and procedures. An FT-NIR spectrometer was used to scan all samples from 1000 nm to 2500 nm at 2 nm intervals. Each sample was scanned sixty-four times and the scans were averaged into a single spectrum. This process was repeated three times and the three spectra per sample were further averaged into one spectrum. Various pre-processing methods were applied to the spectral data before chemometric analysis. Linear Discriminant Analysis (LDA) was performed on both the UV-VIS spectra and NIR spectra as a model for discriminating between species. In the case of the UV-VIS spectra, differences in values between species for caffeine and chlorogenic acid were analyzed as well. Results are shown below.
LDA
| UV-VIS | 97.3% Correct Classification |
| NIR | 95.5% Correct Classification |
The results for both sets of spectra show that both methods can be used to discriminate between Arabica and Robusta coffee beans. There was some overlap in caffeine and chlorogenic acid values between the two species, indicating that these values alone cannot be used as a basis for classification. While the results were slightly better using the UV-VIS spectra for discrimination between the two species, it must be noted that UV-VIS spectroscopy is a far more labor intensive method than NIR spectroscopy. UV-VIS requires extensive sample preparation and the use of solvents and standard solutions. By contrast, once a calibration model is created NIR spectroscopy only requires collecting a spectrum for analysis, typically taking around thirty seconds per reading. The results here show the potential to use NIR spectroscopy for classifying Arabica and Robusta coffee beans. Further research should include beans of different species and varieties from different parts of the world.
Application of Detrended Fluctuation Analysis and Yield Stability Index to Evaluate Near Infrared Spectra of Green and Roasted Coffee Samples
The quality of coffee is determined by many factors, such as species, variety, geographic location, and processing method. The physical properties and chemical composition of the final product are all dependent on these factors and thus affect the final price of coffee in the market. Variation can be significant and NIR spectroscopy is a proven method for determining numerous chemical and physical properties in coffee beans as well as discrimination analysis and adulteration detection. Some of these include caffeine, color, roasting conditions, roasting degree, Arabica/Robusta ratio in ground coffee, place of origin, chemical composition of coffee grounds, and sensory properties of beverages. NIR spectroscopy does require the use of chemometric modeling to correlate NIR spectra to parameters of interest. There are numerous multivariate statistical methods that can be used as well as pre-processing techniques that help extract the maximum information from the NIR spectra. Two promising methods which have recently been applied to NIR spectroscopy are Detrended Fluctuation Analysis (DFA) and Yield Stability Index (YSI). DFA is a widely used time series data analysis tool and has been applied in multiple applications such as high-viscosity gad-liquid flows, water contaminant classification, EEG patterns associated with real and imaginary arm movements, air traffic flow analysis, and even for the analysis of NBA basketball games. YSI was developed to measure extremities in a time series for agriculture by measuring the proportion of annual yields being reasonably close to the expected trend value within a given time period. When applied to NIR spectroscopy of coffee spectra at different roasting levels, it should provide information about the stability of the signals. In this study, DFA and YSI applications were introduced on NIR spectra of different coffee samples with varying roasting levels. Fifteen different coffee samples (fourteen Arabica and one Canephora Robusta) were procured from different parts of the world for the study. Before roasting, each sample was scanned using a FT-NIR spectrometer from 12500 cm-1 to 3800 cm-1 at 16 cm-1 resolution. Sixteen scans were collected per reading and averaged into one spectrum. Samples were then divided into three portions and roasted at three separate levels: light, medium, and dark. NIR spectra were then collected for all the roasted samples using the same parameters. Various pre-processing methods were applied to the NIR spectra before analysis. Principle Component Analysis (PCA) was first performed followed by DFA and YSI. PCA was able to successfully show differentiation of the roasting levels after preprocessing when all samples were analyzed together. DFA showed clear discrimination between the green unroasted samples and roasted samples but discrimination was not so clear between different roasting levels. However, DFA was able to discriminate very well between roasting levels within the same group of samples. This is an important distinction because DFA analyzes one spectrum at a time while PCA analyzes the entire data set at the same time. This makes PCA disadvantageous if PCA was used for a new set of samples. The nature of DFA makes it possible to set certain coefficients in the data set as global thresholds for determining if a sample is green, light, medium, or dark roasted. YSI was used to show stability by higher YSI values and the light roast samples were the most stable of all roasting levels. Additional research should focus on the application of DFA in terms of analysis on the effects of other transformation methods of the spectra and to analyze different types of samples to determine the robustness of the method.
The post Beans Analysis appeared first on NIR-For-Food.
]]>The post Wheat Overview appeared first on NIR-For-Food.
]]>Introduction
Wheat is a grass that is widely cultivated for its cereal grain seed and is a worldwide staple food. It has been cultivated on earth for over ten thousand years, with the earliest evidence from the Middle East Fertile Crescent region around 9600 BC. The grain is often milled into flour and used to make foods like bread, pasta, noodles, cereals, crackers, pancakes, numerous dessert foods, and many others. Wheat straw is used as an animal feed and in the manufacture of carpets, baskets, packing, bedding, and paper. Wheat is grown on more land area than any other food crop and world trade in wheat is greater than that of all other crops combined. Per the United Nations Food and Agriculture Organization, wheat crop land area was 220.4 million hectares in 2014 and estimated production of wheat in 2019 was 766 million metric tons, making it the second most produced cereal food after maize. Production of wheat has tripled since 1960 and is expected to continue to grow. Global demand for wheat is increasing due to a number of factors. It is a major source of starch, carbohydrates, and energy as well as a number of healthy nutritional components, such as protein, vitamins, dietary fiber, and phytochemicals. It is the leading source of vegetable protein in human food with a protein content of around 13%. This is relatively high compared to other cereals, but low in protein quality for supplying essential amino acids. The unique properties of gluten proteins help facilitate the production of processed foods. Consumption of processed foods is increasing due to worldwide industrialization and the “Western Diet” phenomenon, marked by an increased consumption of processed foods. It is an important food for livestock as well as humans. There are numerous wheat species which differ in nutritional value as well as the type of food they are used to make. It is estimated that around 30,000 wheat varieties of fourteen different species are grown worldwide and approximately one thousand are considered commercially significant. Different areas are suited to growing specific species of wheat based on climate, soil, and other environmental factors. The major wheat species grown throughout the world is known as Triticum aestivum, better known as common or bread wheat. Another major species is T. turgidum var. durum, a species well adapted to the hot and dry conditions around the Mediterranean Sea and regions with similar climates. It is commonly known as pasta wheat or durum wheat. As is the case with all agricultural products, disease and pests are problems when growing wheat. The different types and severity of diseases and pests vary in different parts of the world and farmers can employ different strategies for minimizing effects, such as choosing resistant varieties, good seed quality, selective field planting, crop rotation, delayed planting, and proper application of pesticides and fungicides when needed. Many advances in soil preparation, seed placement, crop rotation, fertilization, harvesting methods, and more recently, breeding and genetics, have combined to increase the viability of wheat as a major worldwide food product.
Wheat Growing, Harvesting, Processing
 Many varieties of wheat are grown in two seasons: spring wheat and winter wheat. Spring wheat is typically planted in early spring and harvested in the late summer. Winter wheat is planted in the fall and harvested in the summer. Spring wheat is often referred to as a “tough crop” because it keeps its growing point below the ground during early spring, preventing it from being harmed by late spring frost. The first step in growing wheat is choosing a suitable location with fertile soil with a loam texture, good structure, and moderate water holding capacity. Soil is prepared by plowing and adding natural fertilizers. For commercial wheat farming, an average of 50 kg Nitrogen, 25 kg Phosphorus, and 12 kg Potash is sufficient in one acre of land. It is important to select a variety of wheat that is suitable for growing in the climatic conditions of the farm area. Typically, 40 kg to 50 kg of seeds are required per acre of land. Seeds are cleaned before sowing and if necessary, fungicide can be applied after cleaning. Wheat seeds are sown in 4 cm to 5 cm of soil in rows that are spaced out at 20 cm between the rows. With proper preparation, additional fertilization and weeding are minimal once the seeds are planted. Irrigation is important and must be first done twenty to twenty-five days after planting. Additional irrigation is required every twenty days or so until harvesting.
Spring wheat is typically ready for harvesting about four months after planting. Winter wheat takes about seven to eight months because of the dormant winter period. Before harvesting, the moisture level must be tested and should be between 14% and 20%. The green color in the wheat should be gone before harvesting. Traditional methods of harvesting wheat were by hand or with a horse-drawn binder but these are quite labor-intensive and only done on small farms these days. A machine called a combine is used for harvesting. It is designed for efficient harvesting of mass quantities of grain and the largest modern combines can cut through an area in the field more than forty feet wide. Combines can be fitted with different heads to harvest many different types of grains including wheat, corn, soybeans, oats, rye, barley, sunflowers, and canola. The name combine comes from combining three essential harvest functions into a single process: reaping, threshing, and winnowing. Reaping is the cutting of the grain. It is important to adjust the combine header in relation to the height of the wheat to get the most wheat with the least amount of straw as well as adjust the reel speed relative to the ground speed. Going too fast will either knock the wheat down or cut it poorly. Going too slow can cause the wheat to fall to the ground or not enter the combine correctly. Threshing is the process of loosening the edible part of the grain from the straw. Winnowing is the method for separating grain from chaff. The cut crop is fed into the threshing cylinder, which consists of a series of horizontal rasp bars fixed across the path of the crop and in the shape of a quarter cylinder. These bars pull the crop through concave grates that separate the grain from the straw. The grain heads then fall through the fixed concaves. During this process, the grain husks are not removed from the paddy grain. Combine concaves perform both the threshing and winnowing processes and afterwards, usable grains are loaded into the grain tank. The wheat is then put into a grain cart for transport for storage in a grain elevator. Proper storage before transport for sale is essential to avoid both disease infection and pest infestation.
Transgenic Wheat and Genetic Engineering
Transgenic wheat is wheat that has been genetically engineered by the direct manipulation of its genome using biotechnology. Like other genetically engineered foods, transgenic wheat is a source of controversy and debate and resistance to the use of genetically modified wheat has been particularly strong. No genetically modified wheat is grown commercially anywhere in the world although field trials have taken place. Modifications to wheat that have been tested in transgenic field trials include resistance to herbicides, insects, and fungal pathogens, drought and heat tolerance, both increased and decreased content of gliadin and glutenin, improved nutrition content, increased water-soluble dietary fiber, increased plant yield, and improved qualities for use as a biofuel. The use of transgenic wheat to create low-gliadin strains is of particular interest as wheat and flour consumed by people with celiac disease and non-celiac gluten sensitivity (NCGS) must have a minimal amount of gluten in their diets. It is estimated that 1% of the world’s population suffers from celiac disease and up to 6% of the population in the United States suffers from NCGS. One genetically modified wheat, Bioceres HB4, has been approved for commercial use in Argentina. The variety is named for its expression of a transcription factor from sunflowers, known as HaHB4. It is said to be able to withstand drought as well as provide high yield. Commercial introduction is pending approval of the crop by Brazil, Argentina’s major wheat export partner.
One cause of major controversy and debate in transgenic wheat has been the discovery of genetically modified wheats in shipments even though genetically modified wheat is not approved for human consumption anywhere in the world with the exception of Bioceres HB4 in Argentina. In 1999, scientists in Thailand claimed to have found herbicide-resistant wheat in a shipment from the United States. The source of the claimed contamination was never found. In 2013, a similar strain which was tested extensively by Monsanto and approved by the FDA for use as food was found on a farm in Oregon. MON 71800 is the transgenic wheat strain that went the furthest in the approval process for commercial use in the United States, but the EPA application was withdrawn after market analysis in Europe and Asia showed that public resistance to the product was strong enough to have a large potential loss of these markets. After the discovery, Japan suspended soft white wheat imports from the United States and Monsanto was sued by a Kansas farmer who claimed the controversy caused a price drop in wheat in the market. Ultimately, the cause was never determined although Monsanto suggested that it was likely an act of sabotage and framed the incident as an isolated one. No evidence was ever found that the wheat had entered commercial supply. Imports returned to normal and market disruption was minimal. Other similar incidents have occurred with less press and fanfare and despite the fact that there have been few real consequences thus far from cross-contamination from unapproved transgenic wheat products, the fear for consumer safety and market disruption does remain a hindrance to commercialization of transgenic wheat.
Wheat and NIR Spectroscopy
NIR spectroscopy has emerged as a tool for rapid, non-invasive, and cost-effective analysis of parameters of interest in wheat that could potentially replace traditional reference methods. There are a number of quality parameters in both whole wheat kernels and wheat flour that have been studied and predicted with NIR spectroscopy with results suitable for process control purposes, such as moisture and protein. Other parameters have shown results good enough for screening purposes and more study and calibration work could improve the prediction results. These include total gluten content, glutenin and gliadin content, particle size, and baking water absorption. Particle size is directly correlated to hardness and determining hardness in wheat using NIR spectroscopy is an AACC certified method. Wheat straw residue decomposition potential is important for managing straw residue depending on rainfall levels in the region of planning. NIR spectroscopy has been examined for determining the fiber and chemical constituents in wheat straw that determine decomposition potential, such as neutral detergent fiber (NDF), acid detergent fiber (ADF), acid detergent lignin (ADL), cellulose, hemicellulose, carbon, and nitrogen. Both wheat and oat straw are strong sources of carbohydrates which can be hydrolyzed to fermentable sugars that are precursor substances for biofuels or building blocks for chemical syntheses. However, chemical pre-treatment is necessary to open up the lignocellulose structure and to increase the accessibility to microbial enzymes. NIR spectroscopy has been examined for determining key parameters of precursors of biofuel production, such as weight loss, residual lignin content, and hydrolysable sugars. Geographical origin of wheat is an important factor in determining quality, cost, and particular suitability for the products that will be manufactured from it. One study determined the feasibility of discriminating Durum Wheat samples from different regions of Italy from each other as well as from samples from other parts of the world. While not approved for commercial use, research is being conducted on transgenic wheat and developing wheat lines with low gliadin content is of particular interest because of the large number of people with celiac and related diseases. NIR spectroscopy has been studied for discriminating between wild wheat and transgenic wheat lines with low gliadin content using both whole grain and flour. All of these parameters and measurements have been studied using NIR spectroscopy with results showing the potential to replace traditional reference methods.
References
Wheat
https://plantvillage.psu.edu/topics/wheat/infos/diseases_and_pests_description_uses_propagation
The Contribution of Wheat to Human Diet and Health
https://www.ncbi.nlm.nih.gov/pmc/articles/PMC4998136/
How To Grow Wheat?
https://krishijagran.com/agripedia/how-to-grow-wheat/
Farming 101: Planting Wheat
https://www.agriculture.com/crops/wheat/farming-101-planting-wheat
How Long Do Wheat Plants Take Before the Harvest?
https://homeguides.sfgate.com/long-wheat-plants-before-harvest-69823.html
The Combine: King of the Harvest
Transgenic Solutions to Increase Yield and Stability in Wheat: Shining Hope or Flash In the Pan?
https://academic.oup.com/jxb/article/70/5/1419/5374683
Monsanto Wheat Scandal: What The Discovery of Unapproved Genetically Engineered Wheat Means For Our Food
https://foe.org/blog/2013-05-monsanto-wheat-scandal-what-the-discovery-of-unappro/
The post Wheat Overview appeared first on NIR-For-Food.
]]>