The post Wheat Overview appeared first on NIR-For-Food.
]]>Introduction
Wheat is a grass that is widely cultivated for its cereal grain seed and is a worldwide staple food. It has been cultivated on earth for over ten thousand years, with the earliest evidence from the Middle East Fertile Crescent region around 9600 BC. The grain is often milled into flour and used to make foods like bread, pasta, noodles, cereals, crackers, pancakes, numerous dessert foods, and many others. Wheat straw is used as an animal feed and in the manufacture of carpets, baskets, packing, bedding, and paper. Wheat is grown on more land area than any other food crop and world trade in wheat is greater than that of all other crops combined. Per the United Nations Food and Agriculture Organization, wheat crop land area was 220.4 million hectares in 2014 and estimated production of wheat in 2019 was 766 million metric tons, making it the second most produced cereal food after maize. Production of wheat has tripled since 1960 and is expected to continue to grow. Global demand for wheat is increasing due to a number of factors. It is a major source of starch, carbohydrates, and energy as well as a number of healthy nutritional components, such as protein, vitamins, dietary fiber, and phytochemicals. It is the leading source of vegetable protein in human food with a protein content of around 13%. This is relatively high compared to other cereals, but low in protein quality for supplying essential amino acids. The unique properties of gluten proteins help facilitate the production of processed foods. Consumption of processed foods is increasing due to worldwide industrialization and the “Western Diet” phenomenon, marked by an increased consumption of processed foods. It is an important food for livestock as well as humans. There are numerous wheat species which differ in nutritional value as well as the type of food they are used to make. It is estimated that around 30,000 wheat varieties of fourteen different species are grown worldwide and approximately one thousand are considered commercially significant. Different areas are suited to growing specific species of wheat based on climate, soil, and other environmental factors. The major wheat species grown throughout the world is known as Triticum aestivum, better known as common or bread wheat. Another major species is T. turgidum var. durum, a species well adapted to the hot and dry conditions around the Mediterranean Sea and regions with similar climates. It is commonly known as pasta wheat or durum wheat. As is the case with all agricultural products, disease and pests are problems when growing wheat. The different types and severity of diseases and pests vary in different parts of the world and farmers can employ different strategies for minimizing effects, such as choosing resistant varieties, good seed quality, selective field planting, crop rotation, delayed planting, and proper application of pesticides and fungicides when needed. Many advances in soil preparation, seed placement, crop rotation, fertilization, harvesting methods, and more recently, breeding and genetics, have combined to increase the viability of wheat as a major worldwide food product.
Wheat Growing, Harvesting, Processing
 Many varieties of wheat are grown in two seasons: spring wheat and winter wheat. Spring wheat is typically planted in early spring and harvested in the late summer. Winter wheat is planted in the fall and harvested in the summer. Spring wheat is often referred to as a “tough crop” because it keeps its growing point below the ground during early spring, preventing it from being harmed by late spring frost. The first step in growing wheat is choosing a suitable location with fertile soil with a loam texture, good structure, and moderate water holding capacity. Soil is prepared by plowing and adding natural fertilizers. For commercial wheat farming, an average of 50 kg Nitrogen, 25 kg Phosphorus, and 12 kg Potash is sufficient in one acre of land. It is important to select a variety of wheat that is suitable for growing in the climatic conditions of the farm area. Typically, 40 kg to 50 kg of seeds are required per acre of land. Seeds are cleaned before sowing and if necessary, fungicide can be applied after cleaning. Wheat seeds are sown in 4 cm to 5 cm of soil in rows that are spaced out at 20 cm between the rows. With proper preparation, additional fertilization and weeding are minimal once the seeds are planted. Irrigation is important and must be first done twenty to twenty-five days after planting. Additional irrigation is required every twenty days or so until harvesting.
Spring wheat is typically ready for harvesting about four months after planting. Winter wheat takes about seven to eight months because of the dormant winter period. Before harvesting, the moisture level must be tested and should be between 14% and 20%. The green color in the wheat should be gone before harvesting. Traditional methods of harvesting wheat were by hand or with a horse-drawn binder but these are quite labor-intensive and only done on small farms these days. A machine called a combine is used for harvesting. It is designed for efficient harvesting of mass quantities of grain and the largest modern combines can cut through an area in the field more than forty feet wide. Combines can be fitted with different heads to harvest many different types of grains including wheat, corn, soybeans, oats, rye, barley, sunflowers, and canola. The name combine comes from combining three essential harvest functions into a single process: reaping, threshing, and winnowing. Reaping is the cutting of the grain. It is important to adjust the combine header in relation to the height of the wheat to get the most wheat with the least amount of straw as well as adjust the reel speed relative to the ground speed. Going too fast will either knock the wheat down or cut it poorly. Going too slow can cause the wheat to fall to the ground or not enter the combine correctly. Threshing is the process of loosening the edible part of the grain from the straw. Winnowing is the method for separating grain from chaff. The cut crop is fed into the threshing cylinder, which consists of a series of horizontal rasp bars fixed across the path of the crop and in the shape of a quarter cylinder. These bars pull the crop through concave grates that separate the grain from the straw. The grain heads then fall through the fixed concaves. During this process, the grain husks are not removed from the paddy grain. Combine concaves perform both the threshing and winnowing processes and afterwards, usable grains are loaded into the grain tank. The wheat is then put into a grain cart for transport for storage in a grain elevator. Proper storage before transport for sale is essential to avoid both disease infection and pest infestation.
Transgenic Wheat and Genetic Engineering
 Transgenic wheat is wheat that has been genetically engineered by the direct manipulation of its genome using biotechnology. Like other genetically engineered foods, transgenic wheat is a source of controversy and debate and resistance to the use of genetically modified wheat has been particularly strong. No genetically modified wheat is grown commercially anywhere in the world although field trials have taken place. Modifications to wheat that have been tested in transgenic field trials include resistance to herbicides, insects, and fungal pathogens, drought and heat tolerance, both increased and decreased content of gliadin and glutenin, improved nutrition content, increased water-soluble dietary fiber, increased plant yield, and improved qualities for use as a biofuel. The use of transgenic wheat to create low-gliadin strains is of particular interest as wheat and flour consumed by people with celiac disease and non-celiac gluten sensitivity (NCGS) must have a minimal amount of gluten in their diets. It is estimated that 1% of the world’s population suffers from celiac disease and up to 6% of the population in the United States suffers from NCGS. One genetically modified wheat, Bioceres HB4, has been approved for commercial use in Argentina. The variety is named for its expression of a transcription factor from sunflowers, known as HaHB4. It is said to be able to withstand drought as well as provide high yield. Commercial introduction is pending approval of the crop by Brazil, Argentina’s major wheat export partner.
One cause of major controversy and debate in transgenic wheat has been the discovery of genetically modified wheats in shipments even though genetically modified wheat is not approved for human consumption anywhere in the world with the exception of Bioceres HB4 in Argentina. In 1999, scientists in Thailand claimed to have found herbicide-resistant wheat in a shipment from the United States. The source of the claimed contamination was never found. In 2013, a similar strain which was tested extensively by Monsanto and approved by the FDA for use as food was found on a farm in Oregon. MON 71800 is the transgenic wheat strain that went the furthest in the approval process for commercial use in the United States, but the EPA application was withdrawn after market analysis in Europe and Asia showed that public resistance to the product was strong enough to have a large potential loss of these markets. After the discovery, Japan suspended soft white wheat imports from the United States and Monsanto was sued by a Kansas farmer who claimed the controversy caused a price drop in wheat in the market. Ultimately, the cause was never determined although Monsanto suggested that it was likely an act of sabotage and framed the incident as an isolated one. No evidence was ever found that the wheat had entered commercial supply. Imports returned to normal and market disruption was minimal. Other similar incidents have occurred with less press and fanfare and despite the fact that there have been few real consequences thus far from cross-contamination from unapproved transgenic wheat products, the fear for consumer safety and market disruption does remain a hindrance to commercialization of transgenic wheat.
Wheat and NIR Spectroscopy
 NIR spectroscopy has emerged as a tool for rapid, non-invasive, and cost-effective analysis of parameters of interest in wheat that could potentially replace traditional reference methods. There are a number of quality parameters in both whole wheat kernels and wheat flour that have been studied and predicted with NIR spectroscopy with results suitable for process control purposes, such as moisture and protein. Other parameters have shown results good enough for screening purposes and more study and calibration work could improve the prediction results. These include total gluten content, glutenin and gliadin content, particle size, and baking water absorption. Particle size is directly correlated to hardness and determining hardness in wheat using NIR spectroscopy is an AACC certified method. Wheat straw residue decomposition potential is important for managing straw residue depending on rainfall levels in the region of planning. NIR spectroscopy has been examined for determining the fiber and chemical constituents in wheat straw that determine decomposition potential, such as neutral detergent fiber (NDF), acid detergent fiber (ADF), acid detergent lignin (ADL), cellulose, hemicellulose, carbon, and nitrogen. Both wheat and oat straw are strong sources of carbohydrates which can be hydrolyzed to fermentable sugars that are precursor substances for biofuels or building blocks for chemical syntheses. However, chemical pre-treatment is necessary to open up the lignocellulose structure and to increase the accessibility to microbial enzymes. NIR spectroscopy has been examined for determining key parameters of precursors of biofuel production, such as weight loss, residual lignin content, and hydrolysable sugars. Geographical origin of wheat is an important factor in determining quality, cost, and particular suitability for the products that will be manufactured from it. One study determined the feasibility of discriminating Durum Wheat samples from different regions of Italy from each other as well as from samples from other parts of the world. While not approved for commercial use, research is being conducted on transgenic wheat and developing wheat lines with low gliadin content is of particular interest because of the large number of people with celiac and related diseases. NIR spectroscopy has been studied for discriminating between wild wheat and transgenic wheat lines with low gliadin content using both whole grain and flour. All of these parameters and measurements have been studied using NIR spectroscopy with results showing the potential to replace traditional reference methods.
References
Wheat
https://plantvillage.psu.edu/topics/wheat/infos/diseases_and_pests_description_uses_propagation
The Contribution of Wheat to Human Diet and Health
https://www.ncbi.nlm.nih.gov/pmc/articles/PMC4998136/
How To Grow Wheat?
https://krishijagran.com/agripedia/how-to-grow-wheat/
Farming 101: Planting Wheat
https://www.agriculture.com/crops/wheat/farming-101-planting-wheat
How Long Do Wheat Plants Take Before the Harvest?
https://homeguides.sfgate.com/long-wheat-plants-before-harvest-69823.html
The Combine: King of the Harvest
Transgenic Solutions to Increase Yield and Stability in Wheat: Shining Hope or Flash In the Pan?
https://academic.oup.com/jxb/article/70/5/1419/5374683
Monsanto Wheat Scandal: What The Discovery of Unapproved Genetically Engineered Wheat Means For Our Food
https://foe.org/blog/2013-05-monsanto-wheat-scandal-what-the-discovery-of-unappro/
The post Wheat Overview appeared first on NIR-For-Food.
]]>The post Rice Overview appeared first on NIR-For-Food.
]]>Introduction
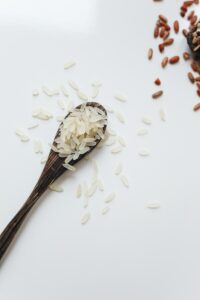
Rice is an edible starchy grain and the grass plant from which is it produced. Approximately one-half of the world population is wholly dependent on rice as a staple food, including all of East and Southeast Asia. It is the third highest produced agricultural commodity in the world at 741.5 million metric tons in 2014 after sugarcane (1.9 billion metric tons) and maize (1.0 billion metric tons). 95% of the world’s rice crop is consumed by humans, making it by far the most widely consumed food in the world by people as sugarcane, maize, and other grains have sizable portions used for purposes other than human consumption. It is estimated that more than one-fifth of calories consumed by humans worldwide come from rice. More than 90% of rice is grown in Asia, principally in China, India, Indonesia, and Bangladesh. Many cultures have evidence of rice cultivation with the earliest archaeological evidence coming from central and eastern China dating back to 7000 BC to 5000 BC. Rice is cooked by either boiling or steaming. It can also be ground into flour. It can be eaten alone and is often used in a great variety of soups, side dishes, and main dishes in numerous types of cuisines, especially Asian and Middle Eastern. Rice varieties are classified as long, medium, and short grained. Long-grain rice grains tend to remain intact after cooking while medium-grain rice becomes sticky. Medium-grain rice is often used in sweet dishes while short-grain rice is used extensively in Japan, especially for sushi and to accompany savory dishes. Because rice is such a widely consumed food, nutrition content is analyzed extensively to find ways to fortify it to reduce malnutrition. A 2018 World Health Organization guideline based on clinical research showed that different micronutrient strategies to fortify the nutritional content of rice such as iron only, iron with zinc, Vitamin A, and folic acid, or iron with other B-complex vitamins can reduce the risk of iron deficiency by 35% and increase levels of hemoglobin.
Rice Growing, Harvesting, Processing
 The cultivated rice plant is normally an annual grass that grows to about four feet in height. It is typically grown on submerged land in the coastal plains, tidal deltas, and river basins of tropical, semi-tropical, and temperate regions. In some tropical areas, it can survive as a perennial and produce a ratoon crop for up to thirty years. Rice seeds are sown in prepared beds and transplanted to a paddy (field enclosed by levees and submerged by two to four inches of water). Adequate irrigation, good soil quality, and long periods of sunshine are essential for good rice growth. Yield from rice paddies can vary considerably, ranging from 700 kilograms to 4000 kilograms per acre. The average time for plant maturation is around one hundred twenty days. The grain appears in long panicles on top of the plant. Harvesting typically occurs when the moisture content is around 25% and can be done manually or mechanically. Mechanical harvesting involving cutting the crop with hand tools and while effective, it is very labor intensive. This method is common in Asia. Mechanical harvesting is more predominant when machinery is available and requires threshing to separate the grain from the stalk and cleaning.
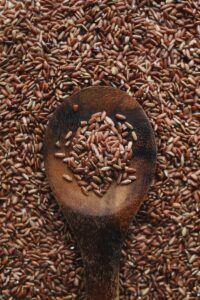
After harvesting, the rice plants are transported to a mill for processing. The first step in processing rice is pre-cleaning which consists of two procedures, cleaning and de-stoning. A paddy cleaner is used to separate impurities like dust, straw, sand, clay, and heavy particles from paddy. After impurities are removed, the dehusking process begins. Rice dehusking is the process of removing the husk and bran from paddy rice and producing head white rice grains that are free from impurities and contain a minimum number of broken grains. The husk is the enclosure of the harvested rice kernel. The bran is the hard outer layer of rice and other cereal grains. The husk is removed first by a rice separator. Rice that is processed to only remove the husks is known as brown rice and has a much higher nutritional value than white rice. It is known as a source of thiamine, niacin, riboflavin, iron, and calcium. Further milling by rubbing the grains together under pressure to remove the bran makes white rice. The process is still done by hand in many parts of Asia but large mills operate in Japan and other areas. Traditional methods done by manual labor use pestle and mortar worked by hand, foot, or water power. This process is also known as polishing and can include polishing kernels of rice to change their appearance, taste, and texture. White rice is typically enriched with vitamins to replace some of the nutrients lost during dehusking. Proper packaging and shipping of finished rice is essential because of the worldwide distribution of the product.
Trangenic Rice and Genetic Engineering
 Trangenic rice are rice strains that have been genetically modified and they have become a very important segment of the rice market. Rice plants have been modified to increase micronutrients, accelerate photosynthesis, tolerate herbicides, resist pests, increase grain size, generate nutrients and flavors, and produce human proteins. While the benefits are pronounced, transgenic rice has also created legal issues and regulatory concerns. The cultivation and use of genetically modified rice varieties is controversial and not approved for commercial use in some countries. Concerns include ethics, environmental impact, food safety, product labeling, international food requirements, intellectual property, and role in industrial agriculture. In 1988, the first transgenic rice plants were developed by electroporation-mediated or polyethylene glycol-mediated protoplast transformation methods. The fertility recovery of transgenic rice was reported over the next few years. In 1991, the direct DNA delivery system known as biolistic transformation method was successfully used to generate transgenic rice plants. While successful, this method does present the risk of an unstable and aberrant expression of the gene because of its likely fragmentation from this technology. The Agrobacterium strategy was developed and generates transgenic plants with a more predictable pattern of integration and a non-rearranged segment of DNA being inserted into the genome.
 In 2000, the first two transgenic rice varieties (LLRice60 and LLRice62) were approved for research in the United States. Both show herbicide resistance. Subsequent approval of these and similar strains occurred in Canada, Australia, Mexico, and Colombia but none of these approvals triggered commercialization. Over time, individual countries have developed their own regulatory systems regarding transgenic plants, with marked differences between the United States and Europe. There have been incidents of import suspension to certain countries from genetically modified product contamination, often having a detrimental effect on growers and the market. Research to develop Golden Rice began in the late 1990s. Golden Rice is a transgenic variety of rice produced to biosynthesize beta-carotene, a precursor of Vitamin A. The intention was to produce a fortified food for production and consumption in parts of the world with a dietary shortage of Vitamin A. The first research results were published in 2000 and golden rice was considered a breakthrough in biotechnology as the researchers had engineered an entire biosynthetic pathway. The first field trials of golden rice cultivars were conducted by Louisiana State University in 2004. Field test results have indicated that field-grown Golden Rice produces four to five times more beta-carotene than that grown in greenhouses. In 2018, the health organizations in multiple countries including the United States, Australia, Canada, and New Zealand approved the use of Golden Rice for human consumption. Research continues on different properties of transgenic rice, such as herbicide tolerance, insect, bacteria, fungus, and virus resistance, grain yield, and nutritional quality. New advances and breakthroughs will bring on new challenges as well as controversies and it will become ever more important to develop new methods of testing and analysis to help future breakthroughs in genetic engineering.
NIR Spectroscopy and Rice Analysis
 NIR spectroscopy has emerged as a tool for rapid, non-invasive, and cost-effective analysis of parameters of interest in rice that could potentially replace traditional reference methods. Starch is an essential component in rice and consists of two types of molecules: the linear and helical amylose and the branched amylopectin. Typically, starch contains between 20% to 25% amylose and 75% to 80% amylopectin by weight depending on the plant. Studies have been conducted using NIR spectroscopy to measure amylose concentration in both rice and its flour product. Protein is another important component in rice and has been successfully measured as well. Proper moisture level in rice is very important during harvesting, storage, and transport. NIR spectroscopy is well-suited for moisture analysis because NIR light is strongly absorbed by water. Other chemical and physical parameters of interest in rice that have been measured using NIR spectroscopy include breakdown and setback viscosity, antioxidant activity as total phenol content (TPC) and radical activity [both expressed gallic acid equivalent (GAE)], and gamma oryzanol, a compound with noted health benefits that is rich in brown rice. Adulteration is a big problem in the food market and the amount of rice produced in the world and localized nature of growing in Asia compound the problem for rice. Rice can vary greatly in nutritional content and market cost. NIR spectroscopy has been used as a tool for authenticating higher quality and more expensive brands of rice. Species classification is important, especially when discriminating between both hybrid rice and transgenic rice from normal varieties. NIR spectroscopy has been studied for this purpose as well. One in-depth study for transgenic rice showed the ability to quantify wall polymer features that affect biomass saccharification. Weevil infestation must be prevented in rice and millers often use more pesticide than is necessary to ensure the elimination of all weevils, but this wastes product and creates potential health issues for the consumer. NIR spectroscopy has shown the potential to quantify weevil infestation in rice. Such analysis would enable millers to use the minimum amount of pesticide necessary to eliminate pests. All of these parameters and measurements have been studied using NIR spectroscopy with results showing the potential to replace traditional reference methods.
References
Encyclopedia Britannica: Rice Description, History, Cultivation, and Uses
https://www.britannica.com/plant/rice
How Rice Grows
Rice Processing Steps: From Pre-Planting To Post-Production
Rice Knowledge Bank: Milling
Biotech Rice: Current Developments and Future Detection Challenges in Food and Feed Chain – Fraiture, Roosens, Taverniers, De Loose, Deforce, Herman, Trends in Food Science & Technology, Volume 52, June 2016, Pages 66-79
https://www.sciencedirect.com/science/article/pii/S0924224415302028
Plants as Bioreactors: Recent Developments and Emerging Opportunities
Plants as bioreactors: Recent developments and emerging opportunities – ScienceDirect
From Disagreements To Dialogue: Unpacking The Golden Rice Debate
From disagreements to dialogue: unpacking the Golden Rice debate (nih.gov)
The post Rice Overview appeared first on NIR-For-Food.
]]>The post Oilseeds Overview appeared first on NIR-For-Food.
]]>Introduction
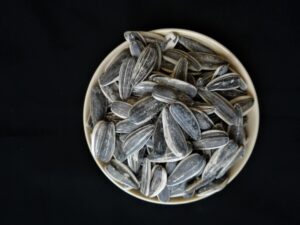
Oilseeds are defined as the seed (endosperm) of any of several plants that are used commercially as a source of vegetable oil and can also refer to the plant that yields any such seed. Examples include but are not limited to groundnuts/peanuts, sunflower, sesame, safflower, linseed, soybean, rapeseed/canola, and palm kernel oil (not to be confused with palm oil which is produced from the pulp of the same oil palm fruit). While palm oil is the vegetable oil consumed the most globally, it is not derived from oilseeds and palm kernel oil has a much smaller market segment. The history of oilseeds is closely tied to that of human civilization. Rapeseed and sesame are mentioned in Indian Sanskrit writings from around 2000 BC and sunflower was reported to be present in Arizona and New Mexico around 3000 BC. Whole oilseeds contain high concentrations of energy and moderate amounts of protein and fiber. They are not only an essential source of edible oils but also as a source of meals that are included in diets fed to livestock. Total global oilseed production reached approximately six hundred million tons in 2020/21 and is forecast to grow five percent in 2021/22 to reach six hundred thirty-two million tons from record plantings. Soybeans account for over half of all oilseeds produced worldwide and are forecast to increase in production by twenty-three million tons to three hundred eighty-six million tons, an increase of six percent fueled primarily by output growth in the United States and South America. Production of all oilseeds is forecast to increase, with many types reaching at least ten year records. Global production of oilseeds is forecast to rise by three percent in 2021/22, led by a higher demand for soybeans in China, a direct reflection of the rebuilding of feed demand following African swine fever. Trade is projected to increase as well, mostly because of the greater soybean demand from China, which accounts for around sixty percent of global soybean imports. The production gains and increased demand are also expected to create a modest increase in stock prices as the market rebounds from currently tight stocks that have driven soybean prices to the highest levels in eight years. Soybean oil manufacturing has become so prevalent in the United States that the term “vegetable oil” is synonymous with soybean oil. Another factor in the global expansion and increased demand for oilseeds is the growing need for vegetable oils and biofuels as well as increasing awareness of environmental and sustainable alternative energies.
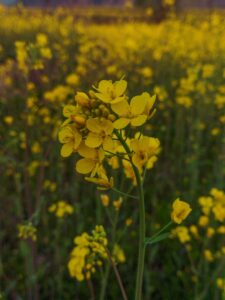
 Oilseeds are crushed to obtain oil for human consumption and biodiesel production and the remainder is processed into meal which is used for high protein livestock and poultry feed. Due to high availability in the United States, soybeans are the dominant biodiesel feedstock while rapeseed oil is the major biodiesel feedstock in Europe. Different oilseeds differ in oil yield and production per crop acre. Soybeans produce approximately 1.5 gallons of oil per bushel of crop and in 2009, U.S. farmers produced a record yield of forty-four bushels per acre, which roughly translates to an oil yield of sixty-six gallons per acre. Although soybeans do not produce as much oil per acre as some other crops, it is the most popular oil in the United States and is commonly grown as a rotation crop with corn. There is an established infrastructure to process soybeans into oil and meal. One regulation is classifying meal into two separate specifications based on the inclusion of hulls during crushing. If soybean hulls are not included in the meal, it is called dehulled soybean meal while inclusion of hulls classifies the meal as non-dehulled soybean meal. This specification is widely used during trading and penalties exist when product deviates from the contract specification. There are also recommendations for certain nutritional parameters within these two classifications. These include protein (47.5-49.0% for dehulled and 44% for non-dehulled), crude fiber (7.0% for dehulled and 3.5% for non-dehulled), moisture (12% for both groups), and fat (0.5% for both groups). Rapeseed and canola produce about seventy-five to two hundred forty gallons of oil per acre. They are excellent rotation crops because of deep root systems that are good at absorbing water and nutrients. Both types use planting and harvesting equipment similar to that used for small grains and they command a high price in the feed market. Mustard is a close relative of canola and rapeseed and produces less oil than canola but is drought tolerant, grows well on marginal soil, and contains compounds that are resistant to soil pathogens. However, mustard oil is not permitted to be imported or sold in the United States and many other countries for cooking use with a few exceptions. This is because of the high level of erucic acid, a monounsaturated omega-9 fatty acid that is about 42% prevalent in mustard oil. Studies on rats in the 1970s showed that erucic acid appears to have toxic effects on the heart at high doses, but more recent research has cast doubt on these results as rats are unusual in their inability to process erucic acid. Studies on other animals have not shown similar results and no definitive link between human heart disease and the consumption of mustard and similar oils has been determined. Despite this, the regulations remain and food-grade rapeseed oil is regulated to a maximum of 2% erucic acid by weight in the United States and 5% in EU, with stricter regulations for infant food. Canola is specifically derived from a variety of rapeseed that is low in erudic acid. Both safflower and sunflower can produce biodiesel oil as well, although these oils are considered more valuable for cooking purposes. As shown in the market analysis here, global demand for oilseeds and its products is increasing at a high rate, creating new challenges in productivity, testing, regulations, and research.
Oilseeds Growing, Harvesting, Processing
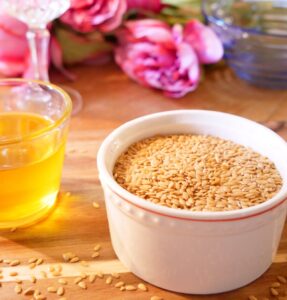
 Oilseed crops are generally grown for the oil in their seeds and can vary considerably in oil content, quality, and composition. These factors are dependent on the crop species and the environmental conditions in which the crop is grown. Soybeans are typically planted in the late spring in rows between thirty-six and forty-two inches apart at a rate of about one viable seed per inch of row. They can be planted in any average, well-drained soil and sprout best when positioned for full sun. Soybeans are known as a good cover crop to add nitrogen to poor soil and mixing a balanced organic fertilizer into soil before planting will improve this process. Harvesting is best done when the plants begin to flower and nitrogen modules left behind in the soil will add fertility. Rapeseeds are members of the brassica family which are cool weather crops and grow best in the spring or autumn. Rapeseed plants are very forgiving and can grow in acidic, neutral, and alkaline soil as long as the soil drains well. Peanuts grow their seeds underground and light-textured soils that do not bake work best. They grow best on soils with a pH between 6.0 and 6.5 if enough lime is available for normal development. Sesame seeds grow best on fertile, well-drained soils of medium texture with a neutral reaction. The seedbed should be mellow, warm, and moist and warm weather is required for growth. Sesame seeds are small and one pound contains about one hundred and fifty thousand seeds. Seedlings emerge quickly under good conditions, but the small plants can grow slowly at first. They are sensitive to cooling during the beginning stages of growth and a heavy rain early after planting may compact the soil, which can require replanting. Regardless of the type of seed, it is important for growers to be aware of environmental factors including weather, pests, and weeds and be sure to take steps to avoid problems with the seeds as they grow and germinate.
 The preparation of seeds for oil extraction can vary based on the physical properties and oil content. In general, most oilseeds go through the process of cleaning, drying, dehulling, size reduction, flaking, cooking, and tempering. Oilseeds need to be cleaned to remove plant stems, sticks, leaves, and foreign material before storage. Many foreign materials are separated by a combination of rotating or vibrating screens. Sand and dirt can be removed by fine screening. Magnets can remove ferrous metal contaminants. Some larger oilseeds (such as peanuts) may have stones that are similar in size to the seeds and these stones need to be removed by gravity. Moisture often needs to be reduced before storage to minimize degradation and improve the effectiveness of downstream processing. Soybeans typically have around 13% moisture after harvesting and need to be dried to 10% before dehulling for efficient hull removal. Large, open-flame dryers with multiple columns are used for this purpose and the seeds are dried in the upper section and cooled in the lower section of the columns. The amount of hull on oilseeds varies significantly. Cotton seeds have a hull percentage around 45%, sunflower seeds around 25%, and soybeans around 7%. If hulls are not removed, the total oil yield is reduced by absorbing oil in the pressed cake. Hulls also contain undesirable wax and color compounds that wind up in the extracted oil. There are many types of dehullers that are used depending on the kind of seed. Three common ones are knife, disk, and impact dehullers. If size reduction is required, a cracking mill consisting of two sets of cylindrical corrugated rolls in series is used, although many oilseeds are small enough to not require this. There are three processes that can be used to separate the oil from the protein meal: solvent extraction, continuous pressing, or hydraulic pressing. Solvent extraction is the most common and uses hexane to extract oil from the flaked meal. Before extraction, the flaking process ruptures seed cellular structure and reduces the distance that the solvent has to travel to reach the oil in the cells. A flaking mill has two large diameter rolls that turn in opposite directions and stretch and flatten the seeds. This process also increases the surface area for increased contact between the solvent and seed. Some seeds can be cold-pressed using a screw press at low temperatures and this process uses crushing the seeds to extract the oil instead of hexane extraction. Continuous pressing uses an oil extraction screw pressed to extract the oil from ground and properly conditioned seeds at elevated temperatures. Hydraulic pressing is the oldest method and is an intermittent pressing operation carried out at elevated temperatures in a mechanical press after the seeds have been rolled into flakes and conditioned by heat treatment. Proper storage and transport of the extracted oil is essential to avoid oxidation, hydrolysis, and contamination.
Oilseeds and NIR Spectroscopy
NIR spectroscopy has emerged as a tool for rapid, non-invasive, and cost-effective analysis of parameters of interest in oilseeds that could potentially replace traditional reference methods. There are a number of quality parameters in oilseeds that have been studied and predicted with NIR spectroscopy with results suitable for process control purposes. Other parameters have shown results good enough for screening purposes and more study and calibration work could improve the prediction results. A recent comprehensive review discussed in detail the various oilseed quality parameters that have been studied using NIR spectroscopy. These include oil content, protein, moisture, fatty acids, lipids, ash, and lineolic, oleic, erudic, and amino acids. The review also examined specific nutritional components, geographical origin, and adulteration detection. NIR spectroscopy can be used in conjunction with more comprehensive detection methods to create profiles that can predict flavor of peanuts from simple tests. One study determined protein, oil, oleic acid, and linoleic acid using NIR and then identified flavor compounds in the same peanuts using GC-MS. Correlation was determined that allows for the prediction of roasted peanut flavor from the NIR spectra. Moisture and oil content are very important parameters in Chi seeds and these have been correlated with NIR spectra in another study. Similarly, fat, protein, and moisture can be determined in soybeans by using a handheld MEMS FT-NIR spectrometer and calibration models. These parameters are important in sesame seeds as well and one study examined fat, protein, and moisture in sesame seeds of different coat colors, with the results showing that these three quality parameters can be correlated to NIR spectra regardless of coat color. Another study using sesame seeds predicted oil yield in the seeds which is produced by an aqueous extraction process, a known method for producing sesame oil with a pleasant flavor and high nutritional value. Results were good and could provide a method for sorting sesame seeds with a higher oil yield to be used for aqueous extraction. Fatty acid content is an essential parameter in producing high quality rapeseed oil and NIR spectroscopy was shown as a proven method for determining fatty acid composition in rapeseed seeds used in breeding programs. Seed characterization is important as well and NIR spectroscopy has multiple applications for this purpose, including geographical origins, age, seed viability, and seed oil content. One study used NIR spectroscopy to investigate the differences in oil, oleic acid, linoleic acid, and protein in sesame seeds obtained in different countries in Africa and Asia. The results showed high variation in these components, both within these two continents and especially between the two of them. Knowing this variation provides excellent background information for breeding high-nutrition varieties of sesame seeds and to help meet market demand. All these parameters and measurements have been studied using NIR spectroscopy with results showing the potential to replace traditional reference methods.
References
Oilseeds: World Markets and Trade
https://apps.fas.usda.gov/psdonline/circulars/oilseeds.pdf
Oilseeds: An Overview
https://www.sciencedirect.com/topics/agricultural-and-biological-sciences/oilseeds
Oilseed Crops for Biodiesel Production
https://farm-energy.extension.org/oilseed-crops-for-biodiesel-production/
Soybeans: A Grow Guide
The University of Vermont Extension: On-Farm Oil Seed Production and Processing
https://www.uvm.edu/vtvegandberry/Pubs/Final%20Report%205-15-2007.pdf
Oil and Oilseed Processing I
https://extension.okstate.edu/fact-sheets/oil-and-oilseed-processing-i.html
Oilseed Processing, Conditioning, and Drying
https://www.solexthermal.com/resources/articles/oilseed-processing-conditioning-and-drying/
Common Oilseed Extraction Processes and Equipment
https://farm-energy.extension.org/oilseed-crops-for-biodiesel-production/
The post Oilseeds Overview appeared first on NIR-For-Food.
]]>The post Flour Overview appeared first on NIR-For-Food.
]]>Introduction

Flour is a powder that is made by grinding grain and is used to make an assortment of foods. It can also be made from roots, beans, nuts, or seeds. Flour milling is grinding grains between stones or steel wheels. The earliest evidence of flour milling dates back to 6000 BC. The Romans were the first to grind seeds on cone mills and the first steam mill was built in London in 1779. The industry was revolutionized in Hungary in the mid-nineteenth century with the advent of cylinder machines. Modern advances in flour manufacturing includes improvements in milling and the addition of nutrients to flour, such as iron, niacin, thiamine, and riboflacin. Wheat is the most common grain used to make flour. Other grains that can be used for flour production are rice, rye, barley, corn, millet, quinoa, buckwheat, and oats. However, wheat flour is so prevalent that it is usually understood that “flour” alone refers to wheat flour, unless the flour in that region of the world is another type that is more common. For example, rye flour is popular in northern and eastern European countries where wheat does not grow well and rice flour is very popular in Asia. Cereal flour and particularly wheat flour is the main ingredient in bread. By definition, cereal flour consists of the endosperm, germ, and bran together (known as whole grain flour) or of the endosperm alone (refined flour). The two main components of flour are starches and proteins. Starches typically make up about 70% of flour composition. When flour is mixed with liquid, gluten protein is formed. As a rule, the higher the protein content, the harder and stronger the flour is and such flours are used to make crusty or chewy breads. Likewise, lower protein flours are softer and better for baked goods. The “crumb” in flour-based foods refers to a network of starch and protein interspersed with millions of tiny air bubbles. The higher the protein, the stronger the binding of the crumbs. There are different types of flour used in cooking, such as all-purpose flour, bread flour, and cake flour. These are classified based on protein content and binding strength. Cake flour is the lowest in gluten protein content at 6% to 7%, followed by pastry flour, all-purpose flour, bread flour, and hard flour at around 14% to 15% gluten protein content. Refined flours are often bleached with a chemical whitening agent and such flours are referred to as white flour. The practice of bleaching flour is illegal in the United Kingdom and European Union but occurs in many other parts of the world. These flours can also be treated with a maturing agent which can either strengthen or weaken gluten development. Some substances can act as both a bleaching agent and maturing agent, such as chlorine gas. Chlorine gas weakens gluten development and oxidizes starches, making it easier for the flour to absorb water and swell. Batters are thicker and result in a more desirable and softer formation for cakes, cookies, and biscuits. Bleaching flour significantly reduces the nutrient content and nutrient fortification usually occurs in white flour. Ash is defined as the mass that remains after a sample is incinerated in an oven according to different standards and in some parts of the world, this value is used as a labelling standard. Ash is an easily verified indicator for the fraction of whole grain remains in flour because the mineral content of the starchy endosperm is lower than the outer parts of the grain. All-grain flour is considered to have a milling yield of close to 100% while plain white flour typically has a milling yield in between 50% and 70%. In the United States and the United Kingdom, the ash mass is rarely used as a standard, but protein content is required labelling and protein can also be used for comparing milling yield of different flours. The development of gluten-free flour has become very important as a sizeable portion of the world’s population suffers from celiac disease, wheat allergies, and related ailments. There are alternative flours such as corn, rice, buckwheat, and pea flours. It is important to avoid cross-contamination with gluten products during milling, storing, transport, and cooking. Another potential alternative for gluten-free flour is flour milled from transgenic wheat that has been genetically modified to eliminate gluten. While such strains of wheat have been the subject of research, the practice remains controversial and no such strains have been approved for commercial use. As flour continues to advance as a crucial part of the world’s food supply, it is important to develop new and sound testing methods to improve product quality and consumer safety.
Flour Preparation, Milling, and Processing
 The flour milling process begins with the arrival of the wheat at the mill, where it must be properly stored in silos and protected from weather, humidity, rodents, and insects. Before storage, it is tested to ensure proper specification for things like variety, moisture content, specific weight, impurities, enzyme activity associated with sprouting, and protein content. Wheat is thoroughly cleaned when it is taken out of silos. Magnets are used to remove any metal objects, machines are used to remove barley, oats, and small seeds, and gravity separation is used to remove stones. Throughout this process, air currents are used to remove dust and chaff. After cleaning, the wheat is conditioned to a desirable moisture content by tempering it with water and storing it in bins. This process softens the bran and enhances the release of the inner white endosperm during milling. Many flour products are made from different blends of wheat and different wheat varieties can be blended in a process known as gristing. The finished flour can also be blended after milling. The whole preparation process requires skilled millers who understand how to properly blend based on test data and the proper tempering time. Inadequate tempering results in an increase in ash content due to poor separation of the bran from the kernel while too much tempering can result in clogging of equipment during milling and processing.
Milling is a succession of reductions in grain size which is achieved by passing the grain between cylinders and sieving to sort the particles. The first part of the process is separating or breaking where the grist is passed through a series of break rolls rotating at different speeds. The purpose is to separate the bran from the endosperm as efficiently as possible to produce clean intermediate products. In the reduction stage, particles go through a series of fine rollers and sieves through a machine called a plansifter. They contain vertically stacked sieves with meshes of various sizes, typically five or six. Air separators help remove the bran particles that are similarly sized to the endosperm and from endosperm with small pieces of bran still attached. After reduction, each stream passes through cleaning machines known as purifiers. Purifiers also contain a series of sieves that contain an upward current of air and further sift the product. This process is repeated multiple times and is typically performed four to five times depending on the desired extraction rate. In larger mills, the last two passages can split the grist into coarse and fine groups for better separation. Final crushing is made by perfectly smooth rollers that reduce the final processed middlings (the coarse fragments of endosperm) into flour. Leftover grain material can be used in cereals or as animal feed. If white flour is desired, bleaching occurs after the final crushing. Because bleaching significantly reduces the nutrient content of white flour, thiamine, niacin, riboflavin, and iron are added after bleaching. Finished flour is then either bagged for home and local market use or stored in preparation for bulk delivery.
Flour and NIR Spectroscopy
 NIR spectroscopy has emerged as a tool for rapid, non-invasive, and cost-effective analysis of parameters of interest in flour that could potentially replace traditional reference methods. There are a number of quality parameters in flour that have been studied and predicted with NIR spectroscopy. Moisture, fat, protein, and physiological activity are all important parameters that have been studied. Moisture, fat, and protein are essential quality parameters that are measured in most foods while physiological activity can be used for breeding selection. Ash is an important indicator of the whole grain remains in endosperm and one study examined determining ash content in various wheat flours using NIR spectroscopy. Results were good enough for sample screening purposes. Another study examined using both NIR and MIR spectroscopy for determining protein and ash in wheat flour. Better results and correlation were shown using the NIR spectrometer and were good enough for use as a quality control tool. Starch is an essential quality parameter in flour and four separate starch parameters have been examined and proven to be able to be measured using NIR spectroscopy – amylose, resistant starch, digestible starch, and total starch. Flours are often blended for flavoring, nutritional specifications, and optimization for the type of food product that will be made from them. The blending of potato flour and wheat flour has become prominent in China and NIR spectroscopy was studied as a method for determining the potato flour content in potato and wheat flour blends, with results proving that the potato flour content in blends could be determined accurately and quickly. Tubers are cultivated and consumed as an alternative food to rice and are usually processed into flour to prolong shelf-life. Most are white in color but can vary greatly in nutritional value, making them subject to adulteration. Excellent discrimination was obtained for three separate species of tuber flours with varying nutritional content. Taro flour and oat flour are two types of flour considered to have higher market value due to flavor specificity, high nutritional content, and lower availability. Both types have been studied using NIR spectroscopy to determine adulteration with other types of flour, with good results being shown for both discrimination from other types and in mixtures to determine a percentage of adulteration level. All of these parameters and measurements have been studied using NIR spectroscopy with results showing the potential to replace traditional reference methods.
References
Flour
https://www.recipetips.com/glossary-term/t–33312/flour.asp
How Flour Is Made
https://fabflour.co.uk/fab-flour/how-flour-is-milled/
Wheat Milling
https://www.cerealsdb.uk.net/cerealgenomics/WheatBP/Documents/DOC_Milling.php
Flour Milling
https://chopin.fr/en/blog-article/flour-milling.html
Modern Wheat Flour Manufacturing Plant
Gristing, Grinding, Blending, and Packing in Wheat Flour Milling
https://www.flourpedia.com/2017/11/wheat-milling-part-4-gristing-and.html
Commercial Reference
The post Flour Overview appeared first on NIR-For-Food.
]]>The post Corn Overview appeared first on NIR-For-Food.
]]>Introduction
Corn is a domesticated grass that originated approximately seven thousand years ago in what is now Mexico when humans first learned to cross-pollinate plants and slowly turned a nondescript grass called teosinte into plump and productive modern corn. It is also referred to as maize and in general, the two terms are synonymous. It first spread across the world after the European discovery of the Americas and has proven to be one of the most adaptable crops in the world. The evolution of different corn biotypes has created species that can grow from the tropics to the northern temperate zone, from sea level to twelve thousand feet altitude, and with growing periods that can range from six weeks to thirteen months. More corn is produced than any other cereal worldwide and it is used for human consumption, livestock feed, corn starch which has both food and non-food uses, and fuel. While it is the highest produced grain, it is the third most consumed as a staple food after wheat and rice. Yield per acre has been steadily increasing for decades, showing an estimated increase in the United States to 172.0 bushels per acre in 2020 from 167.5 bushels per acre in 2019. It is estimated that 60% to 70% of corn produced worldwide is used for livestock feed while the remaining 30% to 40% is used for producing human food and processed corn products. The volume of the global corn market was approximately 1.118 billion metric tons in 2020 and is expected to grow at a CAGR of 5.3% from 2021 to 2026, reaching a volume of 1.524 million metric tons by 2026. The United States, China, Brazil, and Argentina account for over two-thirds of worldwide maize production. Ukraine is the fifth highest producing country and the only European country in the top ten for corn production. Strong demand for exports is expected to raise prices in 2021/22. There is tough competition for export crops as Argentina, Brazil, and Ukraine are expected to reach a combined increase in corn exports of 19.5 million tons but the United States is still the dominant producer and exporter of corn, accounting for over 36% of global exports. In 2018/19, more than three hundred sixty-six million metric tons of corn were grown in the United States and about 14.3 percent of this was exported to over seventy-three different countries. The increased demand for corn is driven by the growing animal feed and corn starch processing sectors, especially in China which is the worldwide leader in corn starch production and also accounts for a significant market share in other sectors like high fructose corn syrup and polyols. The use of corn as a biofuel is increasing as well but there are also a number of concerns, such as a rise in market price in corn produced for consumption and the need to produce more cultivable areas to meet increased demand that could cause ecological damage. Some models project that large-scale corn ethanol production may lead to decreases in food exports, higher prices, and greater global deforestation.
Corn Composition, Harvesting, Processing, and Refining
 There are four parts to a kernel of corn: endosperm, germ, pericarp, and tip cap. The endosperm is about 83% of the dry weight and is the source of starch energy for the germinating seed. A hard endosperm kernel has the starch tightly packed together while a soft endosperm has loose starch. When corn dries in the field before harvest, moisture loss causes soft endosperm to collapse and form a dent in the top of the kernel, thus the term “dent” corn. The germ is about 11% of the dry weight and is the only living part of the kernel. It contains the essential genetic information, enzymes, vitamins, and minerals for a kernel to grow into a corn plant. About 25% of the germ is corn oil which is the most valuable part of the kernel. Corn oil is high in linoleic fatty acid and has a bland taste. The pericarp is about 5% of dry weight and is the outer covering of the kernel that protects it from deterioration and damage by water, water vapor, insects, and microorganisms. The tip cap is about 1% of dry weight and is the only area of the kernel not covered by the pericarp. It is the attachment point of the kernel to the cob. Components consist of approximately 61% starch, 19.2% feed, 3.8% oil, and 16% water.
The process of planting and harvesting corn can vary greatly depending on the climate and part of the world it is grown in, but in places with moderate and seasonal temperatures, it is a warm season annual that is best planted after the soil reaches 60°F. This generally happens around two to three weeks after the last spring frost. Fresh seeds are sowed about two inches deep in soil and four to six inches apart. Rows should be spaced thirty to thirty-six inches apart. Soil pH should be between 5.8 and 6.8. Plants should be watered well after planting. It is important to aerate the soil and remove weeds as corn is a heavy feeding plant and cannot compete with weeds. Deep soil penetration can sever the shallow growing roots of corn. Depending on the variety and growing conditions, corn is usually harvested between sixty and one hundred days after planting.
Corn is ready for harvesting about twenty days after silk first appears. When ready, the silk will turn brown but the husks are still green. Farmers check to make sure the corn is in the milk stage which is done by puncturing a kernel and checking for milky liquid. If the liquid is clear, the kernels are not ready. If there is no liquid, the farmer waited too long. Corn is harvested with a grain combine that has row dividers that pick up corn stalks as the combine moves through the field. Corn ears are broken off from the corn stalk and dragged into the combine. A separator inside the combine divides the husks, kernels, and cob. The kernels are stored while the cob and husks are dropped on the ground. They help prevent soil erosion and return plant matter to the ecosystem.
Approximately 20% of the annual corn harvest is used by industrial corn processors to produce a variety of products such as sweeteners, starches, oils, ethanol, and animal feeds. The two main methods of corn processing are wet milling and dry milling. In wet milling, corn is separated into relatively pure chemical compounds of starch, protein, oil, and fiber. Further processing is usually required to make these compounds into the final desired product. Starch is the primary product from wet milling and is processed into a variety of starch products or further refined into sweeteners sold in liquid or dry form. Industrial dry milling is a less versatile and less capital intensive process that focuses primarily on the production of grain ethanol. The main objective of dry milling is to separate the endosperm from the germ and pericarp as much as possible and per the dry name, it entails physical separation based on mass and requires no use of chemicals. Both processes begin with cleaning after corn arrives at the processing plant by truck, barge, or railcar. Shipments are inspected and cleaned multiple times to remove pieces of cob, dust, chaff, and foreign materials. An average bushel of yellow dent corn weighs fifty-six pounds and after cleaning, corn is moved to storage silos that can hold up to three hundred and fifty thousand bushels before processing begins.
Wet milling begins with steeping the corn in stainless steel tanks. Tanks can hold up to three thousand bushels of corn and they are soaked for thirty to forty hours in 50°C water. Kernels absorb water that increases moisture from 15% to 45% and doubles the size of the kernels. Sulfur dioxide is added at about 0.1% to prevent excessive bacterial growth. The acidity of the steepwater loosens the gluten bonds and releases the starch. Corn is then ground to break the germ free from the other components. The water is condensed to capture nutrients in the water for animal feed. The ground corn water slurry flows to germ separators that spin the low density corn germ out of the slurry. Germs are pumped on screens and are washed to remove any excess starch. Oil is extracted from the germs by a series of mechanical and solvent processes for further refining into finished oil. The remaining slurry is ground through a mill to release starch and gluten from kernel fiber. Screening catches fiber but lets the starch and gluten flow through. Fiber is piped to a feed house for use in animal feeds. The starch & gluten suspension (known as mill starch) is piped to a centrifuge. Gluten has a lower density than starch and is easily spun out for use in animal feeds. The remaining starch typically has 1%-2% residual protein which must be removed by dilution and washing in hydroclones. After this, the starch is usually 99.5% pure and at this stage, the starch can be dried and sold as unmodified corn starch, modified into specialty starches, or converted into corn syrups and glucose. Syrup is made by liquifying the starch suspension in the presence of acids or enzymes that convert the starch to a low-glucose solution. Refiners can halt acid or enzyme actions at key points to produce various types of sugars. Conversion halted at an early stage produces low to medium sweet syrups and is allowed to proceed to nearly all glucose for sweeter syrups. The finished products are further refined with various processes and excess water is evaporated. Syrups can be sold directly, crystallized into pure glucose, or further processed into high fructose corn syrup. From one bushel of corn, the following can be made: thirty-one pounds of starch OR thirty-three pounds of sweetener OR 2.5 gallons of ethanol PLUS eleven pounds of animal feed, 2.5 pounds of gluten meal, and 1.6 pounds of corn oil.
Glucose is one of the most fermentable sugars and can be converted to alcohol by traditional yeast fermentation. However, use of wet milling will ultimately result in lower ethanol than a dry milling process because some of the fermentable starch is lost during the various separations of products during the process. Industrial dry milling includes particle size reduction of corn with or without screening separation while retaining a good portion or all of the original germ and fiber. Much of the particle size reduction and separation is done with equipment similar to wheat flour milling, including hammer mills, stone mills, roller mills, screeners, sifters, specific gravity separators, and aspirators. If the kernels are processed for ethanol manufacturing, they are ground into a medium-to-fine meal and the final products are fuel ethanol and Dried Distillers Grains (DDGS), the leftover mash which is an animal feed product. Corn flour and related products are also made from the dry milling process. There are some dry fractionation processes that have been introduced in recent years that occur after milling to remove non-fermentable components of the kernel, but they result in co-products with less purity than those produced from wet milling and also reduce ethanol yield because some of the fermentable starch is lost. There is no globally recognized terminology for dry-milled corn products, but commonly used definitions are based on particle size and fat divides them into four categories: grits, meal, fine meal, and flour.
Transgenic Corn and Genetic Engineering
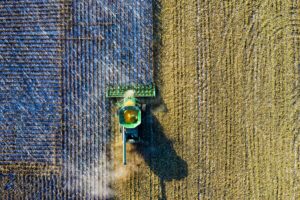 Genetically modified corn has been genetically modified through the addition of a small amount of genetic material from other organisms through molecular techniques. The gene that produces a genetic trait of interest is identified and separated from the rest of the genetic material from a donor organism. Corn that has been genetically modified for resistance to pests and to herbicides is used in multiple countries. The practice of engineering genetically modified crops remains controversial because of health effect concerns, impact on insects other than those targeted by the genetic modification, impact on other plants, and environmental concerns. The first varieties resistant to glyphosate herbicides were commercialized in 1996 by Monsanto and are known as Roundup Ready Corn. There are also Roundup Ready Sweet Corn varieties, known as the Performance Series. Roundup Ready seeds are referred to “terminator seeds” because the produced crops are sterile and farmers must purchase the most recent seed strain every year. Bayer CropScience has developed Liberty Link Corn which is resistant to glufosinate. Bt corn is a variant that has been genetically modified to express one or more proteins from the bacterium Bacillus thuringiensis. The protein is poisonous to certain pests, especially the European corn borer which causes about a billion dollars in damage to corn crops each year. The first genetically modified corn producing a Bt protein was approved in 1996 and subsequent genes have been introduced that kill corn rootworm larvae. When a part of the plant is ingested by the pest, the protein binds to the gut wall and the insect stops feeding, eventually causing a breakdown of the gut wall and the invasion of bacteria in the body. The endotoxin is considered very selective and is safe for humans, mammals, fish, birds, and other insects. Despite Bt being a popular pesticide spray since being introduced in the 1960s, the use of Bt for genetic modification is a subject of strong debate. One concern is that large-scale planting will render the endotoxin ineffective over time. Because of this, the EPA requires that 20% of Bt field areas be planted with non-Bt corn. In practice, this is difficult to enforce and one report states that nearly 20% of farmers in the United States Corn Belt overplant Bt corn. Another type of genetically modified corn is drought resistance, known as DroughtGard and first launched by Monsanto in 2013. Cross-contamination is a big concern and one incident in 2000 involved Starlink, a variety containing Bt that was approved for use in animal feed in 1998 but not for human food because it lasts longer in the digestive system than other Bt proteins. Starlink corn was found in food destined for consumption by humans in the United States, Japan, and South Korea. A recall was issued which began when taco shells sold in supermarkets were found to contain the corn. Fifty-one people reported adverse effects to the FDA and twenty-eight were determined by the CDC to possibly be related to Starlink, although blood tests for these individuals showed no hypersensitivity to the Starlink Bt protein. As more strains of genetically modified corn and other plants are developed, controversy will continue and new issues will emerge, making the need for proper testing and screening of genetically modified corn even more prevalent.
Corn and NIR Spectroscopy
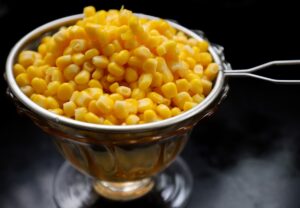 NIR spectroscopy has emerged as a tool for rapid, non-invasive, and cost-effective analysis of parameters of interest in corn that could potentially replace traditional reference methods. There are a number of quality parameters in corn that have been studied and predicted with NIR spectroscopy with results suitable for process control purposes. Other parameters have shown results good enough for screening purposes and more study and calibration work could improve the prediction results. Sweet corn and supersweet corn are considered two important varieties that are appealing to consumers and classifying different cultivars as well as distinguishing between viable and non-viable seeds were examined in two different studies using NIR spectroscopy. Good classification accuracy for the groups was obtained in both studies. One in-depth study using NIR spectra of over twelve thousand kernels determined the effect of different varieties, producing areas, ears, and ear positions on the NIR spectra. Results showed that genetic differences had the greatest influence on changes in the NIR spectra with producing area having a similar but smaller difference while the ears and ear position had much smaller effects. Many nutritive quality parameters in corn can be correlated to NIR spectra and another study created calibration models for various carbohydrates, protein, fiber, and digestibility parameters, with good correlation shown for most parameters. A practical application used calibration models to determine different nutritional parameters in various corn hybrids and then to estimate energy and digestibility rates, showing excellent results. Another study examined determining corn seed germination rate using NIR spectroscopy. While the calibration model showed good correlation, the sample size was limited and more work would be necessary before using this calibration in a practical setting. Mycotoxins are a huge concern for corn farmers and one study examined classifying healthy corn grains and grains diseased with Fusarium mycotoxin. While the classification rate was over 99% correct, it is certain that the classification is based on something else besides the toxin concentration as the threshold of detection for such toxins is far below the normal detection level for NIR spectroscopy. While an indirect correlation is acceptable in NIR chemometric models, further examination is necessary to determine the basis for the correlation. Maize cob is being used as a biomass fuel in some countries and NIR spectroscopy was examined as a method for determining gross calorific value in cobs, showing good results. Another study used mapping of a maize recombinant inbred line population with NIR spectroscopy to track the response of water deficit of traits associated with biomass quality. The results showed that water deficit favors cell wall degradability and that the breeding varieties that reconcile improved drought tolerance and biomass degradability is possible. Classification of different transgenic corn plants is important for breeding purposes and one study examined classifying plants based on different genetic lines, showing results considered good enough for screening purposes. A practical application used NIR spectroscopy to determine different nutritional components in seven distinct genetic groups within a specific corn germplasm collection. The parameters predicted from the NIR spectra were used as a basis for checking progress based on the expected genetic gain. All these parameters and measurements have been studied using NIR spectroscopy with results showing the potential to replace traditional reference methods.
References
Global Corn Market Outlook
https://www.expertmarketresearch.com/reports/corn-market
USDA: Corn and Other Feedgrains Market Outlook
https://www.ers.usda.gov/topics/crops/corn-and-other-feedgrains/market-outlook/
USDA Report: Corn and Soybean Production Up In 2020
https://www.nass.usda.gov/Newsroom/2021/01-12-2021a.php
Best and Easiest Ways to Plant Corn
https://www.kellogggarden.com/blog/growing/best-and-easiest-ways-to-plant-corn/
NCGA Corn Curriculum
https://nebraskacorn.gov/wp-content/uploads/2010/07/unit9_TeachersKey.pdf
Processing Maize Flour and Corn Meal Food Products
https://www.ncbi.nlm.nih.gov/pmc/articles/PMC4260129/
Corn Milling: Wet Vs. Dry Milling
https://blog.amg-eng.com/corn-wet-milling-vs-dry-milling/
The Corn Refining Process
http://docshare01.docshare.tips/files/26054/260549449.pdf
Genetically Modified Corn – Environmental Benefits and Risks
https://www.ncbi.nlm.nih.gov/pmc/articles/PMC212689/
Genetically Modified Maize
Bt-Corn: What It Is and How It Works
https://entomology.ca.uky.edu/ef130
Commercial Reference
The post Corn Overview appeared first on NIR-For-Food.
]]>The post Cereals & Barley Overview appeared first on NIR-For-Food.
]]>Introduction
A cereal is any cultivated grass grown for the edible components of its grain. The word cereal is derived from Ceres, the Roman goddess of harvest and agriculture. The term can also refer to the resulting grain itself, which can more specifically be called the cereal grain. The edible components of a cereal grain are composed of the endosperm, germ, and bran. Cereal grain crops are grown in greater quantities and provide more food energy worldwide than any other type of crop. Maize is the most highly produced cereal worldwide with over one billion metric tons grown annually. Wheat is second with nearly eight hundred million metric tons per year, followed by rice at nearly five hundred million metric tons, barley at just over one hundred and fifty million metric tons, and sorghum at around sixty million metric tons annually. Other cereals with significant worldwide production include millet and quinoa. Some cereals like maize are grown in many different areas in the world as there are species and varieties that have adapted to climate and growing conditions while others are more specific to certain parts of the world. In their natural and unprocessed form, cereal grains are a rich source of vitamins, minerals, carbohydrates, fats, oils, and protein. When the bran and germ are removed, the endosperm is mostly carbohydrate. In some developing countries, cereals are the primary food for daily sustenance and impoverished countries often depend on cereal shipments from other parts of the world. The long shelf life, high caloric content, and nutritional composition of cereal grains makes them ideal for such purposes. In developed countries, cereal consumption is more moderate and products can vary, but is still substantial in many countries. One important processed product of cereal grains and another use of the word “cereal” is breakfast cereals, which are often simply referred to as cereal in many Western societies where consumption is substantial. Hot cereals require a brief cooking period but are less popular than cold cereals, which are made ready to eat and are almost always eaten with milk.
History and Market Analysis
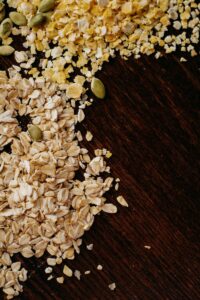 Cereals have played a substantial role in the development of human civilization. There is evidence of cultivation of cereals in Syria around nine thousand years ago. Wheat, barley, rye, oats, and flaxseeds were all domesticated in the Fertile Crescent region in ancient times. The name Fertile Crescent at least partially came from the development of agriculture in this region, along with irrigation and technological developments. Around the same time, farmers in China began to grow rice and millet. Farmers began to use irrigation, human-made floods, fires, and soil amendments to improve the growth of food crops. Around eight thousand years ago, cereal grains were domesticated in multiple parts of the world, including wheat and barley in multiple regions, millets and rice in East Asia, and sorghum and millets in sub-Saharan West Africa. Wheat, barley, and oats were cultivated in Greece as early as 7000 B.C. and by 6000 B.C., farmers were starting to mill grains by hammering them with stones and were toasting grains as well. Egyptians cultivated wheat and barley and fermented them to make beer. The first hand mills for grinding grain appeared around 1200 B.C. and continued to be used for thousands of years. As civilization developed more, cereal became a foundation for determining frontiers. Both the Great Wall of China and Roman limes demarcated the northern limit of cereal cultivation. The Silk Road, a stretch of trade routes connecting the east and west that was central to cultural, economic, political and religious development for many centuries, was built along the cereal belt of Eurasia. Cereals played an integral role in how long an army could be mobilized and how large it could be. Many ancient Chinese, Jewish, and Christian writings make references linking cereals with war. In more modern times, wheat was a staple of the European diet in the colonial era. The first European colonists in America imported wheat but had problems storing it and the cool climate made it difficult for crops to survive. Over time, colonists learned to grow oats, maize, and a hardy dry land rice as until the nineteenth century, rice was grown on dry land and not in paddles as it is today. Cornbread made out of maize became a staple of the American diet in the colonies. In 1769, the steamroller mill was introduced, making it possible to process wheat before it decayed. In 1834, a mechanical revolution began in farming with the introduction of the mechanical reaper as the capacity for growing cereal grains had far exceeded the ability to harvest it. Combine harvesters were introduced about fifty years later and by the early 1900s, a single farm could harvest almost twenty times as much land as could have been harvested one hundred years due to the mechanical revolution. Today, advances continue in cereals but mostly on the product itself, such as vitamin fortification, making products with increased health and nutritional benefits, and genetic engineering. Cereals and cereal-based products will continue to be a major part of the food chain around the world.
The global market for cereal and grain seeds is projected to reach $73.6 billion within the next five years while growing at a CAGR of 9.2%. The Asia-Pacific market is currently the largest market for cereal seeds and is expected to remain so in coming years, accounting for more than 30% of global demand. Driving factors in market growth include increasing demand from the food and especially animal feed industries, shrinking farmland, and increased biofuel demand. Global usage of maize in the animal feed industry increased over 2% from 2020 to 2021, with an estimated worldwide usage of 613 million metric tons. Maize is the major crop seed traded worldwide, accounting for over 35% of the global cereals and grain seed market share, followed by soybean and wheat. More than half of global maize production is in the United States and China, with the European Union and Brazil also holding significant market share. Growing population in Asian countries, especially China and India, is increasing demand in Asia while North America is projected to have comparable growth due to rising demand for biofuel.
The global breakfast cereals market is expected to grow from $44.5 billion in 2020 to $63.3 billion in 2028 at a CAGR of 4.8% during the forecast period. Projected growth is primarily attributed to the rising awareness of consumers regarding healthy foods and a balanced diet as well as a growing demand for ready-to-eat meals and advancements and innovations in food production. The market is dominated by cereals that can be consumed as is (usually with milk) and consist of wheat, corn, mixed grains, and other supplements. Breakfast cereals that are not fortified with sugar are considered very healthy as they are high in vitamins and minerals. They considered to have a perfect balance of time-saving, convenience, high energy, and good nutritional content in a food product. Globalization and rapid urbanization in developing countries has helped increase demand for these types of foods in many economies and global demand for cereal and cereal-based products will continue to increase in coming years.
Barley Composition, Growing, Harvesting, and Processing
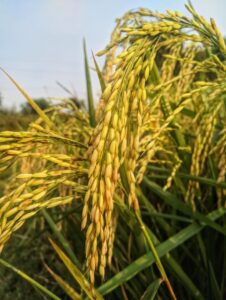 Barley ranks fifth among all crops in dry matter production in the world. It has been cultivated for centuries because of its versatility, adaptability to unfavorable and changing climate and soil conditions, and superior properties for malting and brewing. It is generally more tolerant to drought and saline soils than other cereal grains. The top five barley producers are Russia, France, Germany, Ukraine and Canada. Approximately 65% of barley produced in the world is used for animal feed, 30% for malting and brewing, and around 3% for human consumption. The primary use of barley as animal feed is for cattle. The nutritional content of barley is comparable to corn, oats, wheat, and sorghum. The energy content is slightly lower than most other grains due to higher fiber content, but the crude protein content of barley is higher than corn and similar to wheat and oats. Malted barley is the preferred grain that brewers use for making beer. The most basic form of malted barley is barley that has been allowed to germinate by soaking the grain in water, which prepares the starches to be converted to fermentable sugars. Barley is not a staple food for human consumption in most developed societies with the exception of Scandinavia and parts of Eastern Europe, but it is a staple food in many developing countries. In rural Tibet, barley provides approximately 80% of calories for native diets. However, there is increased interest in barley as a human food ingredient due to studies showing it to be an excellent source of dietary fiber, especially β-glucan. Barley kernels contain complex carbohydrates, are low in fat, are well-balanced in terms of protein to meet amino acid requirements, and are rich in some minerals, vitamins (especially Vitamin E), and antioxidant polyphenols. As is the case with all cereal grains, barley does not contain calcium and for this reason, supplemental calcium is used in diets for beef cattle. It can be used as whole-grain, pearled, raw-grain flour, whole-roasted grains flour, and roasted-grain flour. Roasted-grain flour particularly is used in many products, such as breakfast cereals, stews, soups, pastas, noodles, sauces, and baked products.
Barley varieties have many different types of classifications. The most important classification is two-row barley or six-row barley, a distinction in the physical morphology of the plant. The difference is caused by a single gene out of approximately thirty thousand. Both types have alternating sets of three spikelets along the barley head but in two-row barley, only the central spikelets are fertile and they develop seed creating a flat-shaped head. Six-row barley has a rounded head appearance with all six kernels developing. Two-row varieties are generally higher in starch and six-row varieties are higher in protein, but otherwise the nutritional composition is very similar. Two-row barley is usually more adaptable to dry growing conditions. Studies comparing the two types for animal feed have not shown any clear advantage between them. For brewing, two-row barley is desirable in some ways because germination is more uniform, seeds need a shorter steeping time, and have lower protein as high protein can make beer cloudy. However, six-row barley is used by many large brewers in North America as the higher protein favors higher potential for enzymatic activity which helps for conversion of mashes that are heavy in adjuncts like rice and corn. Other important classifications include malting vs. feeding, covered vs. hull-less, and floury starch vs. waxy starch. Hull-less barley is a form of domesticated barley with an easier to remove hull. It has lower fiber and higher protein and energy levels than covered barley.
Barley is easily planted in prepared seedbeds and can also be successfully no-tilled. It prefers adequate but not excessive moisture and will not grow well in waterlogged soils. Barley grows well in well-drained loams or light, clay soils in areas with dry and mild winters. It tolerates alkaline soils better than other cereal crops. There are numerous varieties and it is important to select a variety adapted to the region. Many varieties of barley are well-adapted to high altitudes and short, cold growing seasons. Pest and weed management are also particular to given regions. Harvesting is crucial in determining grain yield and quality of barley. The simplest and most common method is direct heading when the grain has ripened and dried to a moisture content of less than 12%. A thresher is used and is it important to set it up correctly to prevent the skinning and cracking of grain. If there are long periods of high relative humidity, the harvesting can be delayed and this increases the risk of head loss or discoloring of the grain. Grain can be direct harvested at a moisture above 12% but after harvesting, the grains must be placed under aeration or passed through a grain dryer to get the moisture to a proper level for storage. Drying at a temperature greater than 43°C can greatly reduce grain quality. If the moisture falls below 10% before harvesting, the barley grain becomes susceptible to skinning from over-threshing. If the barley is covered, the first step in processing is to remove the hull by blocking. Processing is especially important for barley used as animal feed as digestibility in processed barley is much higher than that of whole barley. The most common processing method is known as dry rolling. Barley should be crushed or cracked so that each kernel is broken into two or three pieces. This is usually done with a single-stage roller mill with ten to twelve grooves per inch. This method is effective and increases digestibility in animals, but shattered kernels that produce fine particles reduce the effectiveness of the feed. Variation in kernel size can make precise processing difficult. Steam rolled barley is subjected to high moisture steam for a period of one to eight minutes and is then rolled to produce a flat flake. Temper rolled barley requires the addition of water to increase the moisture to 18% to 20% before rolling and also results in a flaked product. Advantages of these two methods include fewer fine particles and improved ration acceptability. Steam flaking uses moisture, heat, and pressure to gelatinize starch granules. There have been numerous studies on different methods of processing barley as well as different varieties and their benefits and drawbacks. Ultimately, growing conditions and proper harvesting and processing have proven to be the most crucial factors in determining barley quality as a common quality parameter for variations in physical, chemical, and biochemical properties in processed barley grain has yet to be determined.
Breakfast Cereal History, Production and Processing
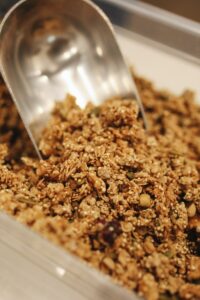 Breakfast cereal is a processed food made of grain and is usually intended to be eaten with milk during the morning meal. Cold breakfast cereals come ready to eat while hot breakfast cereals require a brief cooking period. Hot cereal has existed for centuries, beginning with the grinding of whole grains and cooking them in water to create gruels or porridge. The first types of cold cereal were invented in the late nineteenth century and in 1906, the Kellogg brothers formed the Kellogg Company after developing the first precooked and flaked cereal. By 1909, the company had sold over one million cases of cereal and cold breakfast cereal has far eclipsed hot cereal in popularity. Soon after, Charles Post founded what is now known as the General Foods Corporation. Today, competition among companies is strong for the breakfast cereal market which is at an all-time high, especially in the United States. It is a highly penetrated market in the United States and Europe but there is room for growth in many other parts of the world. In the United States, companies are looking to boost consumption by repositioning breakfast cereal as a snack or dessert, introducing new and eye-catching flavors, and playing to the increasing awareness of health and nutritional benefits of foods, especially breakfast foods.
The main raw ingredient in breakfast cereal is grain and many types are used, such as corn, wheat, oats, rice, rye, and barley. Some types of hot and cold cereals, such as plain oatmeal and shredded wheat, are consumed with the addition of no other ingredients but most types of breakfast cereal include many additional ingredients depending on the recipe and processing method. Some of these ingredients include salt, sweeteners, yeast, coloring and flavoring agents, preservatives, vitamins, minerals, seeds, nuts, cinnamon, chocolate, marshmallows, and dried fruits. While some natural cereals are sweetened with concentrated fruit juice, most breakfast cereals use white or brown sugar, corn syrup, or malt. Any added vitamins or minerals need to be added after cooking as most of them will greatly lose nutritional value when exposed to high heat.
Breakfast cereal manufacturing requires several stages and there are different types of processes depending on the final product, but all processes begin with the preparation of the grain. When grain arrives at the cereal factory, it is inspected and cleaned. Some cereals use whole grain while others require crushing between metal rollers to remove the outer layer of bran and grind the grain into a fine flour. Whole and partial grains are mixed with other ingredients in a pressure cooker. Speed of rotation, time, and temperature are subject to the type of grain used. After cooking, the grain is passed to a drying oven but a certain amount of moisture must be left so it can be shaped as needed. If flour is used, the flour is mixed with other ingredients and cooked in an extruder. A long screw mixes the flour with other ingredients while moving the mix through the extruder. At the other end, the cooked dough is expelled and cut into pellets by a rotating knife.
Types of breakfast cereal include flaked cereal, puffed cereal, shredded cereal, and granola. Flaked cereal can be made from whole grains or extruded pellets which are allowed to temper for several hours, allowing the moisture to stabilize. After tempering, the grains or pellets are flattened by rollers and sent to an oven for toasting and removal of excess moisture. Unmodified corn starch is often added to help the flakes withstand processing. Moisture control is crucial during this process. Moisture should be between 28% and 32% after tempering and between 1% and 3% in the finished product to obtain the correct crunchy texture and toughness. Puffed cereal is usually made of rice or wheat. It uses a piece of equipment called a gun after tempering and partial flattening between rollers (known as bumping). A gun is a high temperature and pressure oven that swells the grains and suddenly releases the pressure, causing them to puff up in size. A gun needs to operate between 400°C and 500°C and around 200 psi to be effective. Puffed grains have a moisture content between 5% and 7% which needs to be dropped to between 1% and 3%. These grains absorb moisture very easily, requiring a final layer of coating and proper packing to maintain crispiness and prevent spoilage. Wheat is usually used for shredded cereal. It is boiled in water to allow full moisture penetration. After boiling, the grain is tempered for up to twenty-four hours and passed through two metal rollers. While similar to the process for flaked cereal, shredded cereal uses one smooth roller and one grooved roller while both rollers are smooth for flaked cereal. A metal comb against the grooved roller shreds the grain into a continuous ribbon as it passes through, which is then cut and baked until the right color and dryness are obtained. Granola is made by mixing grain and other ingredients which are cooked as a mix. Common ingredients in granola include nuts, dried fruits, seeds, honey, and malt extract. Oil is added to the mix to allow the ingredients to stick together. The mixture is cooked between 300°F and 425°F until lightly brown with a moisture content of around 3%. Certain types of carbohydrates can be added to help with binding. Some cereals may be sprayed with a layer of coating after processing that can include sweeteners, flavors, food coloring, preservatives, vitamins, and mineral. Coatings can add sweetness, provide a layer between the cereal and milk to prolong crispiness, and improve storage stability. Proper packaging is essential in airtight and waterproof bags to prevent spoilage. High density polyethylene (HDPE) is typically used but manufacturers are exploring alternatives such as plant-based packaging and also looking to improve convenience for the consumer by using resealable, flexible, stand-up, and single-serve packages. The cereal bag is then usually put into a cardboard box for further protection. As the breakfast cereal market continues to grow, proper monitoring and quality control methods will evolve to meet new challenges presented by innovative products and manufacturing processes.
Cereals and Barley and NIR Spectroscopy
NIR spectroscopy has emerged as a tool for rapid, non-invasive, and cost-effective analysis of parameters of interest in cereals and barley that could potentially replace traditional reference methods. There are a number of quality parameters in cereals and barley that have been studied and predicted with NIR spectroscopy with results suitable for process control purposes. Other parameters have shown results good enough for screening purposes and more study and calibration work could improve the prediction results. One review paper examined the use of NIR spectroscopy for determining essential parameters in the field and at harvest for cereal crops. These parameters include dry matter, nitrogen, water content, starch, sugars, and various plant diseases, although the monitoring of mycotoxins must be carefully validated as the actual concentration of these is usually far below the threshold of detection for NIR spectroscopy. Another review paper specifically examined various components related to starch in cereal grains and associated biophysical and chemical properties, such as amylose, amylopectin, pasting, gelatinization, and viscosity. Malt barley is essential for beer manufacturing and a practical application used NIR spectroscopy to evaluate yield and quality traits in different varieties of malt barley by examining kernel protein and starch content to determine high yield varieties. Superoxide dismutase (SOD) is a protective enzyme in barley and NIR spectroscopy was examined for determining the activity of SOD in barley leaves, showing acceptable results. Herbicides can have a detrimental effect on barley growth and amino acid content is considered an important physiological parameter for measuring the effect of herbicides. NIR spectroscopy was used to determine amino acid content to evaluate the effect of herbicides on barley leaves. Barley milk production as a replacement for cow milk is steadily increasing and NIR spectroscopy was examined for measuring parameters in barley milk by determining particle size and total dissolved solid to optimize blending time. Sorghum is the next highest produced cereal grain after barley and one study examined determining various quality traits in sorghum using NIR spectroscopy, including amylose, protein, lipids, endosperm texture, and hardness. Sugar content is an essential component in breakfast cereal and one study examined using NIR spectroscopy to determine total sugars as well as sucrose, fructose, and glucose in breakfast cereals, showing excellent results. Rising demand for snack foods has increased the production of cereal bars of various types and NIR spectroscopy was used to classify three different sample types of cereal bars (Conventional, Diet, and Light). All these parameters and measurements have been studied using NIR spectroscopy with results showing the potential to replace traditional reference methods.
References
Cereal Grains
Cereals & Grains
http://www.fao.org/in-action/inpho/crop-compendium/cereals-grains/en/
Grain Seed Market – Growth, Trends, COVID-19 Impact, and Forecasts (2021-2026)
http://www.fao.org/in-action/inpho/crop-compendium/cereals-grains/en/
Global Cereals and Grains Seed Market Share 2021 with Top Countries Data And Covid-19 Analysis: Industry Overview by Size, Share, Future Growth, Development, Revenue, Top Key Players Analysis and Growth Factors
Breakfast Cereal Market Size, Share & Trends Analysis Report By Product (RTE, Hot Cereal), By Distribution Channel (Supermarket, E-Commerce, Convenience Store), By Region, Vendor Landscape, And Segment Forecasts, 2018 – 2025
https://www.grandviewresearch.com/industry-analysis/breakfast-cereals-market
Barley
https://www.sciencedirect.com/topics/agricultural-and-biological-sciences/barley
Barley Production – Harvest and Grain Quality
https://www.agric.wa.gov.au/barley/barley-production-harvest-and-grain-quality
2-Row vs. 6-Row
Effects of Barley Grain Processing on Productivity of Cattle
https://www.sciencedirect.com/science/article/abs/pii/S0377840106005335
A Guide on the Production and Processing of Breakfast Cereals
https://cablevey.com/a-guide-on-the-production-and-processing-of-breakfast-cereals/
Commercial Reference
The post Cereals & Barley Overview appeared first on NIR-For-Food.
]]>The post Beans Overview appeared first on NIR-For-Food.
]]>Introduction
The term “dry beans” refers to varieties of beans other than green beans, string beans, and soybeans and can also be known as “common bean”. The global dry beans market is projected to register a CAGR of 4.3% during the period from 2021 to 2026. The COVID-19 pandemic and subsequent lockdown restrictions created a surge in demand for dry beans because of their long shelf-life. Even before the pandemic, there was an increasing inclination towards vegan diets and for people with health issues like diabetes who want to increase fibers and proteins in their diet as well as reduce meat consumption. Awareness of the benefits of plant-based diets has increased due to the pandemic and made people more health-conscious as well as fueling a desire to boost their immune systems. The top global bean producers are Myanmar, India, Brazil, China, Mexico, Tanzania, United States, Kenya, Uganda, and Rwanda. Major importers include India, China, Bangladesh, Egypt, and the United States. Myanmar is the leading producer of dry beans, accounting for over 20% of total global output. One factor contributing to the high production of beans in Myanmar is the need to use land after rice cultivation instead of leaving it idle. Beans are planted at the beginning of the winter season and thrive on leftover moisture from the rice season without requiring additional irrigation. India and China are the largest importers of dry beans from Myanmar, accounting for nearly $600 million in beans combined in 2019. Coffee beans are another significant type of bean in the global market. The global market was valued at $9.5 billion in 2019 and is expected to reach around $12.1 billion by the end of 2027, growing at a CAGR of 3.5% from 2021 to 2027. Market growth is expected to be driven by a growing increase of coffee consumption by consumers, greater awareness of health benefits associated with coffee, and an expansion of the retail market which makes the buying process easier for consumers. There has also been a marked decrease in the consumption of carbonated drinks which has helped the coffee beans market grow, but increased availability of tea is expected to be a factor in restraining growth of the market. Cocoa beans also make up a very significant portion of the beans market and they are used to make chocolate and various cocoa based products, such as cocoa butter, cocoa powder, and cocoa liquor. Market size for cocoa beans was estimated at $9.94 billion in 2018 and is projected to expand at a CAGR of 7.3% through 2025.
 Beans are a good and affordable source of numerous nutritional components that offer a myriad of health benefits. Consumption and demand are increasing as more people look for alternatives to meat that offer some of the nutritional components found in meat. They offer high protein and amino acid content while being lower in calories and saturated fat than many other protein sources, including meat and dairy products. Beans are also high in fiber, iron, minerals, and vitamins. Folate is one vital nutrient found in beans that makes healthy red blood cells and helps prevent neural tube defects in a fetus during pregnancy. They are also rich in polyphenols, which are antioxidants that help the body fight the effects of free radicals and protect the body from disease. Some studies have shown that bean consumption can help fight cancer by acting as antioxidants and anti-inflammatory agents. Other studies suggest that beans can improve heart health. One such study found a clear correlation between eating beans and a lower risk of coronary heart disease while another suggests that the nutrients in beans can help lower cholesterol, which is a proven risk factor for heart disease and heart attacks. The high fiber in beans can help stabilize blood glucose levels and thus prevent diabetes. Another study looked at the effects of consuming one cup of beans per day and there was a reduction in blood sugar levels and lower blood pressure in those who ate the beans. Replacing animal-based proteins with plant-based protein helps liver health as well. Fiber and healthy starches help the consumer to feel full and may help prevent overeating and weight loss. Many kinds of beans enhance gut health by improving intestinal barrier function and may help promote weight loss by feeding healthful gut bacteria colonies. Coffee beans and coffee are also a rich source of biologically active compounds, such as caffeine, chlorogenic acids, nicotinic acid, trigonelline, cafestol, and kahweol, all of which have significant potential as antioxidants. As more research is conducted on the health benefits of bean consumption, there will be a need for more fast and non-invasive testing methods for measuring parameters of interest in beans.
Beans Composition, Harvesting, and Processing
 Beans are the major source of protein, dietary fiber, minerals, and vitamins for many people and these components have the potential to meet 10% to 20% of the recommended daily amount of certain nutrients for adults. The chemical composition varies greatly at 15% to 30% protein, 60% to 70% carbohydrates, and 0.7% to 2% lipids. Carbohydrates are composed primarily of starch, followed by dietary fiber and α-galactosyl derivatives of sucrose. Major proteins are globulins and albumins. The presence of various protease inhibitors, lectins, and lipoxygenase have been verified as well as flavonols, isoflavones, phenolic acids, tannins, and phytic acid. Processing, soaking, and cooking may reduce the phytochemicals content and reduce nutritional content while also increasing the bioavailability of minerals and quality of proteins.
Most beans are best planted around the average last frost date in the spring as they are sensitive to cold temperatures and frost. The soil should be warmed to 60°F and begun to dry out. One exception to this is peas, which need to be planted early enough in the spring so they mature while the weather is still cool. Peas are usually planted between February and April in the United States and Canada and are grown as a fall or winter crop in warmer regions. Seeds should not be soaked in water although this is a popular myth as they can germinate poorly if they absorb too much water, either from soaking or from being planted in overly wet soil. They are best watered after planting or planted before a heavy rain. Seeds should be planted about one inch deep. Bush beans can be planted four to six inches apart in rows two feet wide while pole beans should be planted three feet wide. Ideal conditions will have full sun, well-drained soil, average fertility (too much fertility can produce excess foliage at the expense of the bean crop), slightly acidic soil with a pH from 6 to 6.8, and good air circulation. Germination time under good conditions is typically eight to ten days. Once the plant has germinated and emerges from the soil, it typically grows to a height of twelve to eighteen inches. Successive crops are often planted every two to four weeks for an extended harvest season until late July in northern areas. Hoeing must be done carefully as bean roots are shallow and brittle. First-time plantings should have the soil inoculated with rhizobium bacteria, which invade plant root hairs and multiply while the plant produces a protective nodule enclosure and energy for the bacteria. The bacteria converts nitrogen gas to ammonia in the nodules, which assists sprouting and may increase yield. Monitoring for pests and diseases is important as well.
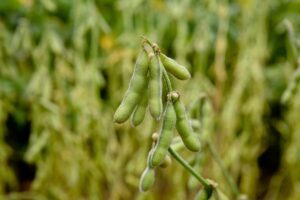 Harvesting beans is a fairly simple process. Most dry beans are harvested when they have lost a significant amount of moisture. Bush beans are ready for harvesting around fifty to sixty days after sowing while pole beans are ready for harvesting sixty to ninety days after sowing. Typically, farmers want to harvest beans when the pods are around 18% moisture. At this stage, the pods will be yellow and brown and not dry enough for the shells to shatter. Leaves will turn yellow and drop from the plant, leaving only stems and dry pods. Green beans are best harvested when immature and pods that are bulging have grown past their peak. Plants can be pulled up by hand or harvested by a combine, after which they are transported by truck to a storage bin or bean elevator. It is important to cut or snap beans from the plant and not tear pods from the branches. If picked at the proper time, plants will continue flowering and produce new pods. Beans that are properly dried before harvesting require minimal processing, need no refrigeration before freezing, and can be shipped all over the world. Dry beans do require getting the beans out of the pods by threshing. For small amounts, this can be done by hand by squeezing the pods open. For more than a half-acre of beans, threshing equipment is used. Cleaning and sorting is done after threshing and split beans are often fed to farm animals. Different methods are used including sieves, sifters, destoners, gravity separators, and color sorters that use optical technology to separate beans by shape and color. If the beans are to be canned, blanching is the first step in the process. The beans are briefly scalded in boiling water, removed, and plunged into ice water or placed under cold running water. This process is important to stop enzyme actions that can cause loss of flavor, color, and texture. It also cleans the surface of dirt and organisms, brightens color, and helps stop the loss of vitamins. After blanching, beans are sealed in cans with liquid (usually water), salt, and other additives that help maintain texture and color. A pressure canner is used to cook the beans under high heat using steam pressure. Canned beans do have a much higher sodium content than fresh beans and thorough rinsing and draining can reduce the sodium content by around forty percent. Dry beans require much a longer cooking time but generally are higher in nutritional content and taste fresher, although the shelf-life of canned beans is usually a few years. Processed beans are bean products that have been created from dried beans and imply that an additional step beyond conditioning has occurred. Examples include baked beans, bean pastes, puffed snacks, refried beans, rehydrated beans, and bean flours. Many types of beans and bean products can be found in fresh, canned, and processed forms and have become a staple food in most parts of the world.
Beans and NIR Spectroscopy
NIR spectroscopy has emerged as a tool for rapid, non-invasive, and cost-effective analysis of parameters of interest in beans that could potentially replace traditional reference methods. There are a number of quality parameters in beans that have been studied and predicted with NIR spectroscopy with results suitable for process control purposes. Other parameters have shown results good enough for screening purposes and more study and calibration work could improve the prediction results. Two comprehensive review papers have been published that examine the use of NIR spectroscopy in bean analysis. The first examines various studies that used NIR spectroscopic applications to determine the feasibility of measuring quality parameters in faba bean crops, such as protein, moisture, starch, oil, tannins, alkaloid glycosides, and total polyphenols. Discrimination analysis was studied as well, such as distinguishing different varieties and growing locations. The study also reviewed some Mid-IR applications. The second review paper examined NIR applications in different legumes, including faba bean, soybean, peas, and chickpeas. Parameters of interest include moisture, protein, fat, ash, fiber, lipids, starch, and carbohydrates. Most studies examined in these two review papers showed good results. Another study examined water content and germination time in mung bean, showing good correlation with reference methods and also providing a basis for correlating the ascorbic acid content to germination time. Isoflavones are a key nutrient in soybeans and may help prevent osteoporosis. NIR spectroscopy was examined for determining both individual and total isoflavone components, showing results good enough for screening purposes. Cocoa beans are another important type of beans and NIR spectroscopy was used to determine fat and moisture content in another study. Coffee beans are important as well and three studies using green coffee beans studied the feasibility of using NIR spectroscopy to determine moisture, caffeine, and chlorogenic acid in intact beans as well as sorting of Robusta beans. NIR spectroscopy has also been used in practical applications to determine parameters like amino acid content in soybeans coming from different regions in Brazil and to determine protein content in faba beans in conjunction with mineral analysis by a different method to study the effects of growing location and genotype based on tannin content for studying potential genetic improvement to increase mineral content. All these parameters and measurements have been studied using NIR spectroscopy with results showing the potential to replace traditional reference methods.
References
History of the Bean – Different Types of Beans
http://www.vegetablefacts.net/vegetable-history/history-of-beans/
18 Types of Beans
https://www.jessicagavin.com/types-of-beans/
Dry Beans Market – Growth, Trends, COVID-19 Impact, and Forecasts (2021-2026)
https://www.mordorintelligence.com/industry-reports/dry-beans-market
Beans: The Basics
https://www.medicalnewstoday.com/articles/320192#the-basics
What Are The Health Benefits of Beans?
https://www.medicalnewstoday.com/articles/320192#the-basics
Nutritional and Bioactive Compounds of Bean: Benefits to Human Health
https://pubs.acs.org/doi/pdf/10.1021/bk-2012-1109.ch015
Farm To Fork
Farm-To-Fork.pdf (beaninstitute.com)
Beans Seed Germination, Time, Temperature, Process/p>
https://gardeningtips.in/beans-seed-germination-time-temperature-process
A Guide to Growing and Harvesting Dry Beans
https://www.thespruce.com/grow-and-harvest-dry-beans-3016628
How Are Dried Beans Processed and Distributed Today?
Commercial Reference
The post Beans Overview appeared first on NIR-For-Food.
]]>The post Cola, Energy, and Tea Drinks Overview appeared first on NIR-For-Food.
]]>The carbonated soft drink has emerged as the most prominent product segment within the non-alcoholic beverage industry. While the growth of this segment is not expected to match other segments in coming years due to different factors (most prominent being an increase in health consciousness of consumers), it still represents over one-third of the global demand in the non-alcoholic beverage market. Soft drinks consist primarily of carbonated water, sugar, and flavorings. The market is very competitive and manufacturers are quick to respond to consumer preferences and demand, as has been shown over the years by the advent of diet colas, caffeine-free drinks, low-sodium drinks, and preservative-free beverages. Brand name companies often keep their formulas and required manufacturing procedures a closely guarded secret. Carbonated water makes up to 94% of a soft drink. It adds sparkle and bites as well as acting as a mild preservative. Carbon dioxide is an ideally suited gas for soft drinks because it is inert, non-toxic, less expensive than other gases, and easy to liquefy. Sugar (or artificial sweetener) is the second main ingredient and makes up 7 to 12% of a soft drink. Sugar can be added in dry or liquid form. It adds sweetness and body to the beverage as well as balancing flavor and acids. The overall flavor of a soft drink depends on a balance of sweetness, tartness, and acidity. Citric acid is the most common acid in soft drinks and has a lemon flavor. Acids add a sharpness to the background taste and stimulate saliva flow, as well as acting as a mild preservative. Other additives add taste, aroma, and enhanced appearance to soft drinks.
Soft Drink Manufacturing
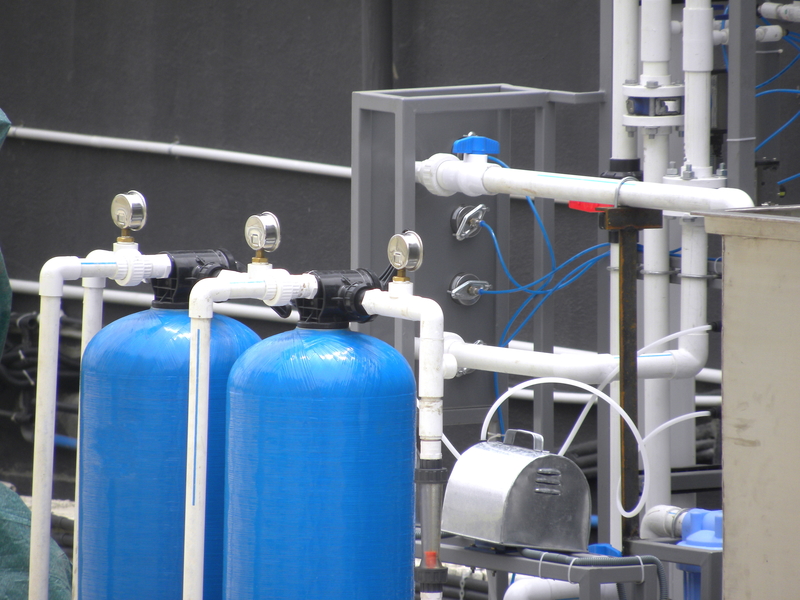
Removing impurities from the water is the first step in soft drink manufacturing. Suspended particles, organic matter, and bacteria can degrade taste and color. Impurities are removed by a traditional process of coagulation, filtration, and chlorination. Alkalinity is adjusted by adding lime to reach the desired pH level. Dissolved sugar and flavor concentrates are pumped into pressurized batch tanks and carefully mixed to prevent unwanted aeration. Syrup can be sterilized while in the tanks and fruit-based syrups are almost always sterilized. Machines called proportioners carefully regulate the flow rates and ratios of the liquids.
In most cases, carbonation occurs after the finished product is made. Temperature is carefully controlled because carbon dioxide solubility increases as temperature decreases. The amount of pressure and carbonation varies by the individual drink. The finished carbonated product is then transferred into bottles or cans and sealed immediately. Containers are brought to room temperature before labeling and then packed for shipping.
Tea

Tea is the world’s second-highest consumed beverage after water and is categorized into two types: black tea and green tea. Black tea accounts for about 80% of world tea production and green tea accounts for the other 20%. Various fermentation processes are used to produce over three hundred different types of tea worldwide. It has a similar appeal to the consumer as coffee for its physiological and psychoactive properties. Some important quality control parameters in both powder tea and tea soft drink, such as Soluble Solids Content, amino acids, caffeine, theaflavins (an antioxidant indicator), and water extract have been successfully analyzed using NIR spectroscopy.
Conclusion
As is the case with fruit juices, sugar and acidity are the two most important components in soft drinks and NIR spectroscopy has been examined as a potential tool to replace traditional time-consuming and expensive methods. There are strict quality regulations for all ingredients used to manufacture soft drinks. Clean water, raw material inspection, and sanitary conditions are essential for avoiding bacterial and other forms of contamination. Low-quality sugar can create particles in the beverage and spoil it. It is vital to monitor sugar and acidity in soft drinks to ensure a product that meets quality control standards and will not spoil. Most soft drinks have a shelf life of at least a year if stored under proper conditions. Because soft drink manufacturers not only closely guard their recipes but also their testing procedures, there is little-published documentation on measuring parameters of interest in soft drinks. However, it is known that Soluble Solids Content and pH are measurable constituents using NIR spectroscopy and these are two of the most important quality parameters in soft drinks. Other potential applications include glucose, sucrose, and fructose measurements in syrup and citric acid. Studies are measuring these parameters in many types of fruit juice (especially orange juice) and with proper calibration work, they should be measurable in soft drinks as well. While less studied using NIR spectroscopy because they are newer to the market, the manufacturing process for energy drinks is similar to cola. As with cola, Soluble Solids Content and pH are important quality parameters in energy drinks and have been successfully measured using NIR spectroscopy. Advancements in application development and online analysis continue to move forward to realize the potential of NIR spectroscopy as a method for real-time, online implementation as a process control tool.
References
Quality Analysis, Classification, and Authentication of Liquid Foods by Near-Infrared Spectroscopy: A Review of Recent Research Developments – Wang, Sun, Pu, and Cheng, Critical Reviews in Science and Nutrition, 2017, Vol. 57, No. 7, 1524-1538
https://www.tandfonline.com/doi/pdf/10.1080/10408398.2015.1115954
Quantitative Determination and Classification of Energy Drinks Using Near-Infrared Spectroscopy – Racz, Heberger, Fodor, Analytical and Bioanalytical Chemistry, 2016, 408:6403-6411
https://link.springer.com/article/10.1007%2Fs00216-016-9757-8
Prediction of Amino Acids, Caffeine, Theaflavins, and Water Extract in Black Tea Using FT-NIR Spectroscopy Coupled Algorithms – Zareef, Chen, Ouyang, Analytical Methods, Issue 25, 2018
https://pubs.rsc.org/en/content/articlelanding/2018/ay/c8ay00731d#!divAbstract
Commercial Reference
The post Cola, Energy, and Tea Drinks Overview appeared first on NIR-For-Food.
]]>The post Fruit Juices Overview appeared first on NIR-For-Food.
]]>Fruit juice is made from a wide variety of fruits, including oranges, apples, grapes, cranberries, grapefruits, tomatoes, bayberries, and pineapples. In the United States, the term “fruit juice” can only be legally used to describe a product which is 100% fruit juice. A blend of fruit juice with other ingredients is referred to as a “juice cocktail” or “juice drink.” Sugar is an important constituent of any fruit juice and while labels may say “No Added Sugar,” the product may contain large amounts of naturally occurring sugars, and this must be noted on the product label with other carbohydrates. Beverages listed as 100% juice may also contain unlisted additives. The suffix “ade” refers to dilution with water and sugar if fruit juice is too sour, rich, or acidic to consume. Examples of this include lemonade and limeade.
Fruit Juice Manufacturing

The first step in making fruit juice is to wash and sort the food source. It is prepared by mechanically squeezing or macerating the fruit without the application of heat or solvents. This process can be referred to as “cold-pressed.” There are typically two automated methods that are used for this process. One method uses two metal cups with sharp metal tubes on the bottom cup that come together, which removes the peel of the fruit and forces the flesh through the metal tube. There are small holes in the tube that allow the juice to escape and be collected. The other method requires fruits to be cut in half and the juice is extracted using reamers. Most juices are filtered after extraction to remove fiber or pulp. One notable exception is orange juice, which is sold pulp-free as well as with various levels of pulp. After filtration, juices can be concentrated in evaporators if desired. Concentrated juices are heated under a vacuum to remove water and then cooled to around 13°C, removing around two-thirds of the water in the process. Concentrated juice is easier to transport and has an increased shelf life. It may be reconstituted with water or sold directly in the concentrated state. Pasteurization is used to inactivate enzymes and destroy any spoilage microbes. This normally consists of a continuous system that has a heating zone, hold tube, and cooling zone, after which the juice is packaged. High intensity pulsed electric fields have emerged as an alternative to traditional pasteurization, and this method maintains better quality while performing the same tasks required for pasteurization.
Conclusion
There are many important constituents to measure in fruit juice, and NIR spectroscopy has been examined as a potential tool to replace traditional time-consuming and expensive methods. Sugar and acidity measurements are the most important constituents and are strictly regulated in marketed juices. Sugars such as glucose, fructose, and sucrose are essential quality control parameters in fruit juices. Soluble Solids Content (SSC, expressed as °Brix) is one of the primary characteristics used to determine the sweetness of fresh and processed fruit products. Titratable Acidity (TA) is related to the organic acid contents. It is a measurement of color stability and the shelf life of fruit and its processed products. These sugar and acidity constituents have all been studied using NIR spectroscopy as an analytical tool with excellent results. In the case of glucose, sucrose, and fructose, calibration models created from stock standards were able to measure the concentration of these sugars in both apple and orange juice.
NIR spectroscopy can provide an online method for real-time process control of these parameters as well as monitor for adulteration and contamination. As is the case with all food products, adulteration is a major problem for fruit processed products. Adulteration can take on many forms including the addition of cheaper quality juice or artificial sweeteners. NIR spectroscopy has been examined for juice discrimination as well for adulteration using saccharin with excellent results. This type of analysis also shows the potential for analyzing blend profiles in fruit juices. Proper storage of fruit juice is important as well because improper storage leads to oxidation, producing undesired physiochemical changes. Such changes directly affect both pH and SSC and NIR spectroscopy has shown the potential to monitor stored fruit juice for quality by monitoring these parameters. NIR spectroscopy can be used to monitor parameters of interest in fruit juice and has the potential to replace traditional methods. Although more work and study are required, it is a potential replacement for both laboratory and online traditional quality control methods in the fruit juice industry. Advancements in application development and online analysis continue to move forward to realize the potential of NIR spectroscopy as a method for real-time, online implementation as a process control tool.
References
Quality Analysis, Classification, and Authentication of Liquid Foods by Near-Infrared Spectroscopy: A Review of Recent Research Developments – Wang, Sun, Pu, and Cheng, Critical Reviews in Science and Nutrition, 2017, Vol. 57, No. 7, 1524-1538
https://www.tandfonline.com/doi/pdf/10.1080/10408398.2015.1115954
Rapid Analysis of Sugars in Fruit Juices by FT-NIR Spectroscopy – Rodriguez-Saona, Fry, McLaughlin, Calvey, Carbohydrate Research 336 (2001) 63-74 https://www.sciencedirect.com/science/article/abs/pii/S0008621501002440
Measurement of Soluble Solids Contents and pH in Orange Juice Using Chemometrics and Vis-NIRS – Cen, He, Huang, Journal of Agricultural and Food Chemistry, 2006, 54, 7437-7443
https://pubs.acs.org/doi/abs/10.1021/jf061689f
Applications of FT-NIRS Combined With PLS Multivariate Methods For the Detection & Quantification of Saccharin Adulteration in Commercial Fruit Juices – Mabood, Hussain, Jabeen, Food Additives, and Contaminants: Part A, 2018, Vol. 35, No. 6, 1052-1060
https://tandfonline.com/doi/abs/10.1080/19440049.2018.1457802?journalCode=tfac20
Commercial Reference
The post Fruit Juices Overview appeared first on NIR-For-Food.
]]>The post Coffee Overview appeared first on NIR-For-Food.
]]>In the coffee industry, there is a need for in-line analysis for physicochemical and functional properties. The principal quality parameters include moisture, blend ratio, roasting degree, and caffeine. Coffee is first harvested as ripe berries and can have a moisture content over 60% before going through multiple drying processes that result in green coffee beans.
Moisture content in green coffee beans is strictly regulated, and the safe range is from 8% – 12.5%. In most countries, beans above 12.5% are not allowed to be traded due to microbial growth, mycotoxin formation, decreased sensory quality, and unstable production conditions, among other unwanted consequences. Beans below 8% are shrunken and often have a poor appearance. Storage stability and keeping moisture consistent in different batches are essential because the moisture has a strong effect on roasting quality. Coffee blending almost always occurs in raw coffee before roasting. This is a crucial part of the process to make coffee with a given flavor and aroma, and it must be continually reproduced, which is often a difficult task due to variations in harvest quality. Blends are often comprised of at least four different varieties to achieve particular flavors and aromas because blending is the only means to account for natural fluctuations in quality.
Coffee Manufacturing
Once the desired blend ratio is achieved, the roasting process begins. Flavor is locked within green coffee beans and heating starts a series of chemical reactions. Although it can vary due to moisture and other factors, roasting typically begins when the temperature inside the bean reaches around 200°C. As moisture evaporates, aromatic oils are released. Caramelization occurs as starches break down, changing them to simple sugars that brown and alter the color of the bean. Sucrose rapidly disappears during roasting and may disappear entirely in darker roasts. Thus, the color of the beans is an important marker in the roasting process and is an indicator of volatile compound patterns that determine aroma and flavor. Caffeine is an important parameter in coffee as the stimulating effect is the biggest factor in consumer appeal of coffee. If coffee is decaffeinated, it is done by either soaking in hot water or steaming and using a solvent before roasting. After roasting is complete, the roasted coffee beans are moistened, and cold air is blown through them. Some intact beans are sold, but most often, the coffee is ground through rolling mills. Rolling mills consist of several groups of cylinders moving in opposite directions, all adjusted accordingly to reach the final desired level of grinding. Ground coffee is packaged, and higher-quality coffee is usually vacuum packed to diminish the effects of oxidation, which can break down aromas in the coffee and affect flavor.
Conclusion
NIR spectroscopy has emerged as a tool for rapid, non-invasive, and cost-effective analysis of parameters of interest in coffee that could potentially replace traditional reference methods. Moisture is one of the best-measured constituents using near-infrared light because of its strong absorption, and NIR spectroscopy has been demonstrated as an effective tool for determining moisture in green coffee beans. The roasting color of beans and varietal composition of blends are critical parameters in the development of sensory properties of coffee. Color analysis can verify the performance of the roasting and thus the desired characteristics of the final product, while the varietal composition is important for quality as well, especially when comparing the higher quality and more expensive Arabica species to the lower quality Robusta species. NIR spectroscopy has proven to be a feasible method for measuring these parameters in roasted ground coffee. Studies have also been conducted for measuring caffeine and other major alkaloids in coffee. Adulteration is a major problem in many food and beverage products, and coffee is subject to many forms of adulteration. One form of coffee adulteration is mixing a low-quality blend with a high-quality blend, but often coffee can be adulterated with adulterants that are an entirely different constituent. These can include corn, soybean, and wheat. NIR spectroscopy has been examined as a potential method of identifying adulterants in coffee. The potential has been demonstrated for using NIR spectroscopy as an analytical tool for analyzing coffee and replacing traditional methods. Advancements in application development and online analysis continue to move forward to realize the potential of NIR spectroscopy as a method for real-time, online implementation as a process control tool.
References
Quality Analysis, Classification, and Authentication of Liquid Foods by Near-Infrared Spectroscopy: A Review of Recent Research Developments – Wang, Sun, Pu, and Cheng, Critical Reviews in Science and Nutrition, 2017, Vol. 57, No. 7, 1524-1538
https://www.tandfonline.com/doi/pdf/10.1080/10408398.2015.1115954
Application of Infrared Spectral Techniques on Quality and Compositional Attributes of Coffee: An Overview – Barbin, Felicio, Sun, et al., Food Research International 61 (2014) 23-32 https://www.sciencedirect.com/science/article/pii/S096399691400009X
Commercial Reference
The post Coffee Overview appeared first on NIR-For-Food.
]]>