The post Grains appeared first on NIR-For-Food.
]]>Introduction
The global grain farming market is expected to grow from $1128.97 billion in 2020 to $1150.56 billion in 2021 at a CAGR of 1.9%. The small growth is due to companies rearranging their structure and operations as well as recovery from the impact of COVID-19. Market growth is expected to increase in coming years with a projected size of $1463.22 billion in 2025 at a CAGR of 6.4%. Grain market crops include wheat, barley, oats, corn, rice, beans, soybeans, and oilseeds. Asia Pacific is the largest region in the global grain farming market, accounting for 69% of the market in 2020 while North America accounts for 9%. The global grain mill products market is separate and was valued at $655.0 billion in 2018. It is expected to grow to $830.8 billion by 2026 with a CAGR of 3.4%. Flour is mostly created by grinding wheat, maize, and rice, with wheat accounting for nearly 85% of total global flour products. A number of factors are expected to fuel the increased growth in the grain and grain mills product market in coming years. There has been a notable increase in seed replacement rates over the last decade in growing markets, especially for cereal crops. The rate increase is mostly a result of the increased use of hybrid seed. Hybrid grain seed produces a hybrid by fertilizing an inbred variety having sterile pollen with pollen from plants of a different inbred variety that has fertile pollen. Thus, hybrid grains have two genetically different parents and can produce up to 30% more plant yield than comparable inbred varieties grown under the same conditions. In India from 2017 to 2018, the seed replacement rates in maize was around 80%. In China, it is estimated that almost 60% of the total planted area for rice is hybrid rice. Maize and rice are the second and third most produced agricultural commodities in the world behind sugarcane. Rice is the most important food crop with regard to human nutrition and caloric intake and it provides over one-fifth of the calories consumed worldwide by humans. Approximately 95% of rice is consumed by people. While more maize than rice is produced, a good percentage of maize is used for animal feed, corn ethanol, corn starch, and corn syrup. There is a high demand for functional flours which are specialized products that are manufactured and treated to have enhanced nutrient qualities with increased health benefits. Flour with reduced gluten requires the use of genetically modified wheat, rice, or maize. Grain products are an essential food source for both animals and humans.
By definition, grain analysis is monitoring grain quality for mycotoxin contamination, pesticide residue, nutritional value and composition, and physical characteristics such as size and weight. While the exact process for producing grains varies, all of them include primary processing methods of planting, harvesting, cleaning, sorting, and final processing through a plant that is typically automated to obtain the desired final product. There is an increasing demand for new methods of grain analysis to address challenges as methods of minimizing resources, maximizing output, and creating new products are evolving. The grain analysis market was valued at $1.95 billion in 2019 and is projected to reach $2.92 billion by 2027 while growing at a CAGR of 5.6%. A number of factors are expected to fuel the growth of the grain analysis market. There is an increasing number of government regulations worldwide related to the safety and quality of food grains as well as an increasing outbreak of foodborne diseases. Both of these factors are expected to drive the growth of the grain analysis market. Transgenic and genetically modified grains are a growing percentage of the grain market and these crops create imminent challenges in both testing methods and regulatory approval. Minimizing pesticide residue is important for both health reasons and optimizing the amount of pesticide used to save costs.
Much attention has been paid to the detection of the quality and safety of grains. The worldwide market for these products creates a need for rapid and cost-effective methods to analyze and classify quality, especially when considering the large amount of variability of grain products in the market. Moreover, consumer awareness of quality assurance amongst brands is a major factor in consumers’ decisions to purchase grain products. The implications of poor product quality spreading in today’s social media environment as well as the financial consequences of product recall can be devastating to a company’s bottom line. Traditional methods for analyzing grain products include wet chemistry methods and sensory analysis. These methods are time-consuming and expensive, especially when applied in an on-line setting. Developing rapid, non-invasive, cost-effective, and environmentally sound methods for quality testing has become a priority for grain manufacturers. One such method with potential for both laboratory and industrial testing of grain products is NIR spectroscopy.
Grain Varieties
Rice
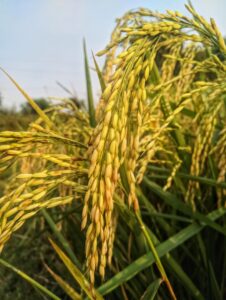
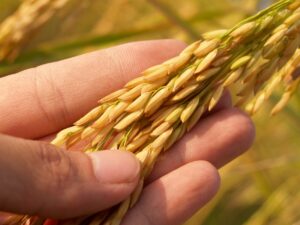 Rice is the most widely consumed food in the world by humans and it is estimated that one-fifth of all worldwide caloric intake comes from rice. It is the third most produced agricultural commodity after sugarcane and maize, but a good portion of sugarcane and maize is used for other purposes besides human food, while approximately 95% of all rice produced is eaten by humans. More than 90% of rice is grown in Asia, principally in China, India, Indonesia, and Bangladesh. It can be eaten alone or used in a great variety of side dishes, main dishes, or soup. Varieties are classified as long, medium, and short grained. Extensive research for methods to fortify the nutritional content of rice has been conducted and continues to evolve because it is such an essential food in many countries for human nutrition. One important and controversial research topic is genetically engineered rice. Research continues on transgenic rice with properties such as herbicide tolerance, insect, bacteria, fungus, and virus resistance, grain yield, and nutritional quality. Chemical and physical parameters of interest in rice include starch components, protein, moisture, viscosity, and antioxidant parameters. Other important quality control parameters include adulteration detection, brand authenticity, transgenic discrimination, and pest infestation. New methods will continue to emerge for quality control testing of rice and NIR spectroscopy has been extensively studied for rice analysis.
Wheat
 Wheat is cultivated worldwide and is grown on more land area than any other food crop. The trade market for wheat is larger than that of all other crops combined and worldwide production is over seven hundred million tons annually. Wheat is the leading source of vegetable protein in food and is also an important source of carbohydrates. It contains a number of healthy nutritional components, such as vitamins, dietary fiber, and phytochemicals. Wheat can be consumed as a whole grain or milled into flour. There are approximately thirty thousand wheat varieties grown worldwide. Different varieties not only have different nutritional properties, but are also suited to growing in different areas of the world based on their suitability to specific climates, soil, and other environmental factors. Consumption of wheat continues to increase and one reason for this is the unique properties of gluten proteins, which help facilitate the production of processed foods. Processed foods are in high demand, especially in Western markets and this demand continues to rapidly increase. Extensive research is conducted on transgenic varieties but to date, no genetically modified wheat is grown commercially anywhere in the world. There have been a few incidents of cross-contamination with commercial wheat that have been controversial. Chemical and physical parameters of interest in wheat quality control include moisture, protein, starch, gluten content, fiber components, and sugars. Other important quality control parameters are origin authentication, adulteration detection, and wild vs. transgenic discriminant analysis. New methods will continue to emerge for quality control testing of wheat and NIR spectroscopy has been extensively studied for wheat analysis.
Flour
 Flour is an important staple food and is used to make numerous products, such as bread, pasta, noodles, crackers, cakes, and pastries. Wheat is the most common grain used to make flour, accounting for about 85% of all flour produced and the term “flour” typically refers to wheat flour unless another type of flour is prevalent in that part of the world. Flour can also be made from rice, rye, barley, millet, quinoa, buckwheat, and oats. Some flours are made from non-grain products as well, such as roots, beans, nuts, and seeds. Flour consists of the endosperm, germ, and bran together (known as whole grain flour) or of the endosperm alone (refined flour). Many refined flours are bleached with a whitening agent to make white flour. This process significantly reduces nutritional content and nutrients are usually added after the bleaching process. The two main components of flour are starches and proteins. Higher protein flour is harder and stronger and is typically used to make crusty or chewy breads. Lower protein flour is softer and better suited for baked goods. Development of gluten-free flour has become a priority as a sizeable portion of people suffer from celiac disease, wheat allergies, and other ailments that do not allow them to consume gluten in appreciable quantities. Chemical and physical parameters of interest in flour include moisture, protein, starch components, fat, and ash. Other important quality control parameters include adulteration detection, blend content, and species discriminant analysis. New methods will continue to emerge for quality control testing of flour and NIR spectroscopy has been extensively studied for flour analysis.
Corn
 Corn is also referred to as maize and in general, the two terms are synonymous. It is a domesticated grass that first emerged nearly seven thousand years ago in Mexico when humans first learned how to cross-pollinate plants. It is produced more than any other cereal grain crop worldwide and is used for human consumption, livestock feed, fuel, and processed into corn starch which has numerous food and non-food uses. It is estimated that 60% to 70% of corn produced worldwide is used for animal feed while the remainder is used for human food, fuel, and corn-based products. The evolution of different biotypes has created corn species that can grow from the tropics to the northern temperate zone, at sea level to twelve thousand feet above it, and with growing periods ranging from six weeks to thirteen months. Corn can be processed by dry milling or wet milling. Dry milling is typically used for ethanol production and focuses on physical separation of the endosperm from the germ and pericarp without the use of wet chemicals. Wet milling focuses on starch production and the product can later be processed into a variety of starch-based products or further refined into liquid or dry sweeteners. Research of genetically modified corn is extensive and while transgenic corn has great potential for development of drought, pest, and disease resistant varieties as well as helping to increase yield per acre, the practice is controversial. Chemical and physical parameters of interest in corn include carbohydrates, starch, protein, fiber parameters, lignin content and structure, and sugars. Other important quality control parameters include sweet and supersweet corn cultivar and seed sorting, silage nutritional value, transgenic vs. non-transgenic discriminant analysis, and nutrient content as a breeding selection tool. New methods will continue to emerge for quality control testing of corn and NIR spectroscopy has been extensively studied for corn analysis.
Oilseeds
 Oilseeds are defined as the seed (endosperm) of any of several plants that are used commercially as a source of vegetable oil and can also refer to the plant that yields any such seed. Examples include groundnuts/peanuts, sunflower, sesame, safflower, linseed, soybean, rapeseed/canola, and palm kernel oil. They are crushed to obtain oil for human consumption and biodiesel production. The leftover material after crushing is processed into meal which is used for high protein livestock and poultry feed. Soybeans account for over half of all oilseeds produced worldwide and soybean oil has become so prevalent in the United States that the term “vegetable oil” is synonymous with soybean oil. Demand and trade are steadily increasing due to many factors, especially greater demand from China. There are regulations for the processing of soybeans into oil and meal related to specific processes and nutritional content. One of these is the inclusion of soybean hulls in the soybean meal, known as dehulled meal vs. non-dehulled meal. Yield per acre can vary greatly between different types of oilseeds. Soybeans typically produce about sixty gallons of oil per acre while rapeseed and canola can produce yields as high as two hundred and fifty gallons per acre. Soybean is commonly grown as a rotation crop with corn in the United States. The quality of oilseeds and oil is greatly dependent on the crop species and environmental conditions when growing, making quality control monitoring of utmost importance. Chemical and physical parameters of interest in oilseeds include oil content and yield, moisture, protein, fatty acids, lipids, carbohydrates, ash, and amino acids. Other quality control parameters include classification of viable and non-viable seeds, geographical origin, and variation based on species origin, country of origin, and light vs. dark seeds. New methods will continue to emerge for quality control testing of oilseeds and NIR spectroscopy has been extensively studied for oilseeds analysis.
Beans
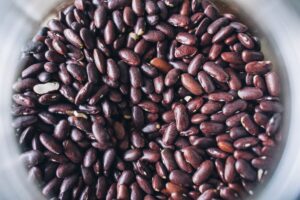 Beans are a valuable food product for both humans and animals. They are the seeds of one of several genera of the flowering plant Fabaceae, which has nearly twenty thousand known species. Beans are valued for their health benefits, ease of transporting, long shelf-life, and high nutritional content. They can be cooked in numerous ways, such as boiling, frying, and baking. Popular bean varieties include green beans, lima beans, kidney beans, black beans, chickpeas, and soybeans. Beans are a major source of protein, dietary fiber, carbohydrates, minerals, and vitamins. Studies have shown numerous potential health benefits, such as reduction in blood sugar levels, lower blood pressure, and improved gut health. High fiber and healthy starches can help eaters feel full, helping to prevent overeating and facilitating weight loss. Demand for beans is surging due to numerous factors. The long-shelf life of beans makes it an ideal food for consumers to stock during the COVID-19 pandemic. Beans offer high protein and amino acid content while being much lower in calories and saturated fat than many high protein sources, such as meat and dairy products. Increased health awareness among consumers has increased demand for alternative health food sources that are high in protein and beans is an ideal such food. Other types of beans include coffee and cocoa beans and both coffee and chocolate are also seeing increased demand around the world. Chemical and physical parameters of interest include protein, moisture, starch, fat, oil, lipids, ash, carbohydrates, fiber, minerals, and seed germination time. Other quality parameters of interest in beans include macronutrient content based on contrasting tannins, species discrimination, and roasting level in coffee beans. New methods will continue to emerge for quality control testing of beans and NIR spectroscopy has been extensively studied for beans analysis.
Barley
 Barley ranks fifth among all cereal crops in dry matter production in the world. It has a number of qualities that are favorable to growers, such as versatility, adaptability to unfavorable and changing climate and soil conditions, and superior properties for malting and brewing compared to other grains. It is also more tolerant to drought and saline soils than many other cereal grains. Nearly two-thirds of produced barley is used for animal feed. Approximately 30% is used for malting and brewing and the remainder is for human consumption. Energy content is slightly lower than most other grains because of higher fiber content, but the crude protein content is higher than that of corn and similar to wheat and oats. Malted barley is the preferred grain of brewers and is made by allowing the barley to germinate in water for a period of time, which prepares the starches for conversion into fermentable sugars. While barley is not a staple food in most countries, it is popular in Scandinavia and Eastern Europe. Interest in barley as a staple food is increasing as studies have shown it to be an excellent source of dietary fiber, complex carbohydrates as well as some minerals, vitamins, and antioxidant polyphenols. Barley has multiple classifications and the most important one is two-row barley vs. six-row barley, a distinction in the physical morphology of the plant. Both classifications have distinct advantages and disadvantages depending on both growing conditions and final use, especially for brewing. It can be processed into flour and milk as an alternative to traditional dairy products. Chemical and physical parameters of interest in barley include dry matter, nitrogen, starch, sugars, and viscosity. Other quality control parameters include mycotoxin detection, pest prevention, and the effect of herbicide on plant quality. New methods will continue to emerge for quality control testing of barley and NIR spectroscopy has been extensively studied for barley analysis.
Sorghum
Sorghum is the next most produced cereal grain after barley. It is a major food cereal in many Asian and African countries. Most varieties of sorghum are drought and heat tolerant as well as nitrogen efficient, making them an important grain in arid countries. It can be eaten whole or processed into multiple products. Sorghum flour is popular in China. Sorghum syrup or molasses is made in multiple countries and in India, popped sorghum is similar to popcorn with smaller puffs. As is the case with other grains, biochemical and physical properties like amylose, protein, and lipids can influence the rheological and sensory properties of the final processed product. For example, consistency of thick porridge is positively correlated with amylose but negatively with protein and lipids. Couscous and tortillas made from sorghum have similar correlations. Chemical and physical parameters of interest in sorghum include amylose, protein, lipids, moisture, endosperm texture, and hardness. Other quality control parameters include breeding analysis and pest, disease, and mycotoxin detections. New methods will continue to emerge for quality control testing of sorghum and NIR spectroscopy has been extensively studied for sorghum analysis.
Process Analytical Technology (PAT) & On-Line Measurements
Process Analytical Technology (PAT) is a framework for innovative process manufacturing and quality assurance. Critical points and parameters during manufacturing of a product are defined and the process is designed in a way that such points and parameters can be measured using analytical tools and instruments for real-time process feedback and control. Such instruments must be able to measure on-line and in a non-invasive manner. Many vendors have developed instruments that are able to measure multiple points in a process with a single instrument, usually using optical fibers and probes. PAT has become an important part of pharmaceutical as well as chemical manufacturing and is beginning to acquire a hold in the food & beverage industry. One such analytical tool with great potential for use in PAT is NIR spectroscopy.
There are significant challenges to implementing PAT in a grain manufacturing environment. NIR spectroscopy has been proven as a useful tool for measuring parameters of interest in the grain industry. Vendors are coming up with new and innovative ways to make on-line measurements a feasible solution for companies. Advances such as improved fiber-optics, in-situ sampling, a transition to integrated automation, improved data management systems, and communication systems in the Internet and Cloud age have all contributed to implementing PAT. The food and beverage industries also present particular challenges due to natural product variability. In the case of pharmaceuticals and chemicals, the manufacturing process is usually conducted in a controlled environment with constituents that rarely show variability in spectral data over time. For foods and particularly agricultural products, there can be marked differences in products due to many factors, such as temperature variability, seasonal variation, differences in soil and nutrients, and different breeds of the same product. Such variability is especially important to account for when performing grain analysis. Such differences can create variability in spectral data that must be incorporated into calibration models when calibrating NIR spectrometers and other analytical PAT tools. This is known as making models “robust” and often requires a larger and more incorporative sample set to achieve the desired results.
Calibration studies have been conducted for measuring parameters in the grain industry in-line as well as in the laboratory. Results have been good and show that in-line measurements are a feasible tool for grain analysis using PAT. Full adoption of PAT in the grain industry will require a collaborative effort from process engineers, food scientists, and other contributors to provide the industry with a manufacturing framework for the 21th century.
References
Grain Seed Market – Growth, Trends, COVID-19 Impact, and Forecasts (2021-2026)
https://www.mordorintelligence.com/industry-reports/cereals-and-grains-seed-market
Grain Farming Global Market Report 2021: COVID-19 Impact and Recovery to 2030
Grain Mill Products Market Size, Share & Trends Analysis Report By Product (Wheat, Rice), By Region And Segment Forecasts, 2019-2025
Functional Flours Market Size, Share, & Trends Analysis Report By Application, Regional Outlook, Competitive Strategies, And Segment Forecasts, 2019 To 2025
https://www.grandviewresearch.com/industry-analysis/functional-flours-market
Grain Analysis Market Size and Forecast
https://www.verifiedmarketresearch.com/product/grain-analysis-market/
Process Analytical Technology for the Food Industry -O’Donnell, Fagan, Cullen, et al., Springer, Food Engineering Series (2014)
Commercial Reference
The post Grains appeared first on NIR-For-Food.
]]>The post Spices appeared first on NIR-For-Food.
]]>Introduction
The global spice and herbs market was estimated to be valued at approximately $6.91 billion in 2017. It is expected to grow at a CAGR of 7.1% from 2018 to 2023. Spices are aromatic plant substances used primarily for flavoring, coloring, or preserving food. While many uses of spices are interchangeable with herbs, spices are made from seeds, fruits, roots, or the bark portion of a plant while herbs are made from either leaves, flowers, or stems.
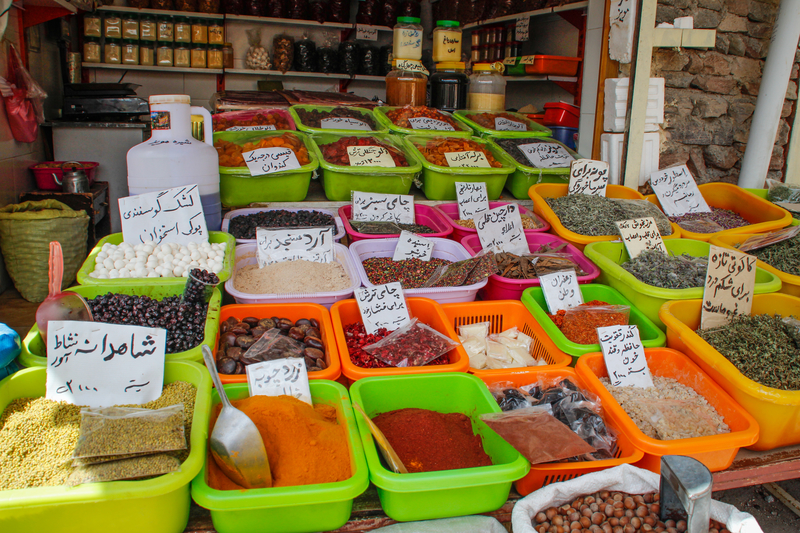
Spices are known for their strong flavoring and antimicrobial properties. Since they are often used in small quantities, spices add few calories to food when used normally but can contribute high amounts of vitamins and minerals to the diet when used in larger quantities. Most spices and herbs also have substantial antioxidants, mostly due to phenolic compounds like flavonoids. Antioxidants also act as natural preservatives, which help increase nutritional content in stored food. Before the advent of modern cooling and storage methods for shipped meats, spices were the primary method for preventing spoilage. Spices are available in fresh, whole dried, and pre-ground dried forms. Spices are normally dried and ground for convenience but grinding increases surface area, thus increasing oxidation and evaporation rates. Spice flavor comes mostly from volatile oils that are prone to oxidation and evaporation. Whole spices have a stronger flavor and longer shelf life than ground spices. In general, whole spices have a shelf life of two years, and ground spices have a shelf life of six months. Fresh spices are more flavorful than dried form but are more expensive and have a much shorter shelf life. In addition to food uses, spices have also been used in medicine, religious rituals, cosmetics, and perfume production. The market is large and diversified with one hundred and nine varieties listed by the International Organization for Standardization (ISO). India is the world’s largest producer and exporter of spices, producing about seventy-five of the ISO varieties. Numerous spice blends exist in different parts of the world. Notable spice blends include Masala (India), Curry (India), Berbere (Ethiopia), Jerk (Caribbean), Adobo (Latin America), Mitmita (Africa), Ras El Hanour (Morocco), Chinese Five-Spice Powder (China), Old Bay (United States), and Mixed Spice (England). Trade potential is strong, especially in areas with favorable climatic conditions with significant local demand like Asia-Pacific. A high percentage of spices and herbs, whether traded locally or exported, are produced by small-scale farmers. Factors driving the market growth include increased availability of international cuisine, increased consumer consumption of natural products and convenience foods, and a larger scope of new and attractive taste creations to meet consumer demand. Increased demand and production of spices have created a need for new testing methods for spice analysis, especially for determining spice authenticity and adulteration. One such method that has been examined is NIR spectroscopy.
History

The history of spices and herbs goes back to ancient times and is almost as old as human civilization. It is believed that early hunters and gatherers wrapped meat in the leaves of bushes, discovering that this enhanced taste. Over time, nuts, seeds, berries, and bark were also shown to enhance the taste as well as masking unpleasant tastes and odors. As early as 3500 BC, ancient Egyptians were using spices for flavoring, cosmetics, and embalming their dead. Spices were used as a food preservative in early times as well. Chinese writings around 2700 BC mention the use of plants for medicinal purposes. Eventually, the use of spices spread from the Middle East and China to the Eastern Mediterranean and Europe. For thousands of years, spices were transported by donkey or camel caravan from China, Indonesia, India, and Ceylon (present-day Sri Lanka) through the Middle East to Europe. Spice trade played a crucial role in history in many civilizations, including Egyptian, Roman, Greek, and Arabian. During the Middle Ages, spices were considered as valuable as gold and gems in Europe and were a driving force in the world economy. Competition and demand for spices among European nations led to the colonization of India and other parts of Asia. Marco Polo mentioned spices frequently in his travel memoirs, which were written around 1300 AD. The demand for spices also led to the Age of Exploration, eventually resulting in the discovery of the New World. Christopher Columbus’ journey in 1492 was a search for a sea route to the land of spices. In 1497, Vasco de Gama was more successful in finding India by sea by sailing around the southern tip of Africa.
Spices have played an essential role in American history as well. Plant-based medicine was the primary source of medicine in the United States from early colonization until about 1930. Even today, many modern medicines are derived from plant-based medicine, such as aspirin from willow tree bark. After the American Revolution, the United States entered the world spice trade without British taxes and trade restriction. American agricultural and manufactured products were traded all over the world for spices. In modern times, the world spice trade has become more decentralized. While spices are no longer as prevalent when used for medicine or as a preservative, the demand for their use for flavoring and their health benefits is stronger than ever.
Spice Processing, Manufacturing, Blending, and Packaging
 While there is a large variety of spices and herbs, the general procedure for processing and manufacturing is similar for all types. The first step is to ensure good raw material for harvesting. Premature harvesting of crops will result in a lower quality product. Crops can be harvested early by farmers for fear of theft, urgency for money, or fear of bad weather.
The localized nature of the spice industry can make these things difficult to monitor. Crops must be cleaned and washed before harvesting. Dust and dirt are removed using either a winnowing basket or cleaning machine. After cleaning, crops are washed in potable water before the drying stage. The drying stage for spice and herb crops is crucial for good quality products. If crops are not adequately dried, mold can grow and can reduce the sale price of spices by over 50%. In extreme cases, bacteria can grow on some spices and present a health risk. The drying procedure can differ based on whether the crops are harvested during the dry or wet season. During the dry season, sun drying is adequate for drying crops. This must be done carefully to avoid dust and dirt contamination as well as the threat of rain. Larger farms may use solar dryers to avoid these problems. During the wet season or times of high humidity, dryers using wood are often used. It is important to not overheat or over dry the crops. Specifications for the proper moisture content vary among different spices and herbs but generally vary from 6% to 13%. Some spices require special conditions for drying, such as being dried in the dark to maintain color.
If the spice is to be ground, this occurs after drying. Manual grinders can be used for small scale production. Larger scale production uses grinding mills which must be monitored carefully. Grinding mills create large amounts of dust requiring ventilation and spices can overheat during grinding if the temperature is not kept cool. Ground spices need to be checked for uniformity as well. There are many well-known spice blends and blending occurs after grinding. Ensuring completion of blending and a uniform mixture presents a big challenge for large spice producers. Packaging requirements can vary in different ways, such as different requirements for ground or whole spice, for the type of spice, and need to account for the humidity level. Boxes and sacks are adequate for whole spices if the humidity is not high. Ground spices are typically stored in a barrier film like polypropylene to avoid flavor loss and contamination.
Adulteration, Monitoring, and NIR Spectroscopy
Adulteration is a huge problem in the food industry for both economic and safety reasons. The history of spice adulteration goes back thousands of years and can present different forms. Some adulteration can be defined as incidental, meaning foreign substances can be incorporated into food from negligence or ignorance. This can occur during harvesting. Harvesting at the wrong time can also create adulteration by reducing nutritional value or having a product with an improper moisture level. Farmers may do this out of fear of theft or because they need money quickly. Intentional adulteration occurs with the intent to cause harm or create economic gain. One form of adulteration is mispresenting the geographical origin of a product, which is relatively harmless but still can have economic consequences. A more dangerous and intentional form of adulteration is contaminating spices with other products, both non-toxic and toxic. Examples of non-toxic spice adulteration include tomato skins in paprika, buckwheat and millet in black pepper, and starch in onion powder. Adulteration with toxic substances has led to illnesses and death. One such incident occurred with Hungarian ground paprika which was contaminated with lead oxide, leading to several deaths and dozens of illnesses. Lead oxide can dissolve in hydrochloric acid in the stomach, making it toxic upon ingestion. Another example is Sudan I dye, a known rodent carcinogen and banned food additive, which has been used as an adulterant in both chili powder and paprika. Other dyes that are not approved for use in food have been discovered in ground capsicum. There are inherent challenges to testing for spice adulteration. Methods of contamination by adulteration are constantly evolving and are difficult to assess visually. Current methods for determining spice adulteration are morphological, microscopic, chemical, or DNA based. These tests are usually expensive, time-consuming, and difficult to use on a large scale to determine the authenticity of a spice.
There is a need for fast, non-invasive, and reliable testing methods for spices. In addition to adulteration, moisture and blending tests would be very useful to the spice industry. One potential method that has been examined for spice testing is NIR spectroscopy. Studies have been conducted that use NIR spectroscopy to detect adulterants in spices as well as in other types of food. Many studies have shown excellent results and prove the feasibility of spectroscopic methods as an alternative to traditional testing. Moisture is a well-known measurable constituent using NIR spectroscopy because water is highly absorbing of NIR light. Using NIR spectroscopy as a method to determine drying time should be a feasible application for spices. In the case of blending, determining blending end time presents a difficult challenge. While blending is a proven application in the pharmaceutical industry, blending of pharmaceuticals occurs under controlled conditions and with the same type of ingredients. Building calibrations using natural products can show variability in NIR spectra that are not because of changes in the parameter of interest. In the case of spice blending, differences in raw materials might make it difficult to use NIR spectroscopy as a method. As of this writing, there are no known studies to determine the feasibility of monitoring spice blending using spectroscopic methods. However, large spice companies are interested in finding new methods to determine the endpoint of spice blending. It is likely that studies will be conducted in the future to see if NIR spectroscopy is a feasible method for such measurements.
Process Analytical Technology (PAT) & On-Line Measurements
Process Analytical Technology (PAT) is a framework for innovative process manufacturing and quality assurance. Critical points and parameters during manufacturing of a product are defined and the process is designed in a way that such points and parameters can be measured using analytical tools and instruments for real-time process feedback and control. Such instruments must be able to measure on-line and in a non-invasive manner. Many vendors have developed instruments that are able to measure multiple points in a process with a single instrument, usually using optical fibers and probes. PAT has become an important part of pharmaceutical as well as chemical manufacturing and is beginning to acquire a hold in the food & beverage industry. One such analytical tool with great potential for use in PAT is NIR spectroscopy.
There are significant challenges to implementing PAT in a spice manufacturing environment. NIR spectroscopy has been proven as a useful tool for measuring parameters of interest in the spice industry. Vendors are coming up with new and innovative ways to make on-line measurements a feasible solution for companies. Advances such as improved fiber-optics, in-situ sampling, a transition to integrated automation, improved data management systems, and communication systems in the Internet and Cloud age have all contributed to implementing PAT. The beverage and food industries also present particular challenges due to natural product variability. In the case of pharmaceuticals and chemicals, the manufacturing process is usually conducted in a controlled environment with constituents that rarely show variability in spectral data over time. For foods and particularly agricultural products, there can be marked differences in products due to many factors, such as temperature variability, seasonal variation, differences in soil and nutrients, and different breeds of the same product. Such variability is especially important to account for when performing spice analysis. Such differences can create variability in spectral data that must be incorporated into calibration models when calibrating NIR spectrometers and other analytical PAT tools. This is known as making models “robust” and often requires a larger and more incorporative sample set to achieve the desired results.
Calibration studies have been conducted for monitoring parameters in the spice industry in-line as well as in the laboratory. Results have been good and show that in-line measurements are a feasible tool for spice analysis using PAT. Parameters of interest for quality control of spices include adulteration detection and quantification, moisture, protein, volatile/essential oils and blending endpoint. Full adoption of PAT in the spice industry will require a collaborative effort from process engineers, food scientists, and other contributors to provide the industry with a manufacturing framework for the 21th century.
References
Spice Market – Global Industry Analysis: Size, Share, Growth, Trends, and Forecast 2016-2024
https://www.transparencymarketresearch.com/spice-market.html
Spice and Herb Extracts Market – Growth, Trends, and Forecasts (2019-2024)
https://www.mordorintelligence.com/industry-reports/spice-and-herb-extracts-market
McCormick Science Institute
https://www.mccormickscienceinstitute.com/resources/culinary-spices
VLC Spices: Manufacturing and Exporting
https://www.vlcspices.com/
The Spice Trader: History of Spices
https://www.thespicetrader.co.nz/history-of-spice/
Process Analytical Technology for the Food Industry -O’Donnell, Fagan, Cullen, et al., Springer, Food Engineering Series (2014)
Commercial Reference
The post Spices appeared first on NIR-For-Food.
]]>The post Seafood appeared first on NIR-For-Food.
]]>The post Seafood appeared first on NIR-For-Food.
]]>The post Alcoholic Beverages appeared first on NIR-For-Food.
]]>The post Alcoholic Beverages appeared first on NIR-For-Food.
]]>The post Dairy appeared first on NIR-For-Food.
]]>The post Dairy appeared first on NIR-For-Food.
]]>The post Edible Oils appeared first on NIR-For-Food.
]]>Overview
The global edible oils market is expected to register a CAGR of 5.1% and have an estimated value of $130.3 billion by 2024. One factor that contributes to these high projections is an overall increase in health concerns among consumers, which increases the demand for edible oils higher in unsaturated fatty acids like canola and olive oil. Quality assurance in edible oils production is critical not only for price and brand protection but also for safeguarding human health.

Moreover, consumer awareness of quality assurance amongst brands is a major factor in consumers’ decisions to purchase edible oil products. The implications of poor product quality spreading in today’s social media environment, as well as the financial consequences of a product recall, can be devastating to a company’s bottom line. These factors along with the large size of the global market have created a demand for new and objective quality control methods. Traditional methods are costly and time-consuming. Developing rapid, non-invasive, cost-effective, and environmentally sound methods for quality testing has become a priority for edible oil manufacturers. One such method with potential for both laboratory and industrial testing of edible oil products is NIR spectroscopy.
Raw Material Testing
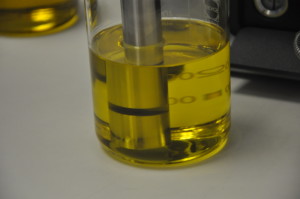
Edible oil comes from various parts of plants, usually from seeds (sunflower, palm kernel, safflower, cotton, sesame, and grapeseed) or nuts (peanut, soybean, almonds, and walnuts). In the case of olives, the oil comes from the olive fruit itself. Fish oil is especially known for its high nutritional value from Omega-3 fatty acids. Some studies have been conducted to analyze nutrients in olive leaves for optimal amounts of nitrogen, phosphorous, potassium, calcium, and magnesium. These are important because deficiencies reduce growth while excessive nutrients can inhibit adequate bloom and growth set. Physical and chemical parameters change during the ripening process, and these parameters are of high commercial importance because they affect the quality and shelf life of the finished product. Physical parameters in olives include yield point force and total deformation energy. Chemical parameters in all types of edible oils include moisture, oil content, sugar content, maturity index, fatty acid composition, phenols, tocopherols, and sterols. The established methods for measuring these parameters are time-consuming, expensive, and impractical for measuring large amounts of samples. There have been studies documenting the feasibility of measuring these parameters using NIR spectroscopy. While results vary from study to study, there is no question that NIR spectroscopy has the potential to replace laborious and often expensive wet chemistry methods to measure these parameters successfully. Possibilities available from current NIR spectroscopic instruments include hand-held instruments for field measurements, benchtop laboratory instruments, and online instruments as the raw material is fed for pressing. It is important to incorporate both a wide range of chemical composition variability and proper sample homogenization to create accurate calibration models for any parameter.
Paste, Mash, and Extractable Material Testing
All edible oil manufacturing begins with the preparation of the raw material to make it suitable for pressing. Exact preparation varies depending on the material used but all consist of material stripping and cleaning. Cotton seeds must be stripped of their lint and dehulled. Corn kernels must undergo milling to separate the germ. Stripped seeds and nuts are ground into coarse meal to increase the surface area. Olives are crushed into paste form to tear the flesh cells to facilitate the release of oil from the vacuoles. The next step is to separate the oil from the rest of the components. For seeds and nuts, the material is heated and fed continuously into a screw press, allowing the oil to be squeezed out and recovered. After the initial oil is recovered from the screw press, the remaining cake is processed by solvent extraction to attain the maximum yield. Evaporated solvent is often collected for reuse using a stripping column. The process for olives is slightly different and has evolved over time. Older olive oils facilities feed the olive paste into a press in a similar fashion to other oils, except the paste is not heated, hence the common terms “first press” and “cold press.” The extraneous material that is leftover from pressing is known as pomace. Newer olive oil facilities use centrifuges for the same purpose to separate oil, water, and solids separately. Most of the time, the oil coming out of a first centrifuge is further processed to eliminate any leftover water and solids by a second centrifuge. The oil is then tanked or barreled, and gravity will separate any leftover material in a process known as racking. As is the case with raw material analysis, moisture, oils, sugars, and fat are important to measure during the process of manufacturing edible oils. The optimal crushing of the raw material is important as well as choosing the correct parameters for the screw press or centrifuges. Pomace testing of fat and oils can help determine if the optimum extraction yield is happening because excess oil in the pomace results in loss of product and reduced profits. NIR spectroscopy has been used for monitoring these parameters to optimize the yield of oil from the raw materials.
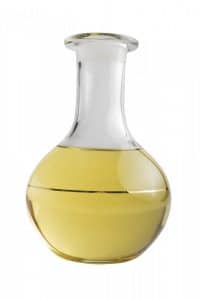
Storage and Oxidation
Once edible oil is produced, oxidation is a deterrent to product quality. Oils that are rich in polyunsaturated fatty acids are susceptible to the formation of peroxides and hydroperoxides after exposure to light, heat, and oxygen. Oils higher in oleic acid, such as linoleic and linolenic acids, are less susceptible to oxygen. Therefore, determination of fatty acid profiles is an essential quality control measurement in edible oils. Parameters to measure oxidation that has occurred are peroxide value for primary oxidation and anisidine value for secondary oxidation. NIR spectroscopy is a proven method for measuring fatty acids to determine the potential for oxidation and parameters that determine if oxidation has occurred in edible oil.
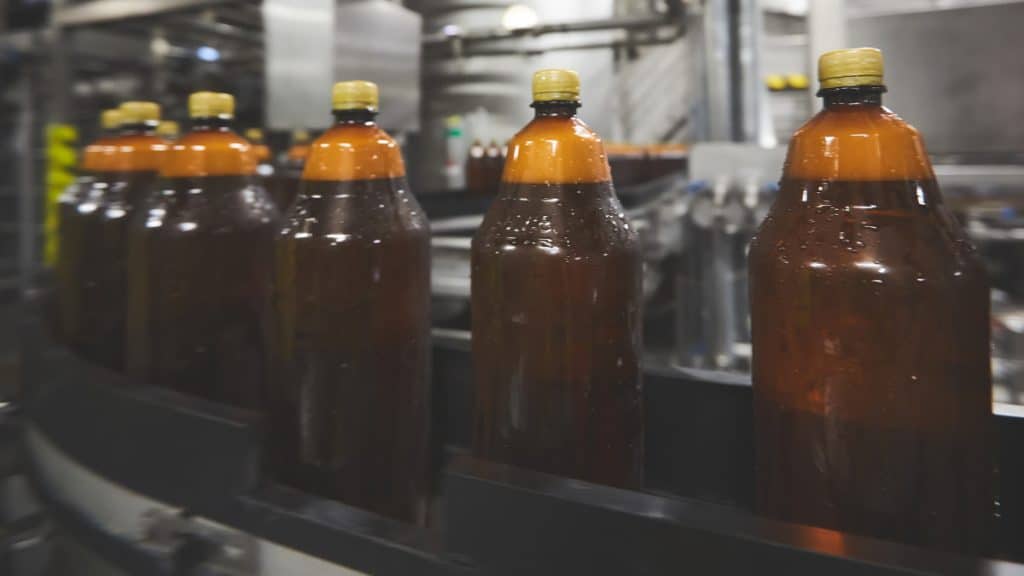
Adulteration and Food Fraud

Adulteration and food fraud are major problems for edible oil producers and many other companies in the global food industry. Food fraud is defined as the intentional act of substituting, adding, tampering of food products as well as misrepresentation of food, food ingredients, and food packaging. It is often done for economic purposes, and in the case of edible oils, it usually consists of adulterating higher quality oil with cheaper components. This is especially true in the case of extra virgin olive oil, which is strictly regulated for quality parameters and is much more expensive than other classes of olive oil. Palm oil is another expensive edible oil and demand for it is projected to grow in coming years, increasing the likelihood of adulteration. Another form of adulteration is a misrepresentation of geographical origin, again very prevalent in the case of olive oil. Genetic engineering has become a big part of the food industry, but there is some resistance in certain countries to consuming these food products. Representing a product as non-transgenic when it is transgenic can be another form of adulteration. Using such a technique like NIR spectroscopy to measure adulterants presents new and evolving challenges as the types and amounts of adulterants are constantly being changed by those adding them. To make NIR spectroscopy a feasible long-term tool for detecting food fraud, models must be kept up to date by adding data including new types of adulterants.
Process Analytical Technology (PAT) & Online Measurements
Process Analytical Technology is a framework for innovative process manufacturing and quality assurance. Critical points and parameters during manufacturing of a product are defined, and the process is designed in a way that such points and parameters can be measured using analytical tools and instruments for real-time process feedback and control. Such instruments must be able to measure online and in a non-invasive manner. Many vendors have developed instruments that can measure multiple points in a process with a single instrument, usually using optical fibers and probes. PAT has become an important part of pharmaceutical manufacturing and is beginning to acquire a hold in the food industry. One such analytical tool with great potential for use in PAT is NIR Spectroscopy.
There are significant challenges to implementing PAT in an edible oils manufacturing environment. NIR spectroscopy has been proven as a useful tool for measuring parameters of interest in edible oils measurement. Vendors are coming up with new and innovative ways to make online measurements a feasible solution for companies. Advances such as improved fiber-optics, in-situ sampling, a transition to integrated automation, improved data management systems, and communication systems in the Internet and Cloud age have all contributed to implementing PAT. The edible oil and food industries also present particular challenges due to natural product variability. In the case of pharmaceuticals and chemicals, the manufacturing process is usually conducted in a controlled environment with constituents that rarely show variability in spectral data over time. For foods and particularly agricultural products, there can be marked differences in products due to many factors, such as temperature variability, seasonal variation, differences in soil and nutrients, and different breeds of the same product. Such differences can create variability in spectral data that must be incorporated into calibration models for when calibrating NIR spectrometers and other analytical PAT tools. This is known as making models “robust” and often requires a larger and more incorporative sample set to achieve the desired results.
Feasibility studies have been conducted for measuring edible oil parameters online as well as in the laboratory. Results have been good and show that online measurements are a feasible tool for edible oils analysis using PAT. Full adoption of PAT in the food industry will require a collaborative effort from process engineers, food scientists, and other contributors to provide the industry with a manufacturing framework for the 21st century.
References
Manufacturing Process of Edible Oil – KMEC Engineering
http://www.oilmillmachinery.net/manufacturing-process-of-edible-oil.html
Making Olive Oil – Olive Oil Source
https://oliveoilsource.com/page/extraction-process
Rapid Determination of Crucial Parameters for the Optimization of Milling Process By Using Visible/Near Infrared Spectroscopy on Intact Olives and Olive Paste – Giovenzana, Beghi, Civelli, et al., Italian Journal of Food Science., Vol. 29, 2017
http://www.chiriottieditori.it/ojs/index.php/ijfs/article/view/560
Determination of In-Shell Peanut Oil and Fatty Acid Composition Using Near-Infrared Reflectance Spectroscopy – Sundaram, Kandala, Holser, et al., J Am Oil Chem Soc (2010) 87:1103-1114
https://link.springer.com/article/10.1007%2Fs11746-010-1589-7
Determination of Omega-3 Fatty Acids in Fish Oil Supplements Using Vibrational Spectroscopy and Chemometric Methods – Bekhit, Grung, Mjos, Applied Spectroscopy, Volume 68, Number 10, 2014
http://journals.sagepub.com/doi/10.1366/13-07210
Rapid FT-NIR Analysis of Edible Oils for Total SFA, MUFA, PUFA, and Trans FA with Comparison to GC – Mossoba, Azizian, Tyburczy, et al., J Am Oil Chem Soc (2013) 90:757-770
https://link.springer.com/article/10.1007%2Fs11746-013-2234-z
Near and Mid Infrared Spectroscopy and Multivariate Data Analysis in Studies of Oxidation of Edible Oils – Wojcicki, Khmelinskii, Sikorski, Sikorska, Food Chemistry 187 (2015) 416-423
https://www.sciencedirect.com/science/article/pii/S0308814615005920
Monitoring PV in Corn and Soybean Oils by NIR Spectroscopy – Yildiz, Wehling, Cuppett, JAOCS, Vol. 79, no. 11 (2002)
https://link.springer.com/article/10.1007/s11746-002-0608-1
Nontargeted, Rapid Screening of Extra Virgin Olive Oil Products for Authenticity Using Near-Infrared Spectroscopy in Combination with Conformity Index and Multivariate Statistical Analysis – Karunathilaka, Fardin Kia, Srigley, Chung, Mossoba, Journal of Food Science, Vol. 81, Nr. 10, 2016
https://pubs.acs.org/doi/abs/10.1021/jf4000538
Classification and Quantification of Palm Oil Adulteration Via Portable NIR Spectroscopy – Basri, Hussain, Bakar, et al., Spectrochimica Acta Part A: Molecular and Biomolecular Spectroscopy 173 (2017) 335-342
https://www.sciencedirect.com/science/article/pii/S1386142516305455
Process Analytical Technology for the Food Industry -O’Donnell, Fagan, Cullen, et al., Springer, Food Engineering Series (2014)
Commercial Reference
The post Edible Oils appeared first on NIR-For-Food.
]]>The post Meat appeared first on NIR-For-Food.
]]>The post Meat appeared first on NIR-For-Food.
]]>The post Non-Alcoholic Beverages appeared first on NIR-For-Food.
]]>Introduction
 The global non-alcoholic beverage market was recently valued at $967.3 billion in 2016 and is expected to grow at a CAGR of 5.8% over the next eight years. Segments of this market include carbonated soft drinks, fruit beverages, functional beverages, sports drinks, and bottled water. Increasing awareness of obesity and overall health concerns are expected to trigger growth in the functional beverage and bottled water segments while limiting demand for carbonated soft drinks. Likewise, the global coffee market is expected to grow at a CAGR of 5.5% over the same period. Coffee is the highest consumed beverage in developed countries and is segmented based on many factors, including source type (Arabica, Robusta, and Liberica), flavored and non-flavored, product types such as whole-bean, powdered, instant, and others, and caffeinated and non-caffeinated. Both fruit beverages and carbonated soft drinks are sugar (or for some carbonated drinks – artificial sweetener) based and encompass a wide variety of flavors and consumer choices. Much attention has been paid to the detection of the quality and safety of liquid foods because of their various raw materials. This is especially true for fruit beverages and coffee. Certain types of liquid foods are very perishable.
Along with processing techniques like drying, heating, cooling, freezing, and pasteurizing, there is also a need for rapid and cost-effective methods to analyze and classify quality, especially when considering a large amount of variability of liquid foods in the market. Moreover, consumer awareness of quality assurance amongst brands is a significant factor in consumers’ decisions to purchase non-alcoholic beverages. The implications of poor product quality spreading in today’s social media environment, as well as the financial consequences of a product recall, can be devastating to a company’s bottom line. Traditional methods for analyzing liquid foods include HPLC, GC, wet chemistry methods, and sensory analysis. These methods are time-consuming and expensive, especially when applied in an online setting. Developing rapid, non-invasive, cost-effective, and environmentally sound methods for quality testing has become a priority for non-alcoholic beverage manufacturers. One such method with potential for both laboratory and industrial testing of non-alcoholic beverage products is NIR spectroscopy.
Process Analytical Technology (PAT) & Online Measurements
Process Analytical Technology is a framework for innovative process manufacturing and quality assurance. Critical points and parameters during manufacturing of a product are defined, and the process is designed in a way that such points and parameters can be measured using analytical tools and instruments for real-time process feedback and control. Such instruments must be able to measure online and in a non-invasive manner. Many vendors have developed instruments that can measure multiple points in a process with a single instrument, usually using optical fibers and probes. PAT has become an important part of pharmaceutical manufacturing and is beginning to acquire a hold in the food & beverage industry. One such analytical tool with great potential for use in PAT is NIR Spectroscopy.
There are significant challenges to implementing PAT in a beverage manufacturing environment. NIR spectroscopy has been proven as a useful tool for measuring parameters of interest in edible oils measurement. Vendors are coming up with new and innovative ways to make online measurements a feasible solution for companies. Advances such as improved fiber-optics, in-situ sampling, a transition to integrated automation, improved data management systems, and communication systems in the Internet and Cloud age have all contributed to implementing PAT.
The beverage and food industries also present particular challenges due to natural product variability. In the case of pharmaceuticals and chemicals, the manufacturing process is usually conducted in a controlled environment with constituents that rarely show variability in spectral data over time. For foods and particularly agricultural products, there can be marked differences in products due to many factors, such as temperature variability, seasonal variation, differences in soil and nutrients, and different breeds of the same product. Such variability is especially significant to account for when performing coffee analysis. Such differences can create variability in spectral data that must be incorporated into calibration models for when calibrating NIR spectrometers and other analytical PAT tools. This is known as making models “robust” and often requires a larger and more incorporative sample set to achieve the desired results.
Calibration studies have been conducted for measuring parameters in non-alcoholic beverages on-line as well as in the laboratory. Results have been good and show that on-line measurements are a feasible tool for edible oils analysis using PAT. Full adoption of PAT in the non-alcoholic beverages industry will require a collaborative effort from process engineers, food scientists, and other contributors to provide the industry with a manufacturing framework for the 21th century.
References
Nonalcoholic Beverage Market Analysis By Product (CSD, Fruit Beverages, Bottled Water, Functional Beverages, Sports Drinks), By Distribution Channel, And Segment Forecasts, 2018-2025
https://www.grandviewresearch.com/industry-analysis/nonalcoholic-beverage-market
Encyclopedia of Occupational Health and Safety, Fourth Edition, Chapter 65 – Beverage Industry
http://www.madehow.com/Volume-2/Soft-Drink.html
How Products Are Made, Volume 2 – Soft Drink
http://www.madehow.com/Volume-2/Soft-Drink.html
Quality Analysis, Classification, and Authentication of Liquid Foods by Near-Infrared Spectroscopy: A Review of Recent Research Developments – Wang, Sun, Pu, and Cheng, Critical Reviews in Science and Nutrition, 2017, Vol. 57, No. 7, 1524-1538
https://www.tandfonline.com/doi/pdf/10.1080/10408398.2015.1115954
Process Analytical Technology for the Food Industry -O’Donnell, Fagan, Cullen, et al., Springer, Food Engineering Series (2014)
Commercial References
The post Non-Alcoholic Beverages appeared first on NIR-For-Food.
]]>