The post Beans Analysis appeared first on NIR-For-Food.
]]>Introduction
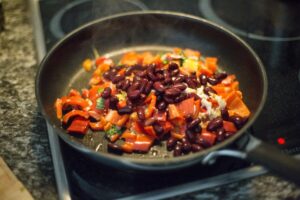
Beans are a valuable food product for both humans and animals. They are the seeds of one of several genera of the flowering plant family Fabaceae. Fabaceae is the third largest land plant by number of species with nearly twenty thousand known species. Beans are valued for both their health benefits and long shelf-life. They can be cooked in many different ways such as boiling, frying, and baking. There are numerous varieties grown all over the world that all have distinct features, textures, and flavors. Some of the most popular beans include green beans, lima beans, kidney beans, black beans, chickpeas, and soybeans. The popularity of beans is due to being affordable, easily transportable due to long shelf-life, and high nutritional content. Beans are a major source of protein, dietary fiber, carbohydrates, minerals, and vitamins. They offer high protein and amino acid content while being lower in calories and saturated fat than many high protein sources, such as meat and dairy products. Studies have shown that components in beans can act as antioxidants, anti-inflammatory agents, and can improve heart health. Other potential health benefits include reduction in blood sugar levels, lower blood pressure, improved gut health, and having fiber and healthy starches which can help food eaters feel full, helping to prevent overeating and aiding in weight loss. Growing and harvesting beans is relatively simple and the process is similar for most types of beans. One exception to this is green beans, which are best harvested when immature and when the pods are bulging past their peak. Properly dried beans are shipped all over the world and do not need to be refrigerated for a long period of time if the beans are to be frozen before shipping. They can be sold dry as is, canned, or processed into various products. Some examples of processed bean products include baked beans, bean pastes, puffed snacks, refried beans, rehydrated beans, and bean flours. There is an increasing demand for beans all over the world due to many factors, including higher consumer health awareness of plant based diets and a need for food with long shelf-life due to the COVID-19 pandemic. Consumers are looking for ways to replace less healthy meat and dairy products and beans is an ideal food type for doing that. With demand continuing to grow and research moving forward at a rapid pace, there is a need for new testing methods to meet the challenges of optimizing bean breeding, growing, harvesting, and processing. Traditional methods are often expensive, time-consuming, and impractical for use on a large scale. One method which has shown potential for measuring parameters of interest in beans that is fast, non-invasive, and able to be implemented for large-scale testing is NIR spectroscopy.
Analytes
- Protein
- Moisture
- Starch
- Fat/Oil
- Tannins
- Vicine
- Convicine
- Total polyphenols
- Starch
- Lipids
- Ash
- Carbohydrates
- Total dietary fiber
- Seed weight
- Hydration capacity
- Alcohol insoluble solids
- Dry matter
- Sensory attributes
- Amylose
- Calcium
- Magnesium
- Germination time
- Water content
- Ascorbic acid
- Total isoflavones
- Mineral and protein content based on contrasting tannins
- Discrimination between arabica and robusta green coffee beans
- Coffee roasting levels
Summary of Published Papers, Articles, and Reference Materials
Application of Infrared Spectroscopy for The Prediction of Nutritional Content and Quality Assessment of Faba Bean (Vicia faba L.)
 There is increasing demand for functional food products that have the potential to provide health benefits. Modern consumers are more connected than ever to information about nutritional content and health benefits. One food that has growing consumer interest and demand is faba bean. Faba bean is one of the world’s oldest cultivated crops and is also known as broad bean and fava bean. The high levels of antioxidant and phenolic compounds in faba beans are linked to numerous health benefits, such as protection against radicals, antihypertensive benefits, and anticancer activity. Traditionally consumed in the Middle East and Southeast Asia, production of faba beans has steadily increased in many developed countries over the last few decades. The COVID-19 pandemic has also fueled increased demand for faba beans due to increasing health awareness, desire for immune system strengthening, and the long shelf-life of faba beans which enables both exporting and storage for consumers. Increased demand and production have created a need for methods to assess the nutritional quality and bioactive compounds in faba beans. Traditional methods for analyzing parameters of interest are often expensive, time-consuming, require the use of toxic chemicals and solvents, and are impractical for implementing for large-scale testing. One method that has been extensively studied for measuring nutritional and bioactive components in faba beans is NIR spectroscopy. NIR spectroscopy has the advantages of being fast, non-invasive, requiring little or no sample preparation, the ability to measure multiple parameters with a single scan, and can be implemented for large-scale testing. Mid-infrared (MIR) spectroscopy has been studied as well and while it is not as well-suited for the quantitative measurement of parameters of interest in faba beans as NIR, it does have a larger array of absorption peaks for a range of chemical bonds, making it a powerful tool for analyzing certain kinds of molecular changes in faba beans and other foods. This review paper discusses and analyzes studies that have been performed to analyze faba beans using both NIR and MIR spectroscopy.
NIR spectroscopy has historically been the dominant form of infrared spectroscopy used for food analysis due to low instrumentation cost, high signal-to-noise ratio, and greater penetration into the sample matrix due to the longer wavelengths used. Shortwave NIR spectroscopy can penetrate centimeters into a sample and can even be used for transmission through certain solids, such as whole grains. Longwave NIR spectroscopy has shorter penetration and is better suited for reflectance surface analysis of homogenous samples. Technological advances in NIR spectrometers have also enabled their use as both a portable instrument and on-line process measurement tool. The term proximate nutritional composition refers to broad classes of macronutrients that compose the majority of food. Some of these include moisture, protein, starch, ash, oil, crude fat, and crude fiber. NIR spectroscopy has been examined for the determination of numerous proximate nutritional composition parameters in faba beans as well as for discrimination analysis of both varieties and growing locations, leaf analysis, and root analysis. Shown below is a list of reviewed application studies for various parameters in faba beans.
Analyte Matrix Accuracy
| Protein Milled Seed | RMSE 0.56% | R² 0.96 |
| Protein | Not Reported CV 1.13% | |
| Protein Milled Seed | RMSECV 0.34% | |
| Whole Seed | RMSECV 0.60% | |
| Moisture Milled Seed | RMSE 0.30% | R² 0.93 |
| Starch Milled Seed | RMSECV 0.72% | R² 0.86 |
| Whole Seed | RMSECV Not Reported | |
| Oil Milled Seed | RMSECV 0.17% | |
| Whole Seed | RMSECV 0.18% | |
| Tannins Whole Seed | SEP 0.54% | |
| Vicine and Convicine Flour | SECV 0.094% | |
| Total Polyphenols Milled Seed | RMSECV 0.40 mg/g | |
| Whole Seed | RMSECV 0.42 mg/g | |
| Glycine Betaine Leaflets | RPD 1.81 |
 Protein and moisture are two of the first NIR spectroscopic applications ever developed for food products and the first protein study shown above as well as the moisture study were conducted in 1978. Two separate models were developed: protein using the ratio of absorption at 2180 nm to absorption at 2100 nm and moisture using the ratio of absorption at 1940 nm to absorption at 1800 nm. Both models showed a correlation coefficient higher than 0.90 and considering the limited instrumentation available at the time, prediction error and correlation are excellent. Another study used a limited sample set of fifty samples to build a calibration model for protein and showed good correlation with validation predictions showing a standard deviation between values obtained from the NIR calibration model and reference Kjeldahl method of 0.28% and a coefficient of variability of 1.13%. Other protein studies included a study that determined protein content of faba beans in an attempt to optimize crop combinations of various plants to obtain the greatest protein yield per acre and a study that compared determining protein in ground faba bean powder with determining protein in intact seeds. Results and correlation were far better for the ground powder than intact seeds, with the powder model showing a correlation coefficient of 0.94 and a RMSECV of 0.34% and the intact seed model showing a correlation coefficient of 0.76 and a RMSECV of 0.60%. The higher error in the intact seed model is almost surely due to greater heterogeneity and light penetration of only the outer seed surface.
Starch is another important parameter in not only faba beans but all grain and legume products that plays an important role in determining overall nutritional quality. One study analyzed determining starch in ground faba beans with over two hundred samples, showing reasonable results of a correlation coefficient of 0.86 and RMSECV of 0.72%. The same study also analyzed oil content in both ground and whole faba beans. Results were similar for both types of samples with correlation coefficients of 0.66 and nearly identical RMSECV of 0.17% and 0.18%. Considering the range of values for oil was small, from 0.48% to 1.99%, these results are reasonable and the models are considered adequate for screening purposes. Polyphenols are one of the major groups of phytochemicals in faba beans. They are known for their health benefits, especially for positive cardiovascular effects. NIR spectroscopy has been examined to predict the total polyphenol content in ground faba bean with a correlation coefficient of 0.79 and RMSECV of 0.40 mg/g. These results show potential to replace the traditional reference method of the Folin-Ciocalteu assay, which is time-consuming and expensive to implement. Tannins are a complex group of polyphenols that are considered anti-nutritive because they can reduce the efficiency of nutrient uptake and metabolism. It is important to consider tannin concentration when developing new faba bean varieties and one study examined using NIR spectroscopy for this purpose. Sixty whole faba bean samples were used with a range from 0.01% to 7% w/w (although no samples from 1% to 3.5% were in the calibration) and good correlation was obtained with a correlation coefficient of 0.93 and SEP of 0.54%. Tannins are largely contained in the seed coat and this likely explains the strong correlation. Vicine and convicine are alkaloid glycosides that can cause problems if consumed by individuals with a certain type of blood enzyme. Although the concentration of these compounds in faba beans is typically low at around 0.6% to 0.9% w/w, one successful study reported good correlation in faba bean flour with a correlation coefficient of 0.968 and an RMSECV of 0.094%. It must be noted that calibrations of low concentration of micronutrients in faba beans and other foods may be actually measuring a secondary correlation of the micronutrients with certain macronutrients. While such a correlation is acceptable, it must be examined carefully and properly validated to determine if the correlation is real or not.
Other potential applications using NIR spectroscopy in faba beans include authentication of variety and growing area, leaf analysis of carbon and nitrogen, and root analysis. Mid-IR spectroscopy has also been examined and has shown good potential for a number of applications. It is better suited than NIR for molecular analytes like protein secondary structure, polymer characterization, starch crystallinity, and starch granular architecture. Mid-IR is also good for certain types of discrimination analysis, such as different colors of beans, cultivars, growing years, and high and low tannin varieties. While Mid-IR does contain a larger array of specific absorption peaks for a range of functional groups, the low light penetration, need to use Attenuated Total Reflectance (ATR) to increase signal amplitude, not being well-suited for both portability and on-line applications, and difficulty in use for quantitative measurements does limit it use. As more applications using infrared spectroscopy are studied and developed, there will be increased use of both NIR and Mid-IR spectroscopy to analyze faba beans and many potential applications could use both methods in conjunction with each other.
Near-Infrared Spectroscopy (NIRS) Applied to Legume Analysis: A Review
Legumes are a very important food in the human diet. They are known for their health benefits and high nutritional value. About twenty types of legumes are used as dry grains for human nutrition in many parts of the world and are sources of complex carbohydrates, protein, dietary fiber, vitamins, and minerals. These include common beans, peas, chickpeas, and lentils. Consumption of these products is increasing every year and there is a need to develop methods for analyzing parameters of interest in legumes. Conventional methods for determining nutritional composition in legumes are time-consuming, expensive, often require the use of toxic chemicals and solvents, require sample destruction, and are impractical for implementing for large-scale testing. One method that has been studied extensively for replacing traditional methods is NIR spectroscopy. While NIR spectroscopy does require collecting spectra of samples, performing reference tests, and building chemometric models that correlate the NIR spectra to parameters of interest, once this process is completed the advantages are enormous. NIR spectroscopy is fast, non-invasive, requires little or no sample preparation, does not destroy samples, and has the ability to measure multiple parameters with a single light scan once calibrations are made. There have been a number of application studies to determine the feasibility of using NIR spectroscopy as an analytical tool for analysis of legumes and many of these studies are reviewed here. Shown below is a list of application studies for various types of legumes.
Faba Bean
Sample Parameter Accuracy
| 244 milled & intact seeds Protein (Milled) | RPD = 4 | R² = 0.97 |
| Protein (Whole) | RPD = 2 – 2.5 | |
| Starch (Milled) | RPD = 3 | R² = 0.93 |
| Starch (Whole) | RPD = 2 – 2.5 | |
| Polyphenols (Milled) | RPD = 2 – 2.5 | |
| Oil | RPD = 2 – 2.5 | R² = 0.89 |
This application study for analyzing faba beans using NIR spectroscopy showed excellent results for protein in the milled samples. RPD is defined as Residual Prediction Deviation, the standard deviation of observed values divided by the Root Mean Square Error of Prediction (RMSEP). It is a metric of model validity and is considered more objective than RMSEP as well as more easily comparable across different model validation studies. Protein in intact seed samples showed lower correlation and this is most likely due to large differences in the size of the particles and the fact that milled samples are more homogenous. The starch model for milled samples also showed good predictive capacity. Whole seed models for starch, milled seeds for polyphenols, and oil did not show good enough results for practical use.
Soybean
Sample Parameter Accuracy
| 153 whole grains Crude Protein | R² = 0.97 | RMSEC = 0.61 | RMSEP = 0.76 |
| Fat | R² = 0.97 | RMSEC = 0.36 | RMSEP = 0.41 |
| 80 samples Total Dietary Fiber | R² = 0.80 | RMSEC = 1.7 | RMSEP = 0.86 |
The two application studies shown here determined crude protein, fat, and total dietary fiber in soybean. Results for protein and fat were excellent and demonstrate the potential of NIR spectroscopy to replace traditional reference methods for measuring these parameters in soybeans. The model for total dietary fiber was less accurate but still has an acceptable correlation coefficient and reasonable error in predictions, indicating that this model could be used for screening purposes.
Chickpea and Pea
Sample Parameter Accuracy (Milled/Whole)
| 156 pea samples Crude Protein | R² = 0.99/0.94 | SECV = 0.27/0.57 |
| Moisture | R² = 0.90/0.51 | SECV = 0.19/0.39 |
| 151 chickpeas Moisture | R² = 0.77/0.84 | SECV = 0.36/0.31 |
| Ash | R² = 0.77/0.72 | SECV = 0.19/0.39 |
| Seed Weight | R² = 0.89/0.88 | SECV = 1.50/1.50 |
| Hydration Capacity | R² = 0.82/0.90 | SECV = 3.33/2.65 |
| Percentage of Husk | R² = 0.64/0.74 | SECV = 5.46/5.05 |
| Peeling Efficiency | R² = 0.59/0.80 | SECV = 1.23/0.85 |
| Cooking Quality | R² = 0.53/0.71 | SECV = 2.93/2.40 |
The calibration models for pea showed excellent correlation for both types of samples for crude protein and good correlation for milled peas but poor correlation in whole peas for moisture. In general, the chickpea calibration models were better for the ground samples when measuring chemical composition but better for the whole samples when measuring physical or functional properties. The grinding of the samples makes them more homogenous, making the chemical properties more easily determined while likely causing a change in the physical properties.
Fresh and Frozen Peas
Sample Parameter Accuracy (Fresh/Frozen)
| 114 samples Alcohol Insoluble Solids | R² = 0.96/0.84 |
| Dry Matter | R² = 0.97/0.96 |
| Sensory Attributes | R² = 0.97/0.97 |
| Firmness of Flesh | R² = 0.83 (Fresh) |
| Sweet Flavor | R² = 0.82 (Fresh) |
| Strength of Flavors | R² = 0.76 (Fresh) |
| Brightness of Color | R² = 0.89 (Fresh) |
Results from this study were good and demonstrated the ability of NIR spectroscopy to measure chemical and physical indicators of maturity in peas. Decent correlation was attained for sensory attributes for texture and flavor. There is potential to use the methods developed here for on-line sorting of peas by degree of maturity in a pea processing factory.
Dry Pea Flour
Sample Parameter Accuracy
| 123 samples Amylose | R² = 0.95 |
| Resistant Starch | R² = 0.76 |
| Digestible Starch | R² = 0.80 |
| Total Starch | R² = 0.88 |
This application study used Multi-Linear Regression (MLR) calibration models to predict amylose, resistant starch, digestible starch, and total starch in dry pea flours. Values predicted by the calibration models were in good agreement with the laboratory reference values for the parameters of interest, proving the feasibility of the correlations and calibration models.
Common Bean
Sample Parameter Accuracy (Dispersive/FT-NIR)
| 54 genotypes (White and Colored) Protein | R² = 0.96-0.97 |
| Starch | R² = 0.95-0.96 |
| Amylose | R² = 0.94-0.95 |
This study compared two different types of NIR spectrometers for analyzing protein, starch, and amylose in different genotypes of common bean. Correlation was higher and predictive performance was better for models using an FT-NIR spectrometer than for models using a dispersive spectrometer.
Sample Parameter Accuracy
| 121 samples Moisture | R² = 0.94 | SEP = 0.39 |
| Starch | R² = 0.88 | SEP = 0.9 |
| Protein | R² = 0.94 | SEP = 0.56 |
| Fat | R² = 0.74 | SEP = 0.13 |
An independent validation set was used to confirm the validity of the models and there was good agreement between the predicted values from the NIR calibrations and reference methods, especially for starch and protein.
Sample Parameter Accuracy (Whole/Milled)
| 90 seed coats Dietary Fiber | SEP = 1.23/2.60 |
| Uronic Acids | SEP = 1.40/1.49 |
| Ash | SEP = 2.03/3.49 |
| Calcium | SEP = 2.40/3.57 |
| Magnesium | SEP = 1.33/1.50 |
The models developed in this application study showed sufficient results for screening of ash and calcium using NIR spectroscopy. Samples scanned were ground husk and all models with the exception of uronic acids, which showed very poor correlation, could be used for rough screening and classifying seed husks based on the parameter of interest. All studies discussed here have shown the potential to use NIR spectroscopy as a replacement for traditional expensive and time-consuming reference methods for determining parameters of interest in legumes.
https://www.ijeit.com/Vol%208/Issue%204/IJEIT1412201810_05.pdf
Near-Infrared Spectroscopy and Aquaphotomics for Monitoring Mung Bean (Vigna radiata) Sprout Growth and Validation of Ascorbic Acid Content
Mung bean is an important food commodity, especially in Asia. It is a cheap protein source in cereal based diets and can be either eaten whole, cooked, or fermented or milled into flour. Mung bean flour is used to make multiple products, including noodles, breads, and various bakery products. In addition to significant amounts of protein, mung bean also contains fiber, soluble fiber, potassium, vitamins, and minerals. Phosphorous content is significant and the molecules come in the form of phytate, an anti-nutritive component that binds with minerals and thus creates insoluble compounds. However, processes such as germination, soaking, fermentation, and cooking have all been proven to reduce these anti-nutritive effects of phytate. During sprouting, many nutritional compounds are formed and one significant compound is ascorbic acid, better known as Vitamin C. Ascorbic acid is significantly affected by the germination time. Initial content has been reported as low as 3 mg/100 g and the final content after germination can go as high as 98 mg/100 g. There are several quality components that can be used to determine germination time in addition to ascorbic acid, such as water content, pH, and conductivity. However, determining these components in sprouting mung beans is time-consuming, requires sample destruction, uses toxic chemicals and solvents for some tests, and is impractical for large-scale testing. NIR spectroscopy was examined as a method for determining germination time and ascorbic acid content in mung bean. Using NIR spectroscopy is often a correlative method, meaning that while the exact composition of the sample may not be measured after the creation of calibration models, a measurable component (such as water content) that is correlated with other parameters of interest (such as germination time and ascorbic acid) can indirectly determine the parameters of interest. In such cases, models must be carefully examined and validated to ensure proper correlation. One such method for doing this is known as aquaphotomics, which characterizes complex aqueous systems through changes in the hydrogen bonding network of water molecules from 1300 nm to 1600 nm. A simpler explanation is that low concentration components that are below the threshold of detection for NIR spectroscopy can in fact be measured indirectly if they cause a change in water molecules, which are highly absorbing of light in the near-infrared range.
Mung beans from Thailand were procured for the study. Six separate 400 g packages were homogenized and separated into twenty-one different holders, each containing about 100 g of beans. Germination time was set for zero hours to one hundred twenty hours. A standard soaking, draining, and incubation process with constant temperature and humidity was used for germination. At each desired germination time, the beans in that holder were dried and scanned using an NIR spectrometer. Twenty bean samples from each holder were scanned in triplicate from 900 nm to 1700 nm. After bean sprout scanning, 100 g of each sprout was weighed, mixed with distilled water, crushed, and filtered. The filtrate was divided into portions for reference tests for pH, conductivity, and ascorbic acid content. Another portion was also scanned using the same NIR spectrometer but after placement in a 1 mm quartz cuvette. Water content was determined by drying bean sprouts in an oven. Various pre-processing methods were applied to the spectral data before chemometric analysis. NIR spectra of the bean sprouts were used to create a Linear Discriminant Analysis (LDA) model to classify the germination time of bean sprouts at 24 h intervals. NIR spectra of the filtrate was used with reference values for germination time, water content, and ascorbic acid to create Partial Least Squares (PLS) models correlating the spectra to these parameters of interest. Models used the wavelength range from 1300 nm to 1600 nm.
Whole Beans LDA Classification Based on 24 Hour Intervals of Germination Time
Bean Sprout Extract | 100% Accuracy
| Germination Time (h) | R² = 0.960 | RMSEC = 8.18 |
| Water Content (% | R² = 0.966 | RMSEC = 2.34 |
| Ascorbic Acid (mg/100 g) | R² = 0.962 | RMSEC = 22.9 |
The results of this study show promise for determining germination time, water content, and ascorbic acid in mung bean. However, there was a fair amount of error in the predicted values for these parameters despite the high correlation coefficients. One likely reason for this is that reference tests were only performed for samples every twenty-four hours, creating a large number of samples that likely exhibited spectral differences but had the same reference values for the parameters of interest. Results are likely to improve with more frequent sampling and reference tests. Aquaphotomics analysis did determine a good correlation between water content, germination time, and ascorbic acid content. More work is needed before using these models in a practical setting but the potential was demonstrated to use NIR spectroscopy as a fast and non-invasive method for determining germination time, water content, and ascorbic acid content in mung beans.
Comparison and Application of Non-Destructive NIR Evaluations of Seed Protein and Oil Content in Soybean Breeding
Soybean is a major crop grown worldwide and plays an important role in agricultural production, industrial biofuel manufacturing, and international trade. On average, the dry weight of soybeans contains around 40% protein and 20% oil, with most of the remaining composition containing carbohydrates, minerals, and water. There are a number of reasons why analysis of nutritional components and other important traits is necessary. Breeders need to assess large numbers of breeding materials for multiple traits in a short period of time to select the desired genotypes in breeding populations with complicated variations. Soybean usage is very dependent on seed composition. High oil breeds are used for vegetable oil processing and biodiesel manufacturing, while high protein is preferred for human diet and soy food products. Determining protein and oil composition requires wet chemistry methods such as the Kjeldahl method for protein and the Soxhlet method for oil. While accurate, both methods are time-consuming, expensive, require sample destruction and the use of toxic chemicals, and are impractical for implementing for large-scale testing. NIR spectroscopy was examined as a method for determining protein and oil content. Two separate spectrometers with pre-built calibrations with protein and oil for soybeans were used in the study. One instrument is for laboratory use while the other is portable and can be used in the field. Whole seed samples of sixteen different genotypes were procured for the study. For four of the sixteen genotypes, additional samples were taken from either a different harvesting year or location to examine the variability from different seed sources. Protein and oil content were analyzed using the laboratory NIR spectrometer, portable NIR spectrometer, and wet chemistry methods. In total, seven hundred and sixty soybeans were scanned with the spectrometers.
Laboratory NIR Spectrometer – Correlation with Wet Chemistry Methods
| Protein | R² = 0.977 |
| Oil | R² = 0.960 |
Correlation with the reference methods was excellent when using the laboratory NIR spectrometer but much poorer when using the portable NIR spectrometer. However, this was expected as the laboratory NIR spectrometer used calibrations developed and updated by the manufacturer while the calibrations used for the portable instrument were the original installed calibrations. After analysis of the spectral data, it was determined that both genotype and particle size of the seeds had significant effects on the predictions. After analysis of the variations and bias corrections to the equations used for the calibrations, both correlation coefficients for the protein and oil models for the portable instrument increased to higher than 0.75. Results were validated by predicted values from an additional two hundred and forty samples scanned with the portable instrument. The study showed that the laboratory instrument could be used for quantitative analysis of protein and oil in soybeans while the portable instrument could be used for screening single plants in breeding selection.
Agronomy | Free Full-Text | Comparison and Application of Non-Destructive NIR Evaluations of Seed Protein and Oil Content in Soybean Breeding (mdpi.com)
Use of Near-Infrared Reflectance Spectroscopy for the Estimation of the Isoflavone Contents of Soybean Seeds
There has been increased interest in the composition and physiological functions of food products in recent years as consumers look for healthy and alternative foods in their diet. With this increased interest, it is important for food sellers to obtain and promote food with higher nutritional composition. Isoflavones are one family of compounds found in soybeans that may be associated with lower rates of postmenopausal cancer in women as well as helping to prevent osteoporosis. The traditional method for analyzing isoflavone content is HPLC which is effective, but time-consuming, expensive, requires sample destruction and the use of toxic chemicals, and is impractical for implementing for large-scale testing. NIR spectroscopy was examined for determining isoflavone content in soybeans. Forty-eight soybean samples were procured from different growing areas in Japan for the study. All samples were scanned using an NIR spectrometer from 1100 nm to 2500 nm at 2 nm intervals. After scanning, all samples were milled and the powdered samples were scanned again using the NIR spectrometer. Isoflavone content was determined by HPLC. Individual components of isoflavone were determined as well. Various pre-processing methods were performed on the NIR spectra before chemometric analysis. Multi-Linear Regression (MLR) calibration models were created for total isoflavone and individual components correlating the NIR spectra to parameters of interest. The NIR spectra for thirty-six samples were used as a calibration set and the remaining twelve samples were used for a validation set.
Total Isoflavone
| Intact Samples (mg/100 g) | R² = 0.92 | SEP = 38.51 |
| Powdered Samples (mg/100 g) | R² = 0.85 | SEP = 63.43 |
Results for total isoflavone showed high correlation for the powdered samples and decent correlation for the intact samples. The range of values for the calibration set was from 133.44 mg/100 g of dry weight to 633.42 mg/100 g of dry weight. Independent predictions using the validation set confirmed the validity of the models. Models were also created for the individual isoflavone components and while some of them had high correlation coefficients, it is almost certain that these models are correlating to something besides the individual isoflavone components as the concentration of these parameters is far below the threshold of detection for NIR spectroscopy. Some components had a mean value of less than 10 mg/100 g and the model for these is definitely correlating another parameter which is measurable using NIR spectroscopy. It is possible that the individual components are affecting macronutrient concentration which is then the basis for the correlation to the NIR spectra. However, such an indirect correlation must be examined and validated carefully. This study showed that measuring the total isoflavone content in soybeans is feasible in both intact and powdered samples of soybeans.
Seed Mineral Composition and Protein Content of Faba Beans (Vicia faba L.) with Contrasting Tannin Contents
Faba bean is widely grown around the world and is used as a source of protein in human diets, as fodder and a forage crop for animals, and also has a good ability to fix atmospheric nitrogen. It is also a good source of energy, fiber and minerals. Protein content is high ranging from 24% to 35% of the seed dry matter. Mineral content is especially important because an estimated two-thirds of the world’s population are at risk of deficiency of one or more essential minerals, such as calcium, magnesium, zinc, and potassium. One course of action that has been studied to help address mineral deficiencies in humans is genetic biofortification through plant breeding. The technique involves screening and developing micronutrient rich germplasm, conducting genetic studies, and developing molecular markers to facilitate breeding. While this method is effective, it does require testing that can be expensive, time-consuming, and difficult to implement on a large-scale. One potential way to help facilitate these kinds of studies and tests is to investigate variations in chemical and genetic composition by genotype, growing area, and other environmental factors and then correlate those with an easily measurable macronutrient component. In this study, different faba bean genotypes from different growing areas were investigated for variation of mineral components and protein using NIR spectroscopy and other testing methods to correlate these parameters with contrasting tannin contents. Twenty-five different faba bean genotypes grown at three different locations in Canada during two separate growing seasons were procured for the study. Each location had a different soil type as well. Plot samples were threshed, washed, and ground to a fine powder. Micronutrients were analyzed using the standard method of Inductively Coupled Plasma Mass Spectrometry (ICP-MS). Protein content was determined using an NIR spectrometer with a pre-built calibration for protein. It is known that genotypes that are white-flowered contain low tannins while spotted-flowered contain high tannins. The combination of year and location was considered as “environment” and two different data analysis algorithms were applied. Mixed Model Analysis of Variance (ANOVA) was used to determine variance with genotype as a fixed effect while location, year, and replications nested within the site-year were considered random effects. Principle Component Analysis (PCA) was used to characterize associations among genotypes, mineral elements, and protein. The data analysis indicated that both the seed minerals concentrations and protein were affected by environmental variation and the tannin profile. Specifically, low-tannin white-flowered faba beans were found to be rich in calcium, magnesium, iron, and zinc, which are minerals that are known to be deficient in the human diet for many people. A higher protein content was also found in these beans. The high heritability observed for mineral concentrations in the seeds suggest that genetic improvement is possible for these traits. While more study and a deeper examination would be required, this study shows the potential to use NIR spectroscopy as a tool for helping to correlate protein concentration in faba beans with tannin and mineral concentration to assist in genetic breeding.
Robust Prediction Performance of Inner Quality Attributes in Intact Cocoa Beans Using Near-Infrared Spectroscopy and Multivariate Analysis
Chocolate is made from raw cocoa beans that are extracted from the cocoa tree pod and then roasted, fermented, or ground into formation of processed products. It can be formulated into a paste or solid-state from a roasted or ground cocoa and fat combination. Chocolate is typically sweetened with additional sugar and other ingredients, formed into bars, and eaten as confectionery. There are two quality classifications for cocoa beans: bulk cocoa which is considered standard quality and flavor cocoa which is considered high quality. Chocolate manufacturers need to check their incoming cocoa beans to ensure they are high quality. Fat and moisture content are considered the two primary quality parameters in cocoa beans. Current methods for determining quality parameters in cocoa beans are time-consuming, expensive, require the use of toxic chemicals and solvents as well as sample destruction, and are impractical for implementing for large-scale testing. Fat testing is done by the Soxhlet method which is both time-consuming and uses solvents. Moisture testing requires a drying and gravimetric method which takes well over an hour. NIR spectroscopy was examined as a method for determining fat and moisture content in cocoa beans. One hundred and ten bulk cocoa bean samples that were harvested from June to August from the same plantations in Indonesia were procured for the study. Each bulk sample contains around 54 g of intact beans. All samples were scanned using an NIR spectrometer from 1000 nm to 2500 nm with a scan interval of 0.2 nm. Thirty-two scans were collected per reading and averaged into one spectrum per sample. Fat and moisture content were determined for each sample using the standard Soxhlet and gravimetric methods. Various pre-processing methods were applied to the spectral data before chemometric analysis. Partial Least Squares (PLS) calibration models were created correlating the fat and moisture content to the NIR spectra.
| Fat | R² = 0.86 | RMSEP = 0.79 |
| Moisture | R² = 0.92 | RMSEP = 0.41 |
The results indicate that NIR spectroscopy is a feasible method for determining fat and moisture content in cocoa beans. Cross-validation was performed by removing spectra from the calibration models, recalculating the models without those spectra, and then using the new models to predict values from the removed spectra. Predictions were in good agreement with the reference method values which confirms the validity of the models. Before using these models in a practical setting, further study and addition of data would be warranted. Samples from more growing areas and from different harvest seasons would likely improve modeling results. This study shows the potential to use NIR spectroscopy as a faster and cheaper alternative to traditional methods for determining fat and moisture content in cocoa beans.
Rapid Prediction of Moisture Content in Intact Green Coffee Beans Using Near Infrared Spectroscopy
Moisture is a very important quality parameter in green coffee beans and is strictly regulated by most countries that import and export coffee. The safe range for moisture is from 8% to 12.5% based on fresh matter. Moisture below 8% causes shrunken beans and an unwanted appearance. Moisture above 12.5% facilitates fungal and mycotoxin growth as well as the potential for problems during storage and the roasting process. NIR spectroscopy was examined as a method for measuring moisture content in both Arabica and Robusta green coffee beans. Twelve sets of samples were used for the study: Three Arabica species and four Robusta species of different origins for the calibration set and two Arabica species and three Robusta species of different origins for the validation set. NIR diffuse reflectance spectra were collected from all samples from 1000 nm to 2500 nm at 2 nm intervals. Each individual spectrum consisted of the average of sixty-four scans. Three replicates were acquired for each sample and these spectra were averaged as well, resulting in one hundred and eight total spectra of the twelve different samples. Reference values were obtained for moisture and these were used with the NIR spectra to create Partial Least Squares (PLS) calibration models for moisture content.
| Moisture (Full Wavelength Range) | R² = 0.9850 | RMSEP= 0.57% |
| Moisture (Selective Wavelengths) | R² = 0.9743 | RMSEP= 0.77% |
Two sets of PLS calibration models were created: one using the full wavelength range and the other using seven selective wavelengths that were chosen based on the correlation of the full range model. Some of these are moisture absorbing areas of the NIR spectrum and others correlate to organic compounds affected by a change in moisture: 1155 nm, 1212 nm, 1340 nm, 1409 nm, 1724 nm, 1908 nm, and 2249 nm. Prediction results on the validation set using both models proved the feasibility of the measurement. Results were comparable for both models and either could be applied in an on-line setting to determine moisture in green coffee beans.
Reliable Discrimination of Green Coffee Beans Species: A Comparison of UV-Vis-Based Determination of Caffeine and Chlorogenic Acid with Non-Targeted Near-Infrared Spectroscopy
Coffee consumption is increasing every year across the world and adulteration is a common problem in the coffee market. The two types of coffee beans are Arabica and Robusta. Arabica makes up around 58% of global production of coffee while Robusta makes up the remaining 42%. They differ in several aspects such as taxomonic classification, morphology, bean size and color, chemical compounds, and sensory evaluation. There are limitations to visual inspections of the beans because the physical characteristics can vary considerably between species and varieties due to different genotypes and environmental factors. Certain varieties of Arabica also have sensory properties very similar to Robusta, such as mouthfeel and bitterness. The average annual price of Arabica green coffee beans is around $2.51 per kg while the price of Robusta is around $1.63 per kg. The price difference makes substituting Robusta for Arabica enticing and thus there is a problem with adulteration that can also include substituting less desirable varieties from different geographical regions. Both NIR and UV-Vis spectroscopy were examined for discriminating between different species of green coffee beans. UV-VIS spectroscopy has been used as a method to determine caffeine and chlorogenic acid content in coffee beans and in this study, it was used to also discriminate between Arabica and Robusta beans. Seventy-four green coffee beans samples from different locations in Indonesia were procured for the study. The samples were chosen specifically to represent different environmental factors, agricultural practices, and genetic characteristics. They were sourced from thirty-eight different processing facilities during the same harvesting season. Thirty-two samples were Arabica and forty-two were Robusta. Caffeine and chlorogenic acid were determined using UV-VIS spectroscopy by standard methods and procedures. An FT-NIR spectrometer was used to scan all samples from 1000 nm to 2500 nm at 2 nm intervals. Each sample was scanned sixty-four times and the scans were averaged into a single spectrum. This process was repeated three times and the three spectra per sample were further averaged into one spectrum. Various pre-processing methods were applied to the spectral data before chemometric analysis. Linear Discriminant Analysis (LDA) was performed on both the UV-VIS spectra and NIR spectra as a model for discriminating between species. In the case of the UV-VIS spectra, differences in values between species for caffeine and chlorogenic acid were analyzed as well. Results are shown below.
LDA
| UV-VIS | 97.3% Correct Classification |
| NIR | 95.5% Correct Classification |
The results for both sets of spectra show that both methods can be used to discriminate between Arabica and Robusta coffee beans. There was some overlap in caffeine and chlorogenic acid values between the two species, indicating that these values alone cannot be used as a basis for classification. While the results were slightly better using the UV-VIS spectra for discrimination between the two species, it must be noted that UV-VIS spectroscopy is a far more labor intensive method than NIR spectroscopy. UV-VIS requires extensive sample preparation and the use of solvents and standard solutions. By contrast, once a calibration model is created NIR spectroscopy only requires collecting a spectrum for analysis, typically taking around thirty seconds per reading. The results here show the potential to use NIR spectroscopy for classifying Arabica and Robusta coffee beans. Further research should include beans of different species and varieties from different parts of the world.
Application of Detrended Fluctuation Analysis and Yield Stability Index to Evaluate Near Infrared Spectra of Green and Roasted Coffee Samples
The quality of coffee is determined by many factors, such as species, variety, geographic location, and processing method. The physical properties and chemical composition of the final product are all dependent on these factors and thus affect the final price of coffee in the market. Variation can be significant and NIR spectroscopy is a proven method for determining numerous chemical and physical properties in coffee beans as well as discrimination analysis and adulteration detection. Some of these include caffeine, color, roasting conditions, roasting degree, Arabica/Robusta ratio in ground coffee, place of origin, chemical composition of coffee grounds, and sensory properties of beverages. NIR spectroscopy does require the use of chemometric modeling to correlate NIR spectra to parameters of interest. There are numerous multivariate statistical methods that can be used as well as pre-processing techniques that help extract the maximum information from the NIR spectra. Two promising methods which have recently been applied to NIR spectroscopy are Detrended Fluctuation Analysis (DFA) and Yield Stability Index (YSI). DFA is a widely used time series data analysis tool and has been applied in multiple applications such as high-viscosity gad-liquid flows, water contaminant classification, EEG patterns associated with real and imaginary arm movements, air traffic flow analysis, and even for the analysis of NBA basketball games. YSI was developed to measure extremities in a time series for agriculture by measuring the proportion of annual yields being reasonably close to the expected trend value within a given time period. When applied to NIR spectroscopy of coffee spectra at different roasting levels, it should provide information about the stability of the signals. In this study, DFA and YSI applications were introduced on NIR spectra of different coffee samples with varying roasting levels. Fifteen different coffee samples (fourteen Arabica and one Canephora Robusta) were procured from different parts of the world for the study. Before roasting, each sample was scanned using a FT-NIR spectrometer from 12500 cm-1 to 3800 cm-1 at 16 cm-1 resolution. Sixteen scans were collected per reading and averaged into one spectrum. Samples were then divided into three portions and roasted at three separate levels: light, medium, and dark. NIR spectra were then collected for all the roasted samples using the same parameters. Various pre-processing methods were applied to the NIR spectra before analysis. Principle Component Analysis (PCA) was first performed followed by DFA and YSI. PCA was able to successfully show differentiation of the roasting levels after preprocessing when all samples were analyzed together. DFA showed clear discrimination between the green unroasted samples and roasted samples but discrimination was not so clear between different roasting levels. However, DFA was able to discriminate very well between roasting levels within the same group of samples. This is an important distinction because DFA analyzes one spectrum at a time while PCA analyzes the entire data set at the same time. This makes PCA disadvantageous if PCA was used for a new set of samples. The nature of DFA makes it possible to set certain coefficients in the data set as global thresholds for determining if a sample is green, light, medium, or dark roasted. YSI was used to show stability by higher YSI values and the light roast samples were the most stable of all roasting levels. Additional research should focus on the application of DFA in terms of analysis on the effects of other transformation methods of the spectra and to analyze different types of samples to determine the robustness of the method.
The post Beans Analysis appeared first on NIR-For-Food.
]]>The post Beer Analysis appeared first on NIR-For-Food.
]]>Introduction

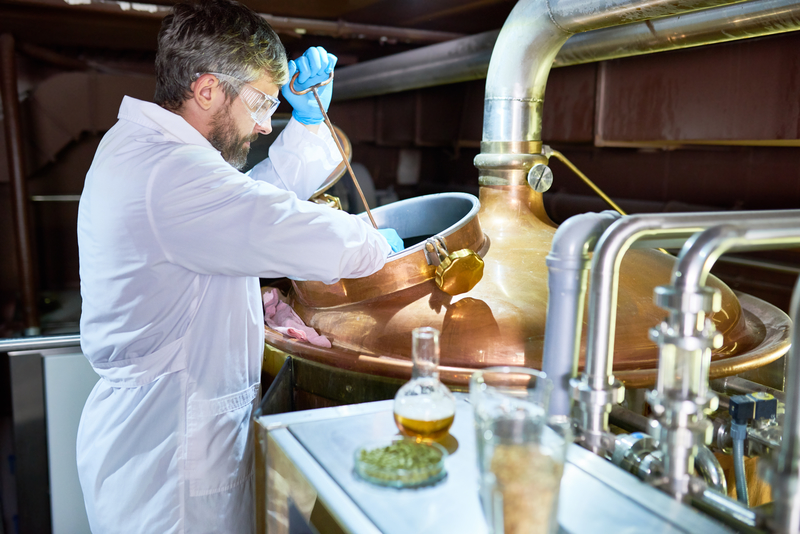
Beer is the world’s most widely consumed alcoholic beverage. Four raw materials are required for beer production: barley, hops, water, and yeast. The beer market has become especially competitive in recent years with the advent of microbreweries, which market their products based on unique recipes, quality, and distinction from the large-scale breweries. The quality of the raw materials has a significant impact on the final product. Before the brewing process begins, characterization of barley, as well as yeast and hops, can help the brewer optimize the process. Process control feedback during brewing, particularly during the malting and fermentation stages, are critical and fundamental for brewing high-quality beer. Feedback on moisture and nitrogen in barley, germination parameters, sugars during mashing, and alcohol and original gravity during fermentation can help the brewer optimize the process as well as reduce costs and resources for brewing. Moisture and total nitrogen content in barley are critical parameters. Slack malt is defined as too high in moisture content. It can lose aroma in storage and not break up properly during milling. High total nitrogen decreases carbohydrate content and yields a lower extract. The reactions that occur during germination are complex and it is especially important to monitor moisture during this phase because it has a strong effect on the reactions. Sugars formed from starch during mashing can be monitored to optimize yield and minimize cost. Fermentation monitoring for alcohol content, original gravity, and original extract can be used to optimize protocols such as changing enzymes, process parameters, and nutritional supplements. Currently, methods for testing these parameters such as HPLC are expensive, laborious, and time-consuming, especially when implemented in a process setting. There is a need for fast, cost-effective, and real-time monitoring of parameters at all stages of the brewing process. One such method that has been examined is NIR spectroscopy.
Analytes
Barley
- Moisture
- Total Nitrogen Content
- Total Lipid Content
- Protein
- Mycotoxins
Hops
- α-Acids
- β-Acids
- Hop Storage Index (HSI)
Yeast
- Protein
- Trehalose
- Glycogen
Malting
- Moisture
- Extract
- Nitrogen
Mashing
- Total Carbohydrates (TC)
- Fermentable Sugars (FS)
- Maltose
- Glucose
- Maltotriose
- Total Soluble Nitrogen (TSN)
- Free-Amino Nitrogen (FAN)
- Hot Water Extract (HWE)
- Soluble Protein
Fermentation
- Alcohol
- Original Extract
- Real Extract
- Biomass
- Soluble Solids Content (SSC expressed as °Brix and °Plato)
- pH
- Maximum Volume of Foam (MaxVol)
Summary of Published Papers, Articles, and Reference Materials
Measurement of chemical parameters in all significant constituents of beer for quality control purposes has been studied using NIR spectroscopy under both at-line and online conditions. The results of most studies have been promising. A comprehensive review of multiple studies is presented measuring parameters of interest from initial raw material analysis all the way to final fermentation as well as discussion about the benefits of using these parameters in a real-time setting to optimize beer production. The analysis includes barley, hops, yeast, malting, mashing, and fermentation. One individual study of raw materials analyzed grain and maize for moisture, total nitrogen content, and total lipid content. Results were excellent for moisture and suitable for screening purposes for nitrogen and lipids, with likely improvement to occur if the samples were ground. Three studies analyzed beer fermentation for various sugar, acidity, alcohol, and foam analyses. The first was specific to beer wort and geared toward process analysis with excellent correlation achieved for °Brix, pH, and Biomass. The second study used two different types of algorithms to correlate different types of beer under different fermentation conditions to °Brix, pH, Alcohol, and MaxVol (a foam measurement) with good results obtained after model optimization. The third study was specific for craft beer and used three different types of craft beer to analyze Soluble Solids Content (SSC expressed as °Plato and pH. The spectral analysis was able to distinguish between filtered and non-filtered samples while creating calibrations suitable for screening purposes for each type of beer.
Scientific References and Statistics
Near-Infrared Spectroscopy in the Brewing Industry – Sileoni, Marconi, Perretti, Critical Reviews in Food, Science, and Nutrition, 55:12, 1771-1791, 2015
A comprehensive and exhaustive review of NIR spectroscopy in the brewing industry. Multiple works are reviewed for using NIR spectroscopy for quality control testing of raw materials, intermediates, and finished products, as well as process monitoring during malting and fermentation. All major constituents in beer are discussed (barley, hops, yeast, malt, water) as well as the benefits of measuring them when optimizing the brewing process. Listed below are some of the constituents measured and discussed in the review. Correlation coefficients are given when shown.
Barley

Principal quality parameters for barley include moisture, protein, starch, and nitrogen which is indicative of protein content. Protein-rich barley is more difficult to process and often results in a higher malting loss. It has effects on foam retention and negative haze effects can be observed when as little as one-third of the protein passes into the beer. The normal commercial requirement is a maximum of 11.5% protein in dry barley matter. The moisture content of barley can vary from 12% to 20% depending on harvesting conditions and it must be below 15% for long-term storage. If not dried, high moisture barley can lose its ability to germinate properly as well as be at risk for mold and fungal contamination. The Analysis Committee of the European Brewery Convention (EBC) recommended the use of NIR for determining moisture and nitrogen in 2006. Studies using NIR spectroscopy for mycotoxin analysis have also been conducted and the potential was demonstrated for using NIR to measure contamination levels of various mycotoxins in barley. While promising, it must be noted that these mycotoxins were detected in very low concentrations and more validation work will be necessary to prove the feasibility of accurately measuring these constituents while ensuring that the calibration models fit the mycotoxin concentration of interest and not some other parameter. Many methods have also been developed for other quality parameters, such as hardness and β-Glucan. Extract yield, wort viscosity, and malt quality can all be directly correlated to β-Glucan in barley. Some work has also been conducted on genotype classification, which can have a substantial effect on changes during germination and malt production.
Barley Parameters
| Nitrogen | R² = 0.995 | RMSEP = 0.66% |
| Moisture | R² = 0.999 | RMSEP = 0.389% |
| Protein | R² = 0.97 | RMSEP = 0.31% |
| Glucosamine (Mold) | R² = 0.92 | RMSEP = 0.22 g/kg |
| Mycelial Dry Matter | R² = 0.94 | RMSEP = 5.25 g/kg |
| Deoxynivalenol | R² = 0.933 | RMSEP = 3.007 ppm |
| Aflatoxin B1 | R² = 0.94 | RMSEP = 0.183 ppb |
| Malt Extract | R² = 0.94 | RMSEP = 2.29% |
| β-Glucan | R² = 0.88 | RMSEP = 0.315% |
| Hardness (PSI) | R² = 0.83 | RMSEP = 0.9 PSI |
Hops
The relative concentration of hops constituents depends on the hop variety and maturation stage at the time of harvest. For the grower, maximum dry matter content at harvest results in higher yield, but this does not necessarily result in hops with optimal brewing quality characteristics. Although limited in scope, studies have been conducted to measure α-Acids, β-Acids, and Hop Storage Index (HSI) in hops using NIR spectroscopy. The acid compounds are precursors to bittering agents and HPLC is the traditional method for analyzing these. HSI is the estimated alpha acid potential loss when hops are stored at room temperature for six months. Spectroscopic UV wavelength absorptions typically measure this at 325 nm (hop acids) and around 275 nm (degenerative compounds associated with oxidation). These studies demonstrated the ability to use NIR spectroscopy to measure these parameters in hops.
Hops Parameters
| α-Acids | R²= 0.97 | RMSEP=0.22% |
| β-Acids | R²= 0.99 | RMSEP=0.20% |
| Hop Storage Index (HSI) | R²= 0.89 | RMSEP=0.010% |
Yeast

Glycogen and trehalose are both major storage carbohydrates in yeast. Yeast protein content is also an important physiological parameter and is used to determine the price of spent brewery yeast by-product. Studies have been conducted measuring these parameters using NIR spectroscopy with acceptable results. In the case of trehalose, results were much better using slurry for the constituent and this would be the preferred measurement in an online setting.
Yeast Parameters
| Glycogen | R²=0.72 | RMSEP=2.59% |
| Trehalose (Dried) | R²=0.77 | Not Given |
| Trehalose (Slurry) | R²=0.997 | Not Given |
| Protein | R²=0.97 | Not Given |
Malting

Steeping is the first step in the malting process. Sorted and cleaned barley are transferred into tanks and covered with water. During germination, barley undergoes a complex series of biochemical reactions to produce malt. Initial levels of 14% to 15% moisture in barley increase to around 42% to 44% at the end of germination. When the moisture reaches around 30%, the germination process begins by break down of the protein and carbohydrates matrices and the opening of the seed’s starch reserves. Steeping is complete when a sufficient moisture level is reached to allow uniform breakdown of the starches and protein. Monitoring the water content during germination is important for ensuring good malt modification. Studies have measured moisture on germinating barley using NIR spectroscopy with good success and high correlation. Other parameters have been studied as well for malt quality during germination with mixed results. If NIR spectroscopy could be used to monitor the germination process for malt quality, it would allow real-time adjustment of temperature and humidity parameters to accelerate or decelerate the process.
Malting Parameters
| Moisture | R²=0.92 | RMSEP=>2% |
Mashing
The main objective of the mashing process is to form maltose and other fermentable sugars from solubilized starch. Acceptable results have been achieved measuring these parameters using NIR spectroscopy. However, all these measurements were conducted on wort after sampling and most of the time, the samples were filtered and thermostated before scanning. Direct transmission measurement through mashing matter is very difficult and the filtering and temperature regulation is required. While the constituents of interest are proven to be measurable by NIR, more work will be required to validate a true industrial sensor to monitor mashing during the brewing process.
Mashing Parameters
| Moisture | R²=0.9995 | RMSEP=0.08% v/v |
| Total Carbohydrates (TC) | Not Given | RMSEP=0.5 g/L |
| Fermentable Sugars (FS) | Not Given | RMSEP=1.8 g/L |
| Maltose | Not Given | RMSEP=0.5 g/L |
| Glucose | Not Given | RMSEP=0.6 g/L |
| Maltotriose | Not Given | RMSEP=1.4 g/L |
| Total Soluble Nitrogen (TSN) | Not Given | RMSEP=48 mg/L |
| Free-Amino Nitrogen (FAN) | Not Given | RMSEP=11 mg/L |
| Hot Water Extract (HWE) | R²=0.938 | RMSEP=0.9% |
| Soluble Protein | R²=0.894 | RMSEP=0.30% |
Fermentation
Numerous studies have been conducted using NIR spectroscopy to monitor alcohol content during beer fermentation and most have shown success. Alcohol monitoring using NIR as well as related constituents like original extract and real extract have worked so well that the Analysis Committee of the European Brewery Convention (EBC) approved using NIR for determination of alcohol content in beer. The method is called Analytica-EBC 9.2.6 – Alcohol in Beer by NIRS. Beer samples are degassed so that all carbon dioxide is removed and samples are analyzed using either a scanning or filter NIR spectrometer.
Fermentation Parameters
| Ethanol | R²=0.998 | RMSEP=0.14% v/v |
| Original Extract | R²=0.998 | RMSEP=0.14% v/v |
| Real Extract | Not Given | RMSEP=0.076% v/v |
While conducted using different instruments and mostly on a laboratory scale, the studies documented in this review demonstrate the ability to use NIR spectroscopy for analysis of raw materials, intermediates, finished products, and as a process control tool in brewing, particularly during the malting and fermentation phases. Increased demand for product control of beer as well as many other liquid foods will require advanced analytical tools and NIR spectroscopy is a proven method for both online and at-line monitoring of brewing.
The development of new sensors has facilitated the implementation of NIR spectroscopy as a tool for monitoring the brewing process with successful results.
https://www.tandfonline.com/doi/full/10.1080/10408398.2012.726659
Near-Infrared Spectroscopy for Proficient Quality Evaluation of the Malt and Maize Used for Beer Production – Sileoni, Marconi, Marte, Fantozzi, Journal of the Institute of Brewing, 116 (2), 134-140, 2010
NIR Spectroscopy was used to analyze whole malt grains for moisture and total nitrogen content and maize grits for moisture and total lipid content. Total samples were two hundred ninety-five malt whole grains for moisture, two hundred eighty-one malt whole grains for total nitrogen content, one hundred twenty-eight maize grits for moisture, and one hundred two maize grits for total lipids. Different varieties were used for each sample type. An FT-NIR spectrometer collected spectra from 11500 cm-1 to 4000 cm-1 at 8 cm-1 resolution and sixty-four averaged scans per spectrum. Reference data for the parameters of interest were collected based on standard methods from the Analytica European Brewery Convention (Analytica-EBC). Various pre-processing methods and selective wavelength ranges were tested in the calibration models to optimize results.
Malt:
Moisture R2= 0.9591 RMSEP= 0.165%
Wavenumber Region = 7501.9 cm-1 to 4246.6 cm-1
Total Nitrogen Content R2= 0.7796 RMSEP= 0.048%
Wavenumber Region = 9970.4 cm-1 to 7498.1 cm-1, 6101.8 cm-1 to 4246.6 cm-1
Maize:
Moisture R2= 0.9488 RMSEP = 0.152%
Wavenumber Region = 9970.4 to 4246.6 cm-1
Total Lipid Content R2= 0.8427 RMSEP = 0.066%
Wavenumber Region = 8736.2 to 7498.1 cm-1, 6101.8 to 4246.6 cm-1
Correlation coefficients showed excellent results for moisture in both types of samples and results considered good enough for screening purposes in the case of total nitrogen content in malt and total lipid content in maize. Separate validation predictions for each model proved the feasibility of using these models for measuring the parameters of interest. It is likely that better results could be obtained for nitrogen and lipids if the samples were ground, but the results here show the potential of real-time monitoring of malt and maize used for brewing.
https://onlinelibrary.wiley.com/doi/abs/10.1002/j.2050-0416.2010.tb00409.x
Beer Fermentation: Monitoring of Process Parameters by FT-NIR and Multivariate Data Analysis – Grassi, Amigo, Lyndgaard, et al., Food Chemistry 155 (2014) 279-286
The fermentation of beer wort was monitored for nine days using FT-NIR spectroscopy for the purpose of monitoring °Brix, pH, and biomass. Two different yeast strains were used at three fermentation temperatures for the data collection and all were replicated twice using two different sampling methods (directly from the supernatant and after centrifugation for fifteen minutes at 3000 g) for a total of six different experiments. Samples were collected in triplicate right after yeast pitching and then every twenty-two hours for nine days. Standard methods were used to determine reference values for the parameters of interest. FT-NIR spectra were collected in transmission mode using a 1mm pathlength cuvette from 12000 cm-1 to 4000 cm-1 at 16 cm-1 spectral resolution. One hundred twenty-eight scans were collected and averaged for each spectrum. Principle Component Analysis (PCA), Partial Least Squares (PLS), and Locally Weighted Regression (LWR) were used to determine wavelength ranges of interest for following fermentation evolution and to correlate the NIR spectral data to reference values for °Brix, pH, and biomass.
| °Brix | R²= 0.988 | RMSEP= 0.259 |
| pH | R²= 0.987 | RMSEP= 0.112 |
| Biomass (OD @ 620nm) | R²= 0.951 | RMSEP= 0.211 |
Results obtained from the different multivariate techniques confirmed the feasibility of measuring these parameters using FT-NIR spectroscopy. PCA results confirmed that the sampling method did not matter and that it was possible to follow fermentation evolution from a chemical point of view from the spectral data. PLS results showed acceptable models for °Brix, pH, and Biomass but did suggest a possible non-linear relationship between the spectra and parameters of interest. LWR and PLS in combination confirmed the non-linear relationship but also created robust and precise models with good correlation that worked well regardless of the sampling method. The results of this study prove the feasibility of measuring °Brix, pH, and Biomass using NIR spectroscopy and show the potential to use this method for process control in online industrial brewing systems.
https://www.ncbi.nlm.nih.gov/pubmed/24594186
Assessment of Beer Quality Based on Foamability and Chemical Composition Using Computer Vision Algorithms, Near Infrared Spectroscopy, and Machine Learning Algorithms – Viejo, Fuentes, Torrico, et al., Journal of Food Science and Agriculture 2018: 98: 618-627
NIR spectroscopy was examined as a method for measuring beer quality parameters. Six replicates of twenty-one types of beer from three different types of fermentation were used for the study. Fermentation types were top, bottom, and spontaneous, which all differ in their specific process, such as yeast type, production temperature, and fermentation time. Fifteen foam and color parameters were evaluated in the samples using the RoboBEER robotic pourer, one of which (MaxVol – Maximum Volume of Foam) was used as a reference method for NIR chemometric modeling. Standard reference methods were used to determine °Brix, pH, and alcohol. All samples were scanned using a NIR handheld spectrometer from 1600 nm to 2396 nm at 7 nm to 9 nm intervals. Principle Component Analysis (PCA) was used to identify relationships between the parameters and selective wavelength ranges of interest. Both Partial Least Squares (PLS) and Artificial Neural Networks (ANN) methods were used to create chemometric models correlating the NIR spectra to the parameters of interest.
ANN Method
| MaxVol (ANN) | R²=0.93 | RMSEP=5.05mL |
| °Brix (ANN) | R²=0.91 | RMSEP=0.60 |
| pH (ANN) | R²=0.95 | RMSEP=0.21 |
| Alcohol (ANN) | R²=0.99 | RMSEP=0.01% |
| All Four Targets/Combined Output (ANN) | R²=0.97 | RMSEP=0.97 |
The ANN method proved to be more capable of fitting the target values to the spectral data than PLS and those results are shown above. ANN works using machine learning algorithms that simulate human brain processing and is typically suited to model complex linear relationships more accurately than PLS. PCA analysis identified relationships between specific NIR wavelengths and the parameters analyzed with Robobeer as well as resulting in an 85% accuracy when classifying beers according to fermentation type. The results here show promise for using NIR spectroscopy and RoboBEER as quality analysis tools in the production of beer.
https://onlinelibrary.wiley.com/doi/full/10.1002/jsfa.8506
Rapid Evaluation of Craft Beer Quality During Fermentation Process by Vis/NIR Spectroscopy – Giovenzana, Beghi, Guidetti, Journal of Food Engineering 142 (2014) 80-86
Three different types of craft beer were procured to use a portable VIS/NIR spectrometer to measure Soluble Solids Content (SSC expressed as °Plato) and pH directly on a craft beer production line. NIR transflectance spectra were collected from 450 nm to 980 nm at different stages of fermentation and were collected on both filtered and non-filtered samples. Reference values were collected for SSC and pH using standard methods. Various spectral pre-treatments were performed before Principle Component Analysis (PCA) and Partial Least Squares (PLS) regression models were created to evaluate the feasibility of measuring the parameters of interest.
Filtered SSC:
R2= 0.87-0.88 RMSEP= 1.1-1.8 °Plato
Non-Filtered SSC:
R2= 0.77-0.96 RMSEP= 0.6-2.3 °Plato
Filtered pH:
R2= 0.69-0.92 RMSEP= 0.1-0.2
Non-Filtered pH:
R2= 0.76-0.97 RMSEP= 0.06-0.2
PCA modeling showed clear discrimination in the spectra between the three different types of craft beer samples and proved that spectra of filtered and non-filtered beer were distinguishable. This could prove to be useful information for analyzing the condition of the process line. The PLS regression models showed mixed results, likely for a number of reasons. Color and turbidity conditions are different for each type of beer during fermentation, and this could affect the calibration models. Visual examination of the spectra showed different variations in noise between samples. From the limited scope of work presented here, it can be concluded that even using the worst correlated models in this study can at least provide a basis for craft beer analysis during the fermentation process. It is important to consider that craft beer manufacturers are smaller in scale than large breweries and typically only analyze for SSC and pH, making the use of a reasonably priced portable NIR analyzer a feasible method for improving fermentation conditions.
https://www.sciencedirect.com/science/article/abs/pii/S0260877414002581
References
Process Analytical Technology for the Food Industry -O’Donnell, Fagan, Cullen, et al., Springer, Food Engineering Series (2014)
Commercial References
The post Beer Analysis appeared first on NIR-For-Food.
]]>The post Butter Analysis appeared first on NIR-For-Food.
]]>Introduction
Butter is a dairy product made by churning cream or milk to separate butterfat from buttermilk. Per standard regulations, the only fat butter can contain is butterfat in the form of an emulsion of fat and water. It is composed of 80% to 90% butterfat, milk proteins, up to 16% water, and can contain salt as well. Butter is typically light yellow and has a variety of uses, such as a spread on bread products, a condiment on cooked vegetables, a dipping sauce for bread and some types of seafood, and cooking uses like pan frying and baking. Butter can be cultured or non-cultured, depending on if bacteria are added to induce fermentation and produce lactic acid. Production and consumption of butter are high in Europe and substantial in Asia and North America. The global butter market is expected to grow at an estimated CAGR of 4.2% from 2017-2023. There are numerous factors projected to contribute to this growth. Consumer consumption of fast, processed, and convenience foods is increasing, and butter is one of the key ingredients in such foods. Sale of butter is driven by its nutritional value and diverse applications across the food industry. Improvements in butter manufacturing that increase the nutritional value and flavor are helping propel market growth. Technological advances that result in improved processing and increased shelf-life of butter are contributing to growth as well. Fat content is the most important parameter in butter, but current methods for testing fat are often time-consuming and involve expensive wet chemistry methods. In the case of Solid Fat Content (SFC), an excellent indicator of the functional characteristics of milk fat and an important parameter in many dairy products, the current reference method is Nuclear Magnetic Resonance (NMR) spectroscopy. This method requires over sixteen hours of sample preparation and is expensive, making it impractical for real-time analysis. Water is another critical component in butter that must be monitored. Adulteration is a significant issue in the dairy industry and monitoring butter for adulteration is of key importance. Different methods of adulteration are always emerging and testing methods for detecting adulterants must continue to evolve as well. Current methods for testing these parameters are expensive, laborious, and time-consuming, especially when implemented in a process setting. There is a need for fast, cost-effective, and real-time monitoring of parameters at all stages of the butter manufacturing process. One such method that has been examined is NIR spectroscopy.
Analytes
- Fat
- Moisture
- Solid Fat Content (SFC)
- Tallow Adulteration
Summary of Published Papers, Articles, and Reference Materials
Measurement of chemical parameters in major constituents of butter for quality control purposes has been studied using NIR spectroscopy. The results of most studies have been promising. One study examined measuring fat and moisture in butter, considered the two most important parameters not only in the manufacturing process but for monitoring for adulteration as well. Despite a limited sample set for such a study, results were good and proved the feasibility of measuring these two parameters using NIR spectroscopy. Another study examined measuring the Solid Fat Content (SFC), defined as the amount of solid fraction of fat crystallized at a specific temperature in terms of weight percentage. SFC is an essential indicator of the functional characteristics of milk fat and the current reference method for testing it is very time-consuming. Calibration models showed excellent results, showing the potential to replace the current reference method with NIR spectroscopy. Another study examined determining the presence of tallow adulterant in butter as well as quantitatively measuring the percent adulterant. Tallow is animal fat that can be melted down and used as an adulterant in butter. Various modeling algorithms were used for identification and quantification of tallow in the butter samples, all showing excellent results and proving NIR spectroscopy as a valid method for finding tallow adulterant in butter.
Scientific References and Statistics
Comparison of Butter Quality Parameters Available on the Czech Market with the Use of FT-NIR Spectroscopy – Dvorak, Luzova, Sustova, Mljekarstvo 66 (1), 73-80 (2016)
The two most important quality parameters in butter are fat and water. They are not only important in terms of the manufacturing process but are crucial in butter adulteration as well. A common form of butter contamination is adding vegetable fats at the expense of butterfat, which according to regulations will make the substance undefinable as butter since butter must contain only butterfat, water, and a small portion of other components. Current methods for determining these parameters are expensive, time-consuming and impractical for real-time, on-line analysis. NIR spectroscopy was examined as a method for determining fat and moisture in butter available on the Czech market. Twenty-six samples of butter were procured for the study. Thirteen were manufactured in the Czech Republic and thirteen came from abroad. Samples were prepared by cutting the butter into 1 cm thick slices from the center of the whole cube. NIR spectra were collected using an FT-NIR spectrometer in reflectance mode. Eighty scans were collected and averaged per spectrum using 4 cm-1resolution. Each sample was scanned twice for a total of fifty-two spectra. Values for fat and moisture were obtained using standard reference methods. The NIR spectra and reference values were used to create Partial Least Squares (PLS) regression models correlating the spectra to fat and moisture.
| Fat | R2= 0.947 | RMSEP = 0.859% |
| Moisture | R2= 0.956 | RMSEP = 1.34% |
Both models showed high correlation coefficients and low prediction error. Independent validation of the models was performed by using cross-validation, a process where samples are removed from the model and the spectra of these samples are used to predict values for each parameter of interest using the calibrations. This process is repeated until all samples have predicted values from the NIR spectra and models. Those results are then compared to values obtained from the reference method. Cross-validation confirmed the validity of the models and results should improve with a larger sample set. Twenty-six samples are a small number of samples to build regression models, but the results are decent considering the sample size. The results here prove the feasibility of monitoring fat and moisture using NIR spectra and calibration models.
https://hrcak.srce.hr/file/222331
At-Line Near-Infrared Spectroscopy for Prediction of the Solid Fat Content of Milk Fat from New Zealand Butter – Meagher, Holroyf, Illingworth, et al., Journal of Agricultural and Food Chemistry, 2007, 55, 2791-2796

Solid Fat Content (SFC) is an important parameter in dairy products and especially in butter. It is a measure of the amount of solid fraction of crystallized fat in terms of weight percentage and is a good indicator of the functional characteristics of milk fat. Cream is a water and oil emulsion and when subject to agitation by churning, fat globule membranes can rupture and the fat will agglomerate. An optimum crystallization pattern in the fat for this process is a function of temperature and direct knowledge of the SFC in the cream can help the butter maker determine the proper conditions. Functional characteristics of cream-based products, such as texture and spreadability, are largely dependent on SFC. The current at-line American Oil Chemists’ Society (AOCS) approved method for determining SFC is nuclear magnetic resonance (NMR) spectroscopy. NMR involves a sixteen-hour delay period for tempering the fat at 0°C before measurement and subsequent analysis from 0°C to 35°C in 5°C increments, rendering this method impractical for real-time measurements.
NIR spectroscopy was examined as a method for determining SFC in butter samples. Seventy-six samples were procured for the study. The selected samples were representative of the major dairy producing regions in New Zealand in terms of both geographical distribution and volume of butter production. Eight different plants provided samples and samples were acquired from two separate production seasons, comprising two years of production during the spring, summer, and fall. NMR reference testing was first performed on each sample and a portion was set aside for NIR analysis. Each sample was held overnight at 0°C, and then two replicates of each sample were equilibrated for forty-five minutes at each temperature (0°C to 35°C in 5°C increments) before measurement. The mean of the two replicate sample values was used as the SFC reference value for the NIR calibration models. A portion of each replicate sample was equilibrated at 60°C before NIR spectra were obtained. Samples were scanned from 400 nm to 2500 nm at 2 nm intervals. Thirty-two scans were collected in reflectance mode and averaged into one spectrum. This process was repeated ten times for each sample and these spectra were averaged as well. Random samples were also scanned over multiple days throughout data collection. In total, one hundred forty-nine spectra were collected. Spectra were first analyzed using Principle Component Analysis (PCA), and after examining various pre-treatments of the data, Partial Least Squares (PLS) regression models were created for each temperature used during NMR analysis from the NIR spectra and reference values for SFC.
| Range of R² In Models from 0°C to 30°C | 0.923 to 0.978 |
| Range of RMSEP In Models from 0°C to 30°C | 0.385% to 0.762% |
Visual examination of the NIR spectra and initial modeling work showed that only the wavelength range from 540 nm to 2250 nm was relevant for contributing to the calibration and this range was used for the PLS models. Various pre-treatments were applied to the spectra and Standard Normal Variate (SNV) and 1st Derivative Transformation with Detrend Scatter Correction showed the best results during initial modeling assessment. The models for each temperature from 0°C to 30°C all showed excellent results that are good enough for use in a real-time setting. In the case of the 35°C model, results were much worse but this is because of a minimal range of values. Each model from 0°C to 20°C had about a 10% range in the values for SFC. 25°C and 30°C models had about a 5% range in SFC. The 35°C model range was less than 2%, and this contributed to a low correlation. Further analysis of this work could include classification analysis to choose the proper range of SFC and then analyzing the actual value from the proper PLS model or creating one universal PLS model for all temperatures, which would likely require a much larger sample set to be robust enough to work in a real-time setting. The results here show promise for real-time analysis of SFC in butter using NIR spectra and PLS calibration models, replacing the expensive and time-consuming NMR method that is currently used.
https://pubs.acs.org/doi/abs/10.1021/jf063215m?journalCode=jafcau
Robust New NIRS Coupled with Multivariate Methods for the Detection and Quantification of Tallow Adulteration in Clarified Butter Samples– Mabood, Abbas, Jabeen, et al., Food Additives & Contaminants: Part A, 35:3, 404-411
Food adulteration has become a big problem on a global scale during recent years. Increased population, higher supply and demand for food, and less detectable methods of adulteration have all contributed to the problem. Food authenticity and detection of adulteration have become a priority for both food producers and consumers, as adulteration results in reduced profits, bad publicity, and in some cases, presents a health risk to the public. Dairy products are no exception to the adulteration issue and one potential adulterant in butter is tallow, an animal fat material which causes increased serum cholesterol and triglycerides levels when consumed. Tallow is even used to make candles and soap and is obviously an unsuitable substitute for butter at any concentration. Visual examination is difficult for determining the presence of adulterants and wet chemistry methods are time-consuming and expensive. NIR spectroscopy was examined as a fast method requiring little sample preparation for determining the presence of tallow adulterant in butter. Nine portions of pure butter samples with no tallow adulteration were set aside. Tallow was prepared by melting animal fat and collecting the oil portion poured out from the solid residue. Nine samples of each of the following tallow concentrations by weight in butter were prepared: 1%, 3%, 5%, 7%, 9%, 11%, 13%, 15%, 17%, and 20%. Including the nine samples with no tallow adulteration, a total of ninety-nine samples were used for the study. NIR spectra were collected in reflectance mode from 10000 cm-1 to 4000 cm-1 using 2 cm-1 resolution. A transflectance sample accessory with a total pathlength of 0.5 mm was used for collection. Various pre-treatments were performed on the NIR spectral data, after which Principle Component Analysis (PCA), Partial Least Squares-Discriminant Analysis (PLS-DA), and Partial Least Squares (PLS) chemometric methods were used to build the models.
food adulteration has become a big problem on a global scale during recent years. Increased population, higher supply, and demand for food, and less detectable methods of adulteration have all contributed to the problem. Food authenticity and detection of adulteration have become a priority for both food producers and consumers, as adulteration results in reduced profits, bad publicity, and in some cases, presents a health risk to the public. Dairy products are no exception to the adulteration issue, and one potential adulterant in butter is tallow, an animal fat material which causes increased serum cholesterol and triglycerides levels when consumed. Tallow is even used to make candles and soap and is an unsuitable substitute for butter at any concentration. Visual examination is difficult for determining the presence of adulterants, and wet chemistry methods are time-consuming and expensive. NIR spectroscopy was examined as a fast method requiring little sample preparation for determining the presence of tallow adulterant in butter. Nine portions of pure butter samples with no tallow adulteration were set aside. Tallow was prepared by melting animal fat and collecting the oil portion poured out from the solid residue. Nine samples of each of the following tallow concentrations by weight in butter were prepared: 1%, 3%, 5%, 7%, 9%, 11%, 13%, 15%, 17%, and 20%. Including the nine samples with no tallow adulteration, a total of ninety-nine samples were used for the study. NIR spectra were collected in reflectance mode from 10000 cm-1to 4000 cm-1using 2 cm-1resolution. A transflectance sample accessory with a total pathlength of 0.5 mm was used for collection. Various pre-treatments were performed on the NIR spectral data, after which Principle Component Analysis (PCA), Partial Least Squares-Discriminant Analysis (PLS-DA), and Partial Least Squares (PLS) chemometric methods were used to build the models.
| Predict Value (0 = no tallow, 1 = presence of tallow) | R²= 0.95 | RMSEP = 0.062 |
| Tallow % | R²= 0.973 | RMSEP = 1.537% |
The results presented were excellent and proved the feasibility of using NIR spectroscopy to determine the presence of tallow adulterant in butter as well as quantitatively measure the amount of tallow with reasonable prediction error. After various pre-treatments were performed, the wavenumber range from 7500 cm-1to 4000 cm-1using the first derivative with fifteen smoothing points was used for the calibration models. Examination of the scores plot after PCA showed clear classification and separation between each group of samples, proving that changes to the NIR spectra occur as more tallow is added to the samples. PLS-DA uses the arbitrary values of 0 and 1 for classification purposes between two groups. The model generates a number based on NIR spectra. A number less than 0.5 classifies as the group assigned to 0 and a number greater than 0.5 classifies as the group assigned to 1. In this case, the RMSEP of 0.062 is more than accurate enough to classify the sample as non-adulterated or adulterated. PLS predicts a quantitative value from NIR spectra and a calibration model. The RMSEP shows a prediction accuracy with error slightly greater than 1.5% tallow, which is accurate enough for real-time use. To properly validate the model, 30% of the samples were removed from the PLS model, a new model was created without those samples, and the NIR spectra of those samples were used with the new model to predict the percentage of tallow adulteration. These results proved the validity of the model and all predictions showed an error of less than 2% tallow. More samples over the range of values encompassing different types of butter will improve the results and make the model robust enough for universal application for tallow adulteration screening of butter.
https://tandfonline.com/doi/abs/10.1080/19440049.2017.1418090?journalCode=tfac20
Commercial Reference
The post Butter Analysis appeared first on NIR-For-Food.
]]>The post Cereals & Barley Analysis appeared first on NIR-For-Food.
]]>Introduction
Cereals have played an essential role in the development of human civilization and have been cultivated for nearly ten thousand years. By definition, a cereal is any cultivated grass grown for the edible components of its grain and can also refer to the resulting grain itself. The edible components of cereal grain are the endosperm, germ, and bran. Unprocessed grains have high nutritional content and are a rich source of vitamins, minerals, carbohydrates, fats, oils, and protein. The bran and germ are often removed in processed cereal products and the endosperm is composed of mostly carbohydrates. Cereal grains can be used for human food, animal feed, biodiesel, and as a starch source for conversion into fermentable sugars. Cereals are grown in greater quantities and provide more food energy worldwide than any other type of crop. The long shelf life, high caloric content, and nutritional composition of grains makes them an ideal food source, especially in impoverished and developing countries. The most widely produced cereal crops worldwide are maize, wheat, rice, barley, and sorghum. Many types of cereals are adaptable to different climates and growing conditions and others are specific to certain parts of the world. Barley in particular is known for being versatile and adaptable to unfavorable climate and soil conditions. It is a top source of animal feed for cattle and has superior properties for malting and brewing. Barley flour is used in many types of foods, such as stews, soups, pastas, noodles, sauces, and baked products. One important processed product made from cereal grains is breakfast cereals, which have gained popularity as a ready-to-eat food that is being repositioned as not only a breakfast food but as a snack or dessert in cereal bar food. Companies are constantly marketing new and eye-catching flavors along with playing to increased consumer awareness of health and nutritional benefits of foods. There are many different types of breakfast cereals and quality control during manufacturing is very important to meet proper specifications. With demand continuing to grow and research moving forward at a rapid pace, there is a need for new testing methods to meet the challenges of optimizing cereal grain breeding, growing, harvesting, and processing as well as manufacturing of different cereal based products. Traditional methods are often expensive, time-consuming, and impractical for use on a large scale. One method which has shown potential for measuring parameters of interest in cereals that is fast, non-invasive, and able to be implemented for large-scale testing is NIR spectroscopy.
Analytes
- Starch
- Amylose
- Sugars
- Protein
- Waxy wheat discrimination analysis
- Viscosity parameters
- Degree of gelatinization
- Dry matter
- Nitrogen
- Hardness
- Soluble sugars
- Oil
- Moisture
- Toxin levels
- Crude protein
- Lipids
- Endosperm texture Superoxide Dismutase (SOD) Activity
- Total Amino Acids (TAA)
- Fusarium infection
- Selection of optimal high yield and high quality malt barley varieties
- Optimization of processing conditions in barley milk manufacturing
- Glucose
- Fructose
- Sucrose
- Total sugars
- Classification of breakfast cereal bars
A Review on the Role of Vibrational Spectroscopy as an Analytical Method to Measure Biochemical and Biophysical Properties in Cereals and Starchy Foods
 Starch is the major component of cereal grains and other starchy foods. Stored starch in the seeds and tubers of many agricultural crops provides the main source of energy in human diets, including cereal crops like maize, wheat, rice, barley, and sorghum. Changes in the biochemical and biophysical properties of starch are directly related to the ratio of amylose and amylopectin. Amylose is a polysaccharide that makes up about 20% to 30% of total starch in most starch containing plants. It has a tightly packed helical structure, making it more resistant to digestion than other starch molecules and an important component of resistant starch. Amylopectin makes up 70% to 80% in most starch containing plants, although it varies depending on the source. It is a water soluble polysaccharide bearing a linear chain with linked glucose units that can branch into side chains. Amylopectin is higher in medium-grain rice, waxy potato starch, and waxy corn, can be up to 100% in glutinous rice, and is lower in long-grain rice and amylomaize. The ratio of the two starch components influences properties like viscosity and gelatinization that affect the end use of the compound. Current methods for measuring chemical and physical properties of starch are slow, require sample preparation and destruction, and are often impractical for large-scale use. Two such methods are Differential Scanning Calorimetry (DSC) and Rapid Visco Analyzer (RVA). One example of RVA use in cereal analysis is to determine the effects of rain damage on grain quality at the point of delivery. Over the last twenty-five to thirty years, vibrational spectroscopy and chemometric techniques have been examined for developing rapid methods for determining biochemical and biophysical properties of interest in cereals and other starchy foods. NIR spectroscopy is particularly well-suited for measuring starch-related parameters, offering the advantages of fast analysis, no sample destruction, minimal or no sample preparation, and the ability to measure multiple parameters from one light scan. According to one report, NIR spectroscopy is currently applied in three different ways in cereal and starchy foods analysis: straightforward and rapid determination of composition, a screening tool in plant breeding, and an in-line tool to monitor chemical and physical changes during processing. This review paper examines various applications for measuring and monitoring both biochemical composition (amylose, amylopectin, and starch) and biophysical properties (pasting properties, viscosity) in cereals and starchy foods.
Amylose, Amylopectin, Starch, and Granule Structure
Parameter Sample Statistics
| Starch Buckwheat Flour | R² = 0.93 | |
| Starch Sweet Potato | R² = 0.95 | SEP = 1.91% |
| Starch-Amylose (SAC) Corn | R² = 0.96 | SEP = 5.1% |
| Starch Potato Tubers | R² = 0.90 | SECV = 0.74% |
| Amylose Sorghum | R² = 0.75 | SEP = 0.77% |
| Starch Yam Tubers | R² = 0.84 | |
| Sugars Yam Tubers | R² = 0.86 | |
| Proteins Yam Tubers | R² = 0.88 | |
| Starch Taro | R² = 0.89 | |
| Sugars Taro | R² = 0.90 | |
| Amylose Rice | SEP = 0.31% | |
| Amylose Beans | SEP = 12.8 g/kg | |
| Amylose Barley | SEP = 1.09% | |
| Starch Barley | SEP = 0.98 | |
| Amylose Yam | SEP = 3.71% | |
| Starch Yam | SEP = 1.78% | |
| Crude Starch Maize | SEP = 0.96% |
Waxy Wheat vs. Partial Waxy Discriminant Analysis – Accuracy greater than 90%
The statistics shown above are from various application studies examining the feasibility of measuring biochemical parameters in starch-based foods. High correlation coefficients and low SEP measurements were found for starch in many of the samples, with a correlation coefficient greater than 0.90 for buckwheat flour, sweet potato, corn, and potato tubers. In the case of sweet potatoes, good predictions were obtained from samples from the same harvests but the model could not account for variances in samples from other harvests or years, indicating that further calibration work is necessary before using the calibration model in a practical setting. Slight lower correlation and reasonable SEP numbers were found for yam, yam tubers, taro, and barley as well as for crude starch in maize. Application studies for amylose showed good correlation as well, especially in the case of starch-amylose content (SAC) in corn. This particular study used a set of genotypes with endosperm mutations, creating a range from 8.5% to 76% in SAC. This large range likely contributed to the good results. Amylose in sorghum was determined using both whole and ground samples, with better results coming from the ground samples. This is expected when measuring a biochemical property as ground samples are more homogenous. Good results were also obtained measuring sugars, proteins, and starch in yam tubers. In the case of the discriminant analysis study for wheat, waxy wheat that was developed free of amylose was used along with partial waxy and wild genotypes. The Linear Discriminant Analysis (LDA) model was able to discriminate the waxy wheat with an accuracy over 90%, although results were less accurate for the other two types. The authors of the study suggested that the spectral sensitivity to waxiness diminishes with reduction of the lipid-amylose complex that is lowered as waxiness decreases. Overall, these studies show the feasibility of using NIR spectroscopy and chemometric models for determining biochemical parameters of interest in cereals and other starch-based foods.
Gelatinization, Pasting Properties, and Retrogradation of Starch
| PV | Peak Viscosity |
| BD | Breakdown |
| SB | Setback |
| HPV | Hot Pasting Viscosity |
| TH | Though |
| FV | Final Viscosity |
| RVU | Rapid Visco Units |
Parameter (RVU) Sample Statistics
| BD Rice | R² = 0.88 | SEP = 10.2 |
| SB Rice | R² = 0.92 | SEP = 13.6 |
| PV Rice | R² = 0.74 | SEP = 20.99 |
| BD Rice | R² = 0.80 | SEP = 21.47 |
| SB Rice | R² = 0.97 | SEP = 22.23 |
| TH Rice | R² = 0.80 | SEP = 7.37 |
| FV Rice | R² = 0.95 | SEP = 13.2 |
| PV Sweet Potato | R² = 0.91 | SEP = 13.1 |
| BD Sweet Potato | R² = 0.81 | SEP = 10.67 |
| SB Sweet Potato | R² = 0.92 | SEP = 1.82 |
| PV Maize | R² = 0.92 | SEP = 183 |
| BD Maize | R² = 0.92 | SEP = 232 |
| SB Maize | R² = 0.92 | SEP = 412 |
| Degree of Gelatinization Pasta | R² = 0.97 | SEP = 0.24 |
 RVA instruments are widely used in assessing cooking and processing characteristics in food, especially in rice. One study examined NIR spectral changes due to changes in structure of starch from gelatinization. Numerous wavelengths showed notable changes in the second derivative spectra, especially in the wavelength range from 2100 nm to 2280 nm. The authors speculated that effects on particle size explained the changes in the NIR spectra, as high correlation exists between particle size and degree of gelatinization. Numerous studies have shown that NIR spectroscopy and calibration models can be used to predict biophysical viscosity parameters with good accuracy as is shown in the statistics listed above. The variability of results in these studies can be attributed to a number of factors, such as the accuracy of the reference method, interferences with other properties, range of values in the parameters of interest, number of samples used, and sources of variability in natural products. It is often the case that differences in climate, soil composition, harvest year, breed, genotype, and variety in agricultural products can create differences in NIR spectra that are not directly attributed to changes in the parameters of interest. Calibration models must contain samples that cover all these sources of variability in order to make accurate predictions and the process of making such a model is called creating a “robust” model. There are challenges in the interpretation of complex data using multivariate methods and calibration development, but the advantages of using NIR spectroscopy as a fast, non-invasive, and cost-effective method to predict parameters of interest in cereals and starchy foods ensures that continued research and development will occur.
An Overview on the Use of Infrared Sensors for in Field, Proximal, and at Harvest Monitoring of Cereal Crops
There is a demand from farmers for rapid, cost-effective, green, and non-destructive methods for monitoring changes in the physical and chemical properties of crops. Monitoring properties throughout the lifecycle of the plant can help establish the optimum harvest date, improve agronomic management practices, and improve crop diagnostics. The concepts of water and nitrogen use and efficiency have been around for a long time but their use is minimal as part of the decision making process and are often not used as metrics for evaluating farm performance due to a lack of adequate tools and sensors. Farmers, researchers, and instrument manufacturers are constantly looking for ways to develop new sensors that can evaluate efficiency to improve production and processes. Proximal sensors can provide a powerful tool for analysis of soil physical properties, chemical properties, and crop diseases. One potential tool for monitoring cereal and agricultural crops is NIR spectroscopy. NIR spectroscopy provides the advantages of being fast, non-invasive, no sample destruction, little or no sample preparation, requires no toxic chemicals or solvents, and the ability for large-scale monitoring as well as being able to measure multiple parameters of interest with a single light scan. Research and development is happening with a number of applications and the use of NIR spectroscopy as a practical tool is dependent on multiple factors, such as instrument cost and availability, using the instrument in the field or on-line, and model robustness, accuracy, and precision. This review paper examines application studies using NIR spectroscopy to monitor dry matter (DM), yield, nitrogen, and pest and diseases in various cereal crops.
Dry matter is one of the most important parameters in crop production as it is directly related to production costs. The significance of determining water status in plants has been increased in the context of climate change and scheduling irrigation times and volumes, preserving water, and manipulating composition are of utmost importance. Water is a proven parameter that can be measured using NIR spectroscopy as water is very absorbing of NIR light in the wavelength range above 1000 nm and even small changes create marked differences in the NIR spectra. However, there are logistical and technical challenges in making measurements of plants or crops on a farm. These include the creation of robust calibration models that cover variability in NIR spectra caused by differences in soil, breed, variety, genotypes, and other sources of variability in agricultural products. In recent years, the development of portable field instruments has facilitated the direct measurement of samples in the field. Such analysis is advantageous for monitoring fresh plant samples without the need for drying, grinding, or sending the sample to the laboratory. Numerous authors have reported that one of the major causes for low nitrogen use efficiency is the poor synchrony between soil nitrogen supply and crop demand. Traditional reference methods for determining nitrogen concentration are the Kjeldahl and Dumas methods which are accurate but are also time-consuming, expensive, require the use of chemicals and solvents, and are ill-suited for widespread testing. Studies in recent years have demonstrated the potential of NIR spectroscopy in determining nitrogen concentration in grass samples and as a replacement for wet chemistry methods with online field screening, helping to facilitate improved nitrogen uptake efficiency and total concentration.
The feasibility of using NIR spectroscopy has been evaluated for multiple harvest applications in cereal crops. Cereal grains can be analyzed whole, as ground powder, or in some cases as single seeds when determining different chemical properties. Classification of maize kernels based on starch composition, hardness, and toxin levels has been examined in application studies. Likewise, dry matter, starch, soluble sugars and crude protein in several types of cereal grains have been studied using NIR spectroscopy and these four parameters have all shown good results in studies. In the case of single seeds, best results have been obtained from plants with small seeds and a relatively uniform distribution of seed constituents, such as rapeseed, wheat, sunflower, soybean, and cottonseed. Oil and protein are two examples of parameters in single seeds that can be measured using NIR spectroscopy. Spectroscopic techniques have also been examined for detection of both symptomatic and asymptomatic plant diseases as well as pest infestation. One study examined the percentage of Aspergillus fungal infection in rice samples and another identified aflatoxin B1 in paddy rice samples. Other studies examined deoxynivalenol and other mycotoxins in various types of cereals. It must be noted that the concentration of these toxins in plants is often far below the threshold of detection for NIR spectroscopy. It is likely that calibration models are actually correlating to a measurable parameter that is being affected directly by the toxic contamination. While such an indirect correlation is acceptable, such models must be examined carefully when building the calibration to ensure the models are valid. Overall, these studies have shown the important role and potential of NIR spectroscopy in cereal crop analysis. It can optimize manpower and expenditure required for crop analysis, reduce sampling error, and deliver more representative measurements of plots on a farm. Farmers in Australia, Canada, Europe, and the United States are using NIR spectroscopy to determine parameters like protein and dry matter during harvest. Research and development continue and the potential savings, quick analysis time, and environmentally friendly nature of using NIR spectroscopy could one day lead to the application of NIR spectroscopy across the entire food supply chain.
Development of NIRS Equations for Food Grain Quality Traits Through Exploitation of a Core Collection of Cultivated Sorghum
Sorghum is a major food cereal in Asian and African countries. Some examples of traditional foods made with sorghum include porridge in western Africa, ugali in Eastern Africa, couscous, masa, and tortillas. Grain quality is determined by biochemical and physical parameters that influence rheological and sensory properties of sorghum dishes. For example, the consistency of thick porridge is significantly correlated with amylose content but negatively correlated with protein and lipid content. Cooked couscous firmness correlates positively with amylose while waxy sorghums that contain little or no amylose produce sticky masa and tortillas with poor rollability. Endosperm texture and hardness affect grain mold resistance, grain storage ability, milling behavior, flour particle size, and cooking properties. Hard grains produce flours that have a high proportion of coarse particles with low ash content. These grains yield a high proportion of desirable sorghum couscous granules. Standard laboratory methods for measuring these parameters are time-consuming, expensive, often require the use of toxic chemicals and solvents, and are impractical for measuring samples on a large scale. NIR spectroscopy was examined for determining quality traits in sorghum. It offers the advantages of being fast, non-invasive, no sample destruction, little or no sample preparation, and the ability to measure multiple parameters with a single light scan. The objective of the study was to use a large and diverse sorghum core collection to develop NIR calibration models for amylose, protein, lipids, endosperm texture, and hardness for the purpose of varietal comparisons and genetic analyses in the framework of a breeding program. Two hundred and five accessions of the core collection were analyzed from five basic races and five intermediate races. The accessions originated from thirty-nine different countries. Most samples were harvested from an irrigated trial conducted during a single dry season in Senegal. Eight local varieties were also added to the study and in total, two hundred and seventy-eight samples were procured for the study. All grains were cleaned, sifted through a sieve adapted to the average grain size of each sample, and moisture content was measured to calculate the quantity of water needed to reach 11.5% moisture. Water was added and the samples were stored in sealed containers for a minimum of eight days before use. 20 g of each sample was ground in a 0.8 mm sieve. For each sample, both whole grains and ground portion were scanned using an NIR spectrometer from 400 nm to 2500 nm at 2 nm intervals. Thirty-two scans were collected per reading and averaged into a single spectrum. Whole grain samples were collected in duplicate while only one spectrum was collected for ground samples. Traditional reference methods were used on the samples to determine values for the parameters of interest. Various pre-processing methods were performed on the spectral data before chemometric analysis. Principle Component Analysis (PCA) was performed to determine variations in the NIR spectra and for outlier analysis. Partial Least Squares (PLS) calibration models were created using the NIR spectra and reference values of the parameters of interest.
Ground Sorghum Calibration Models
| Amylose | R² = 0.75 |
| Protein | R² = 0.98 |
| Lipids | R² = 0.91 |
| Endosperm Texture | R² = 0.88 |
| Hardness | R² = 0.90 |
Whole Grain Sorghum Calibration Models
| Amylose | R² = 0.70 |
| Protein | R² = 0.95 |
| Lipids | R² = 0.84 |
| Endosperm Texture | R² = 0.85 |
| Hardness | R² = 0.88 |
Results for the calibration models using the NIR spectra of both ground and whole grains showed good correlation for all parameters with the exception of amylose, which likely occurred because of a small range of values in the samples. Results would likely improve by extending the range of values for amylose by using waxy and non-waxy grains as well as using progenies obtained by crossing contrasted varieties. Previous studies using other cereals that compared ground grain sample vs. whole grain sample calibrations showed comparable results. The reasons for this include homogeneity of the ground samples and scattering effects on the spectra of whole grain samples due to differences in particle size. This study proved the feasibility of using NIR spectroscopy and calibration models to determine quality traits in both whole and ground sorghum grains.
Fast Analysis of Superoxide Dismutase (SOD) Activity in Barley Leaves Using Visible and Near Infrared Spectroscopy
 Barley is widely cultivated around the world, especially in Asia and Northern Africa. It is considered one of the most adaptable cereal grain species and can be produced at higher altitudes and latitudes as well as further into the desert than any other cereal crop. Oxidative stress is one of the detrimental effects of reduced oxygen and is an important phenomenon in many biological systems. Superoxide dismutase (SOD) is one of the protective enzymes that plays an important role in protection against environmental adversity. It can remove free radicals and improve stress tolerance. The traditional method for determining SOD activity is to measure its ability to inhibit the photochemical reduction of nitroblue tetrazolium, which requires the use of toxic chemical reagents and sample destruction. NIR spectroscopy was examined for determining the feasibility of predicting SOD activity in barley leaves. Samples were procured from a farm in China. A herbicide was used as a stressor with five different concentrations (0, 50, 100, 500, and 1000 mg/L) applied at the two leaf stage. Seventy-five sample were collected during the growing period at intervals of five, ten, and fifteen days after herbicide treatment. NIR spectra of the barley leaves were collected from 325 nm to 1075 nm at 1.5 nm intervals. Three spectra were collected per sample and averaged into one spectrum. All leaf samples were tested for SOD activity by the standard reference method. Various preprocessing methods were applied to the spectral data before chemometric analysis. Four separate regression algorithms were used to correlate the NIR spectra to SOD activity: Partial Least Squares (PLS), Multiple Linear Regression (MLR), Least Squares-Support Vector Machine (LS-SVM), and Gaussian Process (GP). Fifty samples were used as a calibration set to create the regression models and the remaining twenty-five samples were used as an independent validation set.
| LS-SVM | R² = 0.9064 | RMSEP = 0.5536 U/mg Pro |
The first PLS model used the entire spectral range for the calibration and obtained decent results with pre-processed spectra. The regression coefficients from the PLS model were then used to select thirty effective wavelengths as input for the LS-SVM model. The best results were obtained from this model and both the LS-SVM and SP models showed better results than PLS and MLR. LS-SVM and SP are both non-linear calibration algorithms and proved to be more suitable for determining SOD. Independent predictions from the validation set proved the validity of the model. While further study and more samples would be necessary before using this model in a practical setting, this study showed the potential and feasibility of using NIR spectroscopy to determine SOD activity in barley leaves.
Quantitative Analysis of Total Amino Acid in Barley Leaves Under Herbicide Stress Using Spectroscopic Technology and Chemometrics
Barley is one of the earliest cultivated cereal grains and is attracting renewed interest for its use as food and as a bioethanol feedstock. It is known for drought resistance and the ability to mature in climates with a short growing season. Amino acid content is an important physiological indicator of environmental stress during plant growing season. A recently developed herbicide, ZJ0273, has been applied to remove and control weeds in barley fields (the same herbicide used in the above SOD leaves study). It is an ALS (acetolactate synthase) inhibiting herbicide which affects the formation of branch chain amino acids like aspartic acid, valine, and proline. Total amino acids (TAA) is an important parameter for understanding the effects of herbicides on barley growth. The traditional method for measuring TAA is an automatic amino acid analyzer which is expensive, time-consuming, requires sample destruction, and is impractical for measuring large numbers of samples. NIR spectroscopy was examined for the purpose of determining TAA in barley leaves, offering a fast, non-destructive method for helping to measure the effects of herbicide injury on barley plants. Seventy-five barley leaf samples were procured from a farm in China for the study. ZJ0273 was applied during the seeding stage at concentrations of 0, 50, 100, 500, and 1000 mg/L. All samples were scanned using an NIR spectrometer from 325 nm to 1075 nm at 1.5 nm intervals. Thirty scans were collected per reading and averaged into one spectrum. Three separate spectra were collected per sample and further averaged into one spectrum. Various pre-processing methods were applied to the spectral data before chemometric analysis. Two separate regression algorithms were used to correlate the NIR spectra to TAA: Partial Least Squares (PLS) and Least Squares-Support Vector Machine (LS-SVM). PLS is a bilinear modeling method while LS-SVM can be used for both linear and non-linear relationships between variables. Fifty samples were used as a calibration set for both models while the remaining twenty-five samples were used as an independent validation set for predictions.
| PLS | R² = 0.935 | RMSEP = 0.558 |
| LS-SVM | R² = 0.936 | RMSEP = 0.309 |
Results were successful using both calibration methods. The first PLS model was created using the full spectral range and from the regression coefficients, significant wavelengths and latent variable were chosen as the inputs for the PLS and LS-SVM models shown above. While the sample set was limited, the results showed the feasibility of using NIR spectroscopy to measure TAA in barley leaves. Further study would be warranted before using these models in a practical setting and more variability needs to be incorporated into the calibration models, such as leaf samples at different growth stages and more varieties of barley.
Classification of Fusarium Infected Korean Hulled Barley Using Near-Infrared Reflectance Spectroscopy and Partial Least Squares Discriminant Analysis
Fusarium is a pathogen that can grow in the heads of cereal crops such as barley and wheat that can decrease yield and degrade grain quality, resulting in enormous economic losses to farmers. It can grow rapidly at temperatures between 10°C and 25°C in a high humidity environment after heavy rainfall. The pathogen can winter in seeds, straw, stubbles, and soil after harvest, leading to formation of molds that can damage ears with a brown discoloration at the early stage and gradually covering them with red conidiospores. In 1998 in Korea, fusarium infection damaged nearly forty thousand hectares of fields, which corresponds to 47.8% of the total cultivation area in the country. It can lead to the production of mycotoxins like deoxynivalenol, nivalenol, and zearalenone, which can cause intoxication of livestock and major diseases in humans if consumed, particularly as a carcinogen. Traditional methods for inspecting barley for fusarium and mycotoxin contamination include high performance liquid chromatography (HPLC), gas chromatography (GC), and enzyme-linked immunosorbent assay (ELISA). While effective, these methods are time-consuming, expensive, require the use of toxic chemicals and solvents, and are impractical for measuring large amounts of samples. NIR spectroscopy was examined for discriminating between fusarium infected barley and normal hulled barley. It offers the advantages of being fast and non-invasive with no sample destruction and little or no sample preparation. Five hundred and fifteen kernels of hulled barley were collected from five different Korean provinces for the study. The samples were divided into a control group and experimental group. One hundred and twenty-seven samples from a single province were not infected with fusarium. The remaining samples were infected and came from four separate groups. All samples were scanned using an NIR spectrometer from 1175 nm to 2170 nm. Each sample was scanned three times each on the front of the barley which contains a crease and the back which has no crease. The three spectra for each side were averaged for a total of two spectra per sample. After collection of NIR spectra, samples underwent a culture experiment to determine if a fusarium infection was present and to verify if the classification of the samples was correct. Various pre-processing methods were applied to the NIR spectra before chemometric analysis. A Partial Least Squares-Discriminant Analysis (PLS-DA) model was used to discriminate between the fusarium infected and normal barley. A PLS-DA model uses arbitrary values of zero and one to classify between two groups. The model predicts a number from the NIR spectrum of the sample and uses that number to classify it. Two separate models were created for the crease side of the hulled barley and the side without a crease.
| PLS-DA with crease | R² = 0.948 | SEP – 0.105 | Accuracy 99.66% |
| PLS-DA without crease | R² = 0.939 | SEP – 0.113 | Accuracy 99.21% |
The results for both models were excellent and proved the feasibility of the discrimination analysis. Correlation coefficients were high and SEP were low for both models. Independent validation predictions showed a very high accuracy. This study showed that NIR spectroscopy has the potential to be used as a fast, non-invasive method for classifying hulled barley based on fusarium infection.
Performance Evaluation of Malt Barley (Hordeum vulgare L.) Varieties for Yield and Quality Traits in Eastern Amhara Regional State, Ethiopia
Archaeological evidence indicates that barley was first cultivated about ten thousand years ago in the Fertile Crescent and it continues to be an important feed, malt, and food crop in many countries all around the world. In Ethiopia, barley is grown in a wide range of environments at altitudes ranging from fifteen hundred to thirty-five hundred meters above sea level. The ratio of malt barley produced to food barley produced is quite small, despite favorable growing conditions and market demand for malt barley from domestic brewers. One brewery imported over fifteen thousand tons of malting barley in a single year. While production is increasing, certain regions and varieties produce more malt barley per hectare than others. Variance in production can be due to many factors, such as low yielding varieties, low and unevenly distributed rainfall, poor agronomic intercrop practices, lack of crop rotation, and disease and pest problems. There are important quality characteristics in barley such as kernel size, kernel protein content, malt extract, and diastatic power. Protein content between 9% and 12.5% is typically acceptable for brewers. If protein is too high, the malt has low extract yield and low protein level barley lacks the enzymes necessary to modify the barley kernel and to break down starch. Different genotypes vary in these characteristics and they are also influenced by environmental factors. Some genotypes may perform well in a particular environment but poorly in others.
There is one particular area of Ethiopia where malt varieties have not been evaluated for yield. It is an important area for barley farmers and especially for malt barley as a large local brewery is located nearby, resulting in increased demand for the product. A study was conducted to identify a high yield, early matured, and high quality malt barley variety in this area. NIR spectroscopy was used with other testing methods to identify a variety that optimizes the quality and quantity standards of the malt barley. Eight separate malt barley varieties were planted during the first week of July with three replications in each of different locations. Standard crop management practices were applied throughout the growing stage and plants were harvested in October. This process was conducted over two different years and growing seasons as well. After harvesting, cleaning, and threshing, one thousand kernel weight was determined as well as other plot-based and plant-based data. Grain quality data was determined using a NIR spectrometer and calibration models for protein, starch, and moisture. This data was used to determine grain yield and the moisture values were used to adjust the grain yield numbers accordingly. While all varieties showed acceptable numbers within the industry standards for one thousand kernel weight, protein, and moisture, three particular varieties were shown to be high yield genotypes and two were shown to be low yield genotypes. In this study, NIR spectroscopy was used as an important tool assisting in the selection of three high yield, optimal kernel size, and good protein content malt barley varieties in an area of Ethiopia where demand for this product is high. Farmers can use this information to improve yield and quality of their products, resulting in improved production.
Classification and Processing Optimization of Barley Milk Production Using NIR Spectroscopy, Particle Size, and Total Dissolved Solids Analysis
Barley is a grain with significant nutritional benefits as it is a very good source of dietary fiber, minerals, vitamins, phenolic acids, and phytic acids. It has become used more often for milk production as a replacement for cow milk as many consumers are looking for an alternative to traditional dairy products. The demand results from medical reasons such as lactose intolerance and cow milk allergy and a lifestyle choice as there is an increased demand for plant-based milk products with no cholesterol. Plant based milk substitutes are manufactured by extracting the plant material in water, removing the solids, product formulation, homogenization, and heat treatment. The resulting products are suspensions which contain plant materials and oils. Research has shown that phase separation, stability, and quality of emulsions in milk and milk products can be successfully measured and characterized using NIR spectroscopy. In this study, NIR spectroscopy was used with other testing methods to determine the optimal processing conditions for barley milk production and classification of finished barley milk. Barley that was produced, harvested, processed, and packed was obtained from a local market for the study. 60 g of the barley was soaked in 90 mL of water for twelve hours. An additional 135 mL of water was added to the soaked barley and blended for 15, 30, 45, and 60 seconds in a blender. The barley milk was then filtered and separated from the spent barley grain. Samples of the barley milk and spent barley grain for each blending time were stored at 4°C until analysis. NIR spectra of both the barley milk and spent barley grain were collected from 904 nm to 1699 nm. Three spectra were collected per sample and averaged into one spectrum. After collection of absorbance spectra, all spectra were processed into first and second derivative. Further tests were conducted for particle size distribution using a laser diffraction method, electrical conductivity, total dissolved solids, and light microscopy to identify particle types and structures present in the samples. The purpose of NIR spectra collection and the subsequent tests was to see if differences in the NIR spectra between the samples with different blending times were clear enough to show that collection of NIR spectra can be used to choose the optimal blending time instead of performing the subsequent tests. Principle Component Analysis (PCA) was first performed to investigate differences in the NIR spectra. Spectra of the barley milk and barley spent grain were clearly separated into two groups and within those groups, the separation between the four blending times was much clearer for the milk than the spent grain. Analysis of particle size distribution values showed little change in particle size diameter (about 25 µm) between samples blended for 45 and 60 seconds. Likewise, there was marked change in electrical conductivity and total dissolved solids from 15 seconds of blending time to 45 seconds but little additional change for 60 seconds. Based on these results, 45 seconds was shown as the optimal blending time for milk and the NIR spectra could be used as an alternative to the other tests because the spectral differences are marked enough to mark the blending time stop point. The benefits of using this information could be enormous. NIR spectroscopy offers the advantages of being fast and non-invasive as well as the ability to provide real-time measurements using optic fibers and a probe. Determining the optimal blending end point quickly in barley milk manufacturing can result in vast amounts of savings in time, energy, and manpower.
In Situ Monitoring of Sugar Content in Breakfast Cereals Using a Novel FT-NIR Spectrometer
Breakfast cereals are widely consumed worldwide because of their easy preparation, nutritional value, and assorted varieties and flavors. Some breakfast cereals are a good source of micronutrients, such as folic acid, vitamin C, iron, zinc, fibers, and antioxidants. However, large amounts of sugar are added to some breakfast cereals which can increase risk of obesity and diabetes as well as reduce the overall nutritional quality. Per FDA regulations, the difference between laboratory analysis of sugars in cereals and the amount declared on the nutrition label must be +/- 20%. Reports indicate that many store bought cereals have a significantly higher or lower sugar content than the label indicates. It is important to monitor and control sugar content of breakfast cereals at every step of the manufacturing process as well as in the final product. Traditional methods for measuring sugar in breakfast cereals often use chromatography or electrophoresis and are expensive, time-consuming, require skilled labor, can use toxic solvents and reagents, and are impractical for monitoring large numbers of samples. NIR spectroscopy was examined for the purpose of determining sucrose, glucose, fructose, and total sugars in breakfast cereals. The particular FT-NIR spectrometer used in this study was a novel prototype instrument with handheld capability and Bluetooth communication with a tablet. One hundred and sixty-four cereal samples were procured for the study. A snack manufacturer provided one hundred and four samples of sucrose coated cereal and the remaining sixty samples were commercial cereals purchased at grocery stores. Samples were ground in a blender to obtain even particle size. NIR spectra were collected from 1350 nm to 2560 nm at 16 nm resolution. NIR spectra were also collected on intact samples for the commercial cereals. Three spectra were collected per sample. Reference values for sucrose, glucose, fructose, and total sugars were obtained using HPLC. Various preprocessing methods were applied to the spectral data before chemometric analysis. Partial Least Squares (PLS) calibration models were created correlating the spectral data to sugar parameters. Results were shown below.
Ground Cereal Samples
| Sucrose | R² = 0.98 | SECV = 1.93% |
| Glucose | R² = 0.94 | SECV = 0.14% |
| Fructose | R² = 0.95 | SECV = 0.25% |
| Total Sugars | R² = 0.98 | SECV = 1.99% |
Intact Cereal Samples
| Sucrose | R² = 0.97 | SECV = 2.42% |
| Glucose | R² = 0.94 | SECV = 0.20% |
| Fructose | R² = 0.92 | SECV = 0.21% |
| Total Sugars | R² = 0.96 | SECV = 2.48% |
The results of this study were excellent and proved the feasibility of using NIR spectroscopy and calibration models to measure sugar parameters in breakfast cereals. Results were similar for both the ground and intact cereal samples and especially when considering there were a smaller number of intact samples used, the study proved that in-line monitoring of sugars during the breakfast cereal manufacturing process is suitable. Interestingly, the comparison of both reference HPLC values and predicted values using the NIR spectroscopic calibration models with the sugar values on the labels in the commercial samples showed that seven of the sixty samples had a much higher sugar value than indicated on the label while one sample had a lower sugar value. This difference reinforces the need for an online, fast, and non-invasive method like NIR spectroscopy for determining sugar parameters in breakfast cereals.
In Situ Monitoring of Sugar Content in Breakfast Cereals Using a Novel FT-NIR Spectrometer – DOAJ
Classification of Cereal Bars Using Near Infrared Spectroscopy and Linear Discriminant Analysis
There is increased demand among consumers for food with low calorie content. However, distinguishing between the meaning of different labels like “natural”, “light”, “diet”, “organic” and “functional” can be quite confusing when trying to select a low calorie food. Light and diet foods can be found in most supermarkets and are labelled as products with low fat, salt, protein, carbohydrates, or sugar contents. Per the National Health Surveillance Agency (ANVISA) in Brazil, the term “light” can be used when the quantity of calories is at least 25% less than the conventional product. “Diet” can be applied to foods with an absence of sucrose/glucose or foods indicated for diets with restrictions of certain nutrients, such as fat, carbohydrates, protein, and sodium. Cereal bars were introduced around twenty years ago and have become very popular as a quick snack with low caloric and high nutritional value. Cereal bars are often high in fibers, vitamins, and minerals and consumers often choose products based on the appearance, package description, and the nutritional information given. However, incorrect information and/or misreading the label can often lead consumers to select cereal bars that are not suitable to their dietary needs. Quality control in cereal bar manufacturing is done through physical and chemical tests which are often time-consuming, expensive, require the use of toxic chemicals and solvents as well as sample destruction, and are impractical for measuring a large number of samples. NIR spectroscopy was examined for the purpose of classifying three different types of cereal bars: diet, conventional, and light. A total of one hundred and twenty-one cereal bars were procured for the study. Thirty-five were diet, forty-four were conventional, and forty-two were light. All samples were crushed and sieved before NIR spectra collection. Samples were scanned from 10000 cm-1 to 4000 cm-1 at a spectral resolution of 8 cm-1. Sixteen scans were collected per reading and averaged into a single spectrum per sample. Ninety samples were used as a calibration set and the remaining thirty-one samples were used for independent predictions. Various pre-processing methods were applied to the spectral data before chemometric analysis. Principle Component Analysis (PCA) was first performed to determine differences in the spectral data and for outlier determination. Linear Discriminant Analysis (LDA) models were used to discriminate between the three types of cereal bars. Numerous models were created using different pre-processing methods and wavenumber ranges selected using various algorithms and the spectra of the independent prediction set were used to classify those samples. The best results are shown below.
LDA Model Using Genetic Algorithm (GA) for Wavelength Selection
28 out of 31 samples correctly classified
Results from the different models greatly varied and indicated that wavenumber selection was very important in obtaining the best results. The GA method is commonly used to generate solutions to optimization and search problems by relying on biologically inspired operators such as mutation, crossover, and selection. However, it must be noted that using different combinations of fifteen hundred wavelength areas extensively is creating a situation where the data fit must come into question. More extensive calibration work would be needed to ensure that the classification was actually based on the cereal bar type and not just from fitting the wavelength range as the ideal set of independent variables. The best model correctly classified twenty-eight of the thirty-one cereal bars, indicating that using NIR spectroscopy for classification of cereal bars has potential as an alternative method to traditional time-consuming and expensive methods for cereal bar quality control and analysis.
The post Cereals & Barley Analysis appeared first on NIR-For-Food.
]]>The post Cheese Analysis appeared first on NIR-For-Food.
]]>Introduction
Cheese is a dairy product derived from milk and is produced in a variety of flavors and textures. It comprises proteins and fat from milk and forms by coagulation of the milk fat casein. The milk is often acidified and the addition of the enzyme rennet causes the coagulation. Most cheeses are made from whole cow milk, with worldwide production of 18.7 million metric tons in 2014. The United States accounts for approximately 29% of this production, with various European countries accounting for most of the rest. Other types of milk used for cheese are skimmed cow, goat, sheep, and buffalo milk. There are approximately five hundred different varieties of cheese recognized by the International Dairy Federation and strict standards are often applied to these different varieties based on many factors. While cheese manufacturing methods can vary greatly for different types of cheese, the constituents and parameters of interest during the manufacturing process are usually similar. Parameters such as fat, protein, moisture, dry matter, and acidity are critical in nearly all types of food manufacturing and these are very important in cheese as well. Cheesemaking is a highly selective skill and the cheesemaker is often reliant on sensory skills and chemical analysis to determine if the cheese being made is going to meet quality standards. After the manufacturing process, aging is also critical for many types of cheese as many physical parameters and flavor are finalized with age. In the case of fresh cheese, proper transport, temperature, and handling are critical as the shelf-life for such cheeses is often very short. Adulteration and authenticity are issues with cheese as well, especially in cheese manufactured in specific regions according to strict standards. Current methods for testing these parameters are expensive, laborious, and time-consuming, especially when implemented in a process setting. The timing aspect is especially critical for cheese because the time of steps as the process progresses can be quite short and there is often little time to make adjustments if needed. There is a need for fast, cost-effective, and real-time monitoring of parameters at all stages of the cheese manufacturing process. One such method that has been examined is NIR spectroscopy.
Analytes
- Dry Matter (DM)
- Fat
- Crude Protein (CP)
- pH
- Penetration
- Protein
- Moisture
- Total Solids
- Sodium Chloride (Salt)
- Total Nitrogen
- Tyrosine
- Tryptophan
- Shelf Life
- Adulteration and Authenticity
- Rind %
- Months of Ripening
Summary of Published Papers, Articles, and Reference Materials

Measurement of chemical parameters in major constituents of cheese for quality control purposes has been studied using NIR spectroscopy. The results of most studies have been promising. One study examined monitoring the following important parameters of processed cheese manufacturing: dry matter (DM), fat, crude protein (CP), pH, and the rheological property penetration. Results were excellent for DM, fat, and CP and are considered good enough for real-time analysis. pH and penetration results are considered good enough for screening purposes. Fat, protein, and moisture are essential components in food manufacturing and cheese is no exception. These parameters were examined in ricotta cheese for NIR spectroscopic analysis, showing excellent results for fat and protein. Results for moisture were not as good but this is likely due to all samples having a high moisture content and a wider range in the sample set will improve results, as moisture is well-known to be a measurable constituent using NIR spectroscopy because of high absorption from water. Curd formation and cutting is an important step in cheese manufacturing. NIR spectroscopy was examined to compare results between regression models for total solids and protein in both non-homogenized and homogenized samples of cheese curds. The results were excellent and comparable for both models, indicating the potential to use NIR spectroscopy as a method for real-time measurements of these parameters in an industrial setting. Another comparative study was conducted to measure fat, protein, and sodium chloride (NaCl) in processed cheese that was both unwrapped and wrapped in polyethylene (PE) film. As was the case with the cheese curd study, the results showed little difference in performing these measurements between the wrapped and unwrapped samples and proved the feasibility of measuring these constituents in processed cheese wrapped in PE film. Aging of cheese is important and many of the main parameters that are measured during cheese manufacturing do not change discernably during the aging process. Total nitrogen and amino acids are two parameters that change with aging and NIR spectroscopy was examined to measure total nitrogen, tyrosine, and tryptophan. Results were good for total nitrogen but a lot of variability was shown during validation analysis for the amino acids. This likely occurred due to reference error and low concentration of the constituents, but there is potential to use NIR spectroscopy as a screening tool for measuring amino acids. Shelf-life of fresh cheese is critical and samples of Crescenza cheese were examined using both FT-NIR and FT-IR spectroscopy to determine the feasibility of classifying this cheese based on shelf-life. Classification analysis showed that both sets of spectral data can determine whether a sample is fresh, aged, or old. Adulteration is a major problem in the food industry and grated cheese samples were examined to determine authenticity based on standards for Parmigiano-Reggiano (PR) cheese in Italy. Results showed that NIR spectra could be used to classify both compliance and non-compliance based on standards and could also distinguish between PR cheese and competitor brands of cheese. Rind % and months of ripening were quantified with reasonable accuracy as well from the NIR spectra and calibration models.
Scientific References and Statistics
NIR Spectroscopy: A Useful Tool for Rapid Monitoring of Processed Cheeses Manufacture – Curda, Kukackova, Journal of Food Engineering 61 (2004) 557-560
Rapid monitoring of processed cheese manufacture is essential to obtain a high-quality product with minimal cost. NIR spectroscopy was examined as a method for assessing dry matter (DM), fat, crude protein (CP), pH, and the rheological property penetration in processed cheese samples. Fifty processed cheese samples from fourteen different Czech producers were procured for the study. Samples were left at room temperature for a minimum of twelve hours before being scanned. NIR spectra were collected using an FT-NIR spectrometer and a fiber optic probe from 900 nm to 2500 nm. Three separate spectra were collected from three different points on each sample and averaged into one spectrum. Standard reference methods were performed on the samples and the NIR spectra and reference values were used to create Partial Least Squares (PLS) regression models to correlate the spectra to the parameters of interest. Various pre-processing methods and selective wavelength ranges were used to optimize the calibration models.
| DM | R² = 0.998 | RMSEP= 0.429% |
| Fat | R² = 0.995 | RMSEP= 0.997% |
| CP | R² = 0.996 | RMSEP= 0.303% |
| pH | R² = 0.945 | RMSEP= 0.062 |
| Penetration | R² = 0.925 | RMSEP= 1.330mm |
Both the DM and fat models used the pre-processing method Multiplicative Scatter Correction (MSC) and selective wavelength ranges (1200 nm to 2200 nm for DM and 1000 nm to 2200 nm for fat) for model optimization. CP used no pre-processing but a selective wavelength range from 900 nm to 2400 nm. pH and penetration used the full wavelength range and no pre-processing. Results were excellent for DM, fat, and CP and were good enough to use these models for real-time analysis of manufactured cheese. Results were still good for pH and penetration but are better suited to estimate the values. Cross validation testing indicates that the lower precision for these two parameters is likely due to a small range of values for pH and error in the reference method for penetration.
https://www.sciencedirect.com/science/article/abs/pii/S0260877403002152
Determination of Fat, Protein, and Moisture in Ricotta Cheese By Near Infrared Spectroscopy and Multivariate Calibration – Madalozzo, Sauer, Nagata, Journal of Food Science & Technology, March 2015 52 (3): 1649-1655
NIR spectroscopy was examined as a method for determining fat, protein, and moisture in ricotta cheese without any complex sample preparation. Nineteen samples of ricotta from different manufacturers in the southern region of Brazil were procured for the study. Sample varieties were fresh, pressed, conventional, and low-fat. Each sample was cut to provide a flat surface representative of the interior. NIR spectra were collected in diffuse reflectance mode from 1100 nm to 2500 nm using 1 nm resolution. Two different portions of each sample were scanned for thirty-eight total spectra. Thirty-three spectra were used for a calibration set and the remaining five were used for a validation set. Standard reference methods were performed on the samples to obtain fat, protein, and moisture values. Reference values and the NIR spectra were used to create Partial Least Squares (PLS) calibration models correlating the spectral data to the parameters of interest.
| Fat | R² = 0.968 | RMSEP= 1.3% |
| Protein | R² = 0.968 | RMSEP= 0.7% |
| Moisture | R² = 0.851 | RMSEP= 2.7% |
There was a large amount of variability observed in the reference tests for the samples among the same varieties of samples, especially for fat and protein. While this variability is good for creating regression models, it does lend concern to commercial samples because ricotta is often used by people with dietary restrictions. Correlation was excellent for fat and protein and the validation set predictions proved the validity of the models. In the case of moisture, the variability in samples was lower but all samples surpassed the high moisture threshold of 55% for classification by Brazilian standards. A sample set with a wider range of values should improve the moisture model. Overall, this study proved the feasibility of using NIR spectra and regression models to determine fat, protein, and moisture in ricotta without using wet chemistry methods and requiring minimal sample preparation.
https://www.ncbi.nlm.nih.gov/pmc/articles/PMC4348305/
Using Near Infrared Spectroscopy for the Determination of Total Solids and Protein Content in Cheese Curd – Sultaneh, Rohm, International Journal of Dairy Technology, Volume 60, No.4, November 2007
Curd formation followed by curd cutting is considered to be one of the most essential steps in cheese manufacturing. Continuous information about the composition of cheese curd during processing (such as during drainage on conveyor belts between the cheese vat and pre-pressing unit) could help control the cheesemaking process, leading to improvements in quality. One previous study did measure total solids and protein in cheese curd but required excessive sample preparation that would not be applicable to on-line or in-line analysis. NIR spectroscopy was examined as a method for measuring total solids and protein in native unhomogenized cheese curd. A total of two hundred forty-two cheese curd samples were prepared in the laboratory for the study. Variation in total solids and protein was created by changing the intensity and duration of curd cutting as well as variation in scalding temperature and scalding time. After sample preparation and draining of the curd, NIR spectra were collected from 12000 cm-1 to 2000 cm-1 in diffuse reflectance mode. Thirty-two scans were averaged into one spectrum and collected at 8 cm-1 spectral resolution. Three individual spectra were collected in this manner on different portions of each sample. In order to compare the effect of homogenizing the samples, each sample was mixed together for one minute and the spectra collection process was repeated to create two different data sets. Standard reference methods were performed on the samples to obtain reference values for total solids and protein. Two sets of regression models were created for both total solids and protein using the NIR spectra and reference values.
Unhomogenized:
| Total Solids | R² = 0.994 | RMSEP= 0.502% |
| Protein | R² = 0.985 | RMSEP= 0.548% |
Homogenized:
| Total Solids | R² = 0.997 | RMSEP= 0.388% |
| Protein | R² = 0.992 | RMSEP= 0.381% |
While the results are slightly improved for the homogenized samples, the improvement is minimal and high correlation was obtained for both total solids and protein for both data sets. Predictions from a validation set proved the feasibility of the calibration models as a method for determining total solids and protein in cheese curd. Because of the minimal sample preparation, this study shows that NIR spectra and regression models could be used for industrial, real-time, on-line measurement of parameters of interest in cheese curd during the cheese manufacturing process.
https://onlinelibrary.wiley.com/doi/full/10.1111/j.1471-0307.2007.00347.x
Non-Destructive Determination of Components in Processed Cheese Slice Wrapped with a Polyethylene Film Using Near-Infrared Spectroscopy and Chemometrics – Pi, Shinzawa, Ozaki, Han, International Dairy Journal 19 (2009) 624-629
NIR spectroscopy was examined as a method for determining fat, protein, and sodium chloride in processed cheese slices that are wrapped in polyethylene (PE) film. Processed cheese is often covered in plastic wrapping to preserve quality and prolong shelf life. Fifty-one batches of processed cheese slices were obtained from commercial markets for the study. Each batch contained ten slices and all slices were wrapped in 25 µm thick PE film. NIR spectra of the wrapped samples were collected using an FT-NIR spectrometer in diffuse reflectance mode from 1000 nm to 2500 nm at 2 nm intervals. Thirty-two scans were averaged per spectrum. Three random points were chosen on each sample for this process and the three spectra for each sample were averaged into one spectrum as well. For comparative purposes, each sample was unwrapped from the PE film and this process was repeated. Reference values were obtained for fat, protein, and salt using traditional methods. A second derivative pre-processing was performed on both sets of spectra before chemometric modeling. Second derivative processing helps remove scattering due to non-homogenous distribution of particles, enhances peak separation, and can remove undesirable effects from baseline drift and slope. Forty-one spectra for each data set were used to build calibration models and the remaining ten spectra were used for a validation set.
With PE Film:
| Fat | R² = 0.984 | RMSEP= 0.625% |
| Protein | R² = 0.999 | RMSEP= 0.355% |
| Salt | R² = 0.991 | RMSEP= 0.105% |
Without PE Film:
| Fat | R² = 0.990 | RMSEP= 0.598% |
| Protein | R² = 0.998 | RMSEP= 0.308% |
| Salt | R² = 0.998 | RMSEP= 0.092% |
Visual comparison of the NIR spectra of the wrapped and unwrapped samples did show some contribution from the PE film in the wrapped samples, especially in the C-H vibrational absorbing areas of the NIR wavelength range. However, the effects of scattering were removed by the second derivative processing. Prediction values on the validation sets proved the feasibility of both models for measuring the parameters of interest. It must be noted that NaCl does not directly absorb in the NIR wavelength range. However, the high correlation indicates that the measurement is valid. Most likely, the salt has an effect on water molecules which is readily measurable using NIR spectra. Analysis of regression coefficients showing the relevant wavelength ranges for the calibration indicates this is the case. An indirect measurement of a component from NIR spectra is acceptable but must be carefully examined and validated. The results indicate that not only parameters in cheese can be measured when wrapped in PE film, but the potential exists for measuring other products wrapped in film as well by using NIR spectra with second derivative processing and reference values for the constituents of interest.
https://www.sciencedirect.com/science/article/abs/pii/S095869460900096X
Application of Near Infrared Spectroscopy to Estimate Selected Free Amino Acids and Soluble Nitrogen During Cheese Ripening – Mlcek, Rop, Dohnal, Sustova, ACTA VET. BRNO 2011, 80: 293-297
The composition of young cheese is a key to aging but the traditional main components are relatively stable during the aging process and thus not a good indicator of the course of ripening as cheese ages. Cheese acquires its typical taste, smell, consistency, and appearance over the course of aging due to fermentation processes. One important barometer for this process is the type and quantity of free amino acids, which influence taste and provide information about the state and progression of aging. NIR spectroscopy was examined as a method for determining soluble nitrogen and two important amino acids (tyrosine and tryptophan) in Edam cheese. Samples were obtained from two different dairy factories, each providing four different types of Edam cheese with different values for dry matter and different starter cultures. Three portions of each sample were used for a total of two hundred eighty-eight separate portions for the analysis. The samples were aged for six months and at monthly intervals, both NIR spectra and reference tests for the parameters of interest were obtained. NIR spectra were collected from 12500 cm-1 to 2000 cm-1 in reflectance mode. Eighty scans were averaged per spectrum and spectral resolution was 4 cm-1. For reference values, samples were prepared for UV spectrophotometric analysis and values were obtained by the traditional method for each parameter of interest. After all data was collected over six months, Partial Least Squares (PLS) regression models were created using the NIR spectra and reference values.
| Total Nitrogen | R² = 0.911 | RMSEP= 1.33% |
| Tryptophan | R² = 0.929 | RMSEP= 0.00292 mg/100g |
| Tyrosine | R² = 0.959 | RMSEP= 0.00705 mg/100g |
While the models did show good correlation, predictions obtained during cross-validation analysis showed very high variability, indicating that the models may not be suitable for real-time analysis. One possible reason for this is error in the UV reference method. It must be noted that the concentrations of tryptophan and tyrosine are below the threshold of measurement using NIR spectroscopy. Most likely, the models are correlating to another parameter which may or may not be affected by a change in the two amino acids. Before these models can be considered for real-time use, they must be further validated and carefully examined to determine the validity of the measurement. Despite this, the results offer promise for using NIR spectroscopy as a tool for estimating the degree of ripeness in Edam cheese as well as selecting a raw optimum material for making processed cheeses.
https://actavet.vfu.cz/media/pdf/avb_2011080030293.pdf
Application of FT-NIR and FT-IR Spectroscopy to Study the Shelf-Life of Crescenza Cheese – Catteneo, Giardina, Sinelli, et al., International Dairy Journal 15 (2005) 693-700
Crescenza cheese covers more than 40% of the Italian fresh cheese market and is produced only from whole cow milk. It is a fresh cheese and the components that are associated with its freshness are low acidity, limited proteolysis, and no bitter taste. Both FT-NIR and FT-IR spectroscopy were examined as methods for evaluating the shelf-life period for freshness in Crescenza cheese. Two different types of Crescenza made in the same industrial plant but using different technologies were procured for the study. The two types differed in their fat composition and starter components used during manufacturing. Samples were analyzed at different times over twenty days. FT-NIR spectra were collected from 12000 cm–1 to 4000 cm-1 averaging sixteen scans per spectrum at 16 cm-1 resolution. An optical probe was used to collect the spectra and measurements were collected in replicates varying from four to eight. FT-IR spectra were collected in duplicate for each sample from 4000 cm-1 to 600 cm-1 using an ATR crystal as a background. Sixteen scans were averaged per spectrum and 4 cm-1 spectral resolution was used. After spectra were collected, chemical and physiochemical analyses were performed to determine pH, Dry Matter (DM), Titratable Acidity (TA), and Hue (a color measurement) for each sample to determine thresholds for when sample quality has become poor. Based on this analysis, the samples were found to maintain freshness for six days, an significant decrease in freshness for the next few days, and an unacceptable freshness level for human consumption after eight to nine days. Various pre-treatments were performed on both the FT-NIR and FT-IR spectra and Principle Component Analysis (PCA) showed a clear grouping between these three thresholds. Samples could be clearly grouped from both sets of data into “Fresh”, “Aged”, and “Old” groups from the PCA scores plot. The results here indicate that both FT-NIR and FT-IR spectra can be used as a classification tool to determine the shelf-life of Crescenza cheese.
https://www.sciencedirect.com/science/article/abs/pii/S0958694604003115
Screening of Grated Cheese Authenticity by NIR Spectroscopy – Cevoli, Fabbri, Gori, et al., Journal of Agricultural Engineering 2013; volume XLIV(s2):e53
Parmigiano-Reggiano (PR) cheese is one of the oldest traditional cheeses produced in Europe and has a Protected Designation of Origin in Italy. It is manufactured exclusively from whole PR wheels that correspond to the production standard. Grated PR cheese must be matured for a period of twelve months and characterized by a rind content of less than 18%. NIR spectroscopy was examined as a method for determining the authenticity of PR grated cheese. Four hundred samples were procured for the study with the following classifications: Compliance PR, Non-Compliance PR, PR with Rind Content > 18%, and Competitors (various commercial brands of grated cheeses obtained from local markets). NIR spectra were collected using an FT-NIR spectrometer in diffuse reflectance mode from 12500 cm-1 to 4000 cm-1. Thirty-two scans were averaged per spectrum and 8 cm-1 spectral resolution was used. Three replicate spectra were collected per sample. Various pre-processing treatments were performed on the NIR spectra. Principle Component Analysis (PCA) was first performed as an exploratory tool to define discrimination between Compliance and Non-Compliance PR samples or Competitors. Artificial Neural Network (ANN) models were created using software to test the feasibility of predicting each specific class from the spectral data. Reference values of Rind % and Months of Ripening were used with the NIR spectra to create Partial Least Squares (PLS) regression models for predicting these values from the spectra.
ANN:
| Compliance PR Classification | 100% for Training Set | 100% for Validation Set |
| Competitors Classification | 100% for Training Set | 95.5% for Validation Set |
| Non-Compliance PR Classification | 100% for Training Set | 100% for Validation Set |
| Rind Content > 18% Classification | 100% for Training Set | 100% for Validation Set |
PLS:
| Rind % | R² = 0.982 | RMSEP= 1.473% |
| Months of Ripening | R² = 0.986 | RMSEP= 0.805 |
 The results obtained in this study for both types of models were excellent and confirmed the ability of NIR spectroscopy to be used as a screening tool for determining grated cheese authenticity. The ANN model was able to 100% predict compliance or non-compliance in PR samples and detect competitor grated cheese at with an accuracy at above 95%. More competitor samples in the model will likely improve these results. In the case of PLS, the results were especially good considering there was some question in the reference values for rind %. A regression model can only predict within the error of the reference method and these results should improve as well with more accurate reference testing. Ripening can be predicted to within an accuracy of less than one month. NIR spectroscopy can be used as a fast, non-destructive screening tool for determining the authenticity of grated cheese.
The post Cheese Analysis appeared first on NIR-For-Food.
]]>The post Cocoa & Chocolate Analysis appeared first on NIR-For-Food.
]]>Introduction
Cocoa beans are the raw material for making cocoa powder, cocoa butter, and chocolate. They are seeds from the tropical cacao tree and are grown in areas of the world within 20° latitude of the Equator. Cocoa powder is the leftover component after cocoa butter has been extracted from chocolate liquor, which is made by grinding roasted cocoa beans into a liquid state. Chocolate is made from the chocolate liquor and cocoa butter after removing the cocoa powder. Other ingredients are added as well, including sugar, milk in milk chocolate, and vanilla in some types of chocolate. World production of cocoa was 3,455,622 metric tons in 2013 and is projected to grow to a $2.1 billion value with a CAGR of 3.1% by the end of 2019. The chocolate market is projected to grow to $131.7 billion with a CAGR of 2.3% by the end of 2019. Factors driving growth include larger markets in developing countries, increasing urbanization and widespread availability, new applications in food and confectionary products, and increased sales of seasonal, festive, and niche chocolate products. Proper quality control at all stages of the cocoa & chocolate manufacturing process is essential for a good finished product. Parameters of interest in cocoa beans include protein, fat, moisture, ash, carbohydrates, and color measurements. It is important to properly classify varieties of beans as well as different varieties have a large impact on the physical and chemical properties of the final product. Fermentation level of beans is a strong indicator for evaluating dry cocoa quality. Mixtures and formulas during the chocolate manufacturing process are proprietary and are always kept as a closely guarded secret by chocolate makers. The final stage in chocolate manufacturing is tempering, which entails heating and cooling the chocolate to change different cocoa butter crystallization patterns that form into the desired final crystallization structure. The physical parameters that need to be monitored for optimization of this process cannot be monitored in real-time by current methods. Current methods for testing parameters of interest in cocoa and chocolate are expensive, laborious, and time-consuming, especially when implemented in a process setting. In-line monitoring is impractical and sometimes impossible. There is a need for fast, cost-effective, and real-time monitoring of parameters at all stages of the cocoa & chocolate manufacturing process. One such method that has been examined is NIR spectroscopy.
Analytes
- Protein
- Moisture
- Fat
- Ash
- Carbohydrates
- Color (Lightness, Redness, Yellowness)
- Varietal Classification
- Fermentation Index
- pH
- Total Polyphenols
- Ammonia Nitrogen
- Viscosity
- Enthalpy
- Slope (Second point of inflection of a temper curve)
Summary of Published Papers, Articles, and Reference Materials
 Measurement of chemical parameters in major constituents of cocoa and chocolate for quality control purposes has been studied using NIR spectroscopy. The results of most studies have been promising. One study examined measuring various chemical and physical parameters in cocoa beans as well as classifying them based on variety. The study also compared results for calibration models made from both intact and ground beans. Results show classification of cocoa beans is feasible using differences in NIR spectra and that protein, moisture, fat, ash, carbohydrates, and color parameters could all be quantitatively measured from NIR spectra and calibration models. Another study assessed using both NIR spectroscopy and Electronic Tongue (ET) sensor measurements in combination to classify cocoa beans. 100% correct classification of beans was achieved using data from both technologies and modeling algorithms. Two separate studies evaluated measuring quality and fermentation parameters in cocoa beans using NIR spectroscopy. The first study assessed three important quality parameters: fermentation index, pH, and total polyphenols. Fermentation index and pH are direct fermentation measurements while total polyphenols are a good indicator of antioxidants. Results were good enough for screening purposes but would likely improve with a larger sample set and wider range of values. The second study measured ammonia nitrogen in cocoa beans, considered a good indicator of fermentation time. Results were excellent and showed high correlation between the NIR spectra and calibration model, showing the potential to replace the expensive and time-consuming Conway reference method with NIR spectroscopy. Tempering is one of the most crucial parts of the chocolate making process and NIR spectroscopy was examined as a method for measuring physical parameters related to rheological data that are directly affected by input variables of the crystallizer. Good correlations were obtained for viscosity, enthalpy, and slope (a measurement related to the temper curve), indicating that NIR spectroscopy has the potential to be used as a real-time process control tool for optimizing the tempering process.
Scientific References and Statistics
Classification and Compositional Characterization of Different Varieties of Cocoa Beans by Near Infrared Spectroscopy and Multivariate Statistical Analysis – Barbin, Maciel, Bazoni, et al., Journal of Food Science and Technology, July 2018 55(7): 2457-2466
Cocoa beans of different varieties present inherent challenges in assessing compositional information for quality control and monitoring of processing activities after harvesting. The use of genetic breeding to develop high resistance to plant diseases has made the assessment of compositional information even more challenging. NIR spectroscopy was examined as a method for differentiating varieties of cocoa beans and assessing chemical and physical parameters of interest. Parameters in the study were protein, fat, moisture, ash, carbohydrates, and three different color measurements (lightness – L*, redness – a*, and yellowness – b*). Five different varieties of cocoa beans ranging from fourteen to eighteen fruits each were procured for the study. All samples were processed through the standard procedure of breaking the pod, fermentation for five days, and sun-drying for seven days before analysis. NIR spectra were collected in reflectance mode on the intact beans from 400 nm to 2498 nm at 2 nm intervals. A portion of each sample was ground and the NIR spectra collection process was repeated. Standard methods were used to determine reference values for the parameters of interest. Chemometric models were created using the NIR spectra for both the intact bean and ground samples for comparative purposes. Principle Component Analysis (PCA) was first performed to assess the feasibility of classifying the different varieties of cocoa beans from the NIR spectra. Partial Least Squares (PLS) regression models were created to correlate the NIR spectra to each individual parameter of interest. For the color parameters, only the ground bean NIR spectra were used for PLS analysis. Various pre-processing methods were applied to the NIR spectra before modeling and the results below show the best models obtained for classification and each individual parameter.
PCA
Intact Beans: 98% of Variance Explained by Three Principle Components
Ground Beans: 98% of Variance Explained by Three Principle Components
PLS
Intact Beans:
| Protein | R² = 0.99 | RMSEP= 0.18% |
| Moisture | R² = 0.98 | RMSEP= 0.17% |
| Fat | R² = 0.98 | RMSEP= 0.42% |
| Ash | R² = 0.97 | RMSEP= 0.05% |
| Carbohydrates | R² = 0.96 | RMSEP= 0.36% |
Ground Beans:
| Protein | R² = 0.98 | RMSEP= 0.14% |
| Moisture | R² = 0.98 | RMSEP= 0.17% |
| Fat | R² = 0.99 | RMSEP= 0.25% |
| Ash | R² = 0.96 | RMSEP= 0.06% |
| Carbohydrates | R² = 0.99 | RMSEP= 0.22% |
| L* | R² = 0.87 | RMSEP= 0.79 |
| a* | R² = 0.88 | RMSEP= 0.37 |
| b* | R² = 0.96 | RMSEP= 0.56 |
Modeling results were excellent for all parameters and proved the feasibility of using NIR spectroscopy as a method for classifying cocoa beans and measuring parameters of interest for quality control. Principle Components in a PCA model are iterations that use differences in the data set to see if variation can be explained. In this case, 98% of the variance is explained using three Principle Components in both PCA models proves that enough difference exists in NIR spectra of different bean varieties to use the spectra to classify them. In the case of the PLS models, the difference in the results between the ground bean and intact bean models was statistically insignificant. In a real-time setting, a sampling system requiring no grinding of the samples is preferable and would keep sample preparation of the beans to a minimum. In the case of the color measurement models, the results were worse than the chemical parameter models but this is likely due to a lack of homogeneity in the color of the samples, even when ground. In order to use these models on a universal level for cocoa beans, more samples and varieties must be added, but the potential for using NIR spectroscopy for cocoa bean analysis and quality control was shown in this study.
https://link.springer.com/article/10.1007/s13197-018-3163-5
Integrating NIR Spectroscopy and Electronic Tongue Together with Chemometric Analysis for Accurate Classification of Cocoa Bean Varieties – Teye, Huang, Takrama, Haiyang, Journal of Food Process Engineering 37 (2015) 560-566
NIR spectroscopy and Electronic Tongue (ET) were examined together as a method for classifying cocoa bean varieties. An ET sensor uses seven potentiometric chemical sensors that all differ in the five tastes: sourness, saltines, sweetness, bitterness, and savory. One gram of each sample is weighed and 100 mL of boiled distilled water is added. Samples are cooled, filtered, and the filtrate is used for ET analysis. Five varieties of twenty samples each of cocoa beans were procured for the study. All samples were ground and sieved before both NIR and ET analysis. NIR spectra were collected from 10000 cm-1 to 4000 cm-1 at 3.856 cm-1 interval using 8 cm-1 resolution. Thirty-two scans were collected and averaged into one spectrum for each sample. After ET analysis, different algorithms were performed on both the NIR and ET data. Standard Normal Variate (SNV) treatment was performed on the NIR spectra to remove slope variation and scatter effects. After SNV transformation, the wavenumber range from 9500 cm-1 to 7500 cm-1 was chosen for further analysis. Principle Component Analysis (PCA) was performed for the selection of optimum variables from both the NIR spectra and ET data. Support Vector Machine (SVM) is a non-linear supervised pattern recognition method that was used to create classification models from the NIR spectra, ET data, and the combination of NIR spectra and ET data after data fusion. Data fusion was performed after PCA on both sets of data to choose the optimum variables. Both sets were scaled by normalization and merged as one input for the SVM model. Out of the one hundred total samples, sixty-five were used for the classification models and thirty-five were used for a validation set.
SVM:
| NIR Data Correct Classification | 92.0% |
| ET Data Correct Classification | 80.0% |
| Combined NIR and ET Data Correct Classification | 100.0% |
The best results were shown using the combined data set after PCA and SVM modeling. SVM is particularly used for non-linear techniques and reference values obtained on samples for protein, ash, pH, and moisture showed a marked difference in those values for the different varieties of samples. The potential was shown in this study for an accurate and rapid solution to classification problems in cocoa beans using both NIR spectroscopy and ET analysis. Such analysis could be a useful tool in both quality assurance of beans and development of breeding programs.
https://onlinelibrary.wiley.com/doi/abs/10.1111/jfpe.12109
Non-Destructive Determination of Cocoa Bean Quality Using FT-NIR Spectroscopy – Sunoj, Igathinathane, Visvanathan, Computers and Electronics In Agriculture 124 (2016) 234-242
Adulteration is a big problem in the food industry and cocoa beans are no exception. Assessing bean quality and variety is important as beans can vary in their chemical composition. Misrepresenting a higher quality bean variety with a lower quality bean is one potential form of adulteration. Another form of adulteration is to mix under-fermented beans with ones that are fermented to the proper state. Three important quality parameters are fermentation index, pH, and total polyphenols. Fermentation index directly measures degree of fermentation. Unfermented beans have a pH of 5.5-5.8 while properly fermented beans have a pH of 4.75-5.19. Polyphenols serve as an antioxidant, adding to the nutritional value of beans as well as imparting astringency and bitterness. NIR spectroscopy was examined a method for determining these three quality parameters in cocoa beans. Ripe cocoa pods were directly procured after harvesting for the study. Four portions of fifty pods each were stored at ambient temperature and relative humidity for a period of zero, seven, fourteen, and twenty-one days. At the end of each period, the fifty pods were split open and fermentation was initiated. For each day of fermentation (over six days), 150 g of sample was pulled for collecting NIR spectra and reference test analysis. NIR spectra were collected using an FT-NIR spectrometer from 12500 cm-1 to 3600 cm-1 averaging sixty scans per spectrum at 8 cm-1 resolution. Various pre-treatments were performed on the NIR spectra before Partial Least Squares (PLS) chemometric analysis and standard reference methods were used to obtain values for fermentation index, pH, and total polyphenols.
| Fermentation Index | R² = 0.88 | RMSEP= 0.06 |
| pH | R² = 0.76 | RMSEP= 0.26 |
| Total Polyphenols | R² = 0.84 | RMSEP= 0.93 mg/g |
The study demonstrated the potential for measuring fermentation index, pH, and total polyphenols using NIR spectra and PLS calibration models. While correlation coefficients for the models was not particularly high, independent predictions using cross-validation generally agreed with the reference values. Results should improve with more samples and a larger range of reference values. The small range of values for pH very likely contributed to poorer results than those shown for fermentation index and total polyphenols. It is estimated that performing reference tests for these three parameters would take approximately twenty-eight hours. Using NIR spectroscopy to measure them would take approximately a minute, justifying continued work and study of the feasibility of the NIR method.
https://www.sciencedirect.com/science/article/pii/S0168169916301284
Near Infrared Spectroscopy as a New Tool to Determine Cocoa Fermentation Levels Through Ammonia Nitrogen Quantification – Hue, Gunata, Bergounhou, et al., Food Chemistry 148 (2014) 240-245
Fermentation is a key step in producing quality cocoa. In the experience of cocoa and chocolate manufacturers, a direct correlation exists between the level of ammonia nitrogen (NH3) and fermentation level, making ammonia nitrogen a good fermentation marker. It has also been demonstrated that ammonia nitrogen level varies in beans of different geographical origin. Because of this, manufacturers must refer to their own background knowledge to determine the fermentation level when assessing proper conditions for optimum fermentation of beans. The current reference test used for determining ammonia nitrogen is the Conway method, which is expensive and time-consuming. A fast, non-invasive technique for determining ammonia nitrogen would be useful for manufacturers and NIR spectroscopy was examined for this purpose. Over thirty total micro-fermentation trials were carried out in seven different countries for the study. The standard fermentation technique for cocoa beans was implemented over six days for each trial. Samples were stirred at various points during fermentation and pulled from various sections of the fermentation boxes. Temperature was monitored for most of the samples. In total, seven hundred eighteen samples were created during the trials. Of these, one hundred and ninety were chosen for wet chemistry and NIR analysis according to a design of experiment conducted to determine the optimum sample set encompassing different variables such as temperature and box positioning. NIR spectra were collected in reflectance mode from 400 nm to 2500 nm in 2 nm intervals averaging 32 scans per spectrum. The Conway method was used to obtain reference values for ammonia nitrogen, with samples ranging from 25 ppm to 441 ppm. A Partial Least Squares (PLS) model was created using the NIR spectra and reference values.
| Ammonia Nitrogen | R² = 0.975 | RMSEP= 16 ppm |
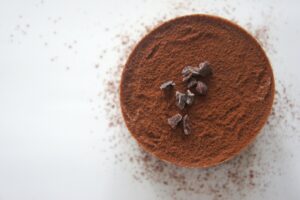 The model results showed excellent correlation between the NIR spectra and reference values for ammonia nitrogen, indicating that NIR spectroscopy can be used as a reliable and efficient method for determining ammonia nitrogen content in cocoa beans. Statistical analysis confirmed that ammonia nitrogen is produced during fermentation of the beans. The amount produced is a function of fermentation, sum of temperatures, and geographical origin. The robust design of this study obtained a good picture of fermentation heterogeneity. However, it must be noted that because of the small concentration of ammonia nitrogen, it is likely that the PLS model is using an indirect correlation with another physiochemical change related to the change in ammonia nitrogen. It is also possible that this indirect correlation is a direct measurement of fermentation. While indirect correlations in regression models are acceptable in NIR spectroscopy, such models must be carefully examined and validated to prove that the correlation is reliable. Adding more samples from different parts of the world to the study will increase the robustness of the model and give farmers a tool to manage fermentation in real-time as well as provide a quality control screening tool for cocoa and chocolate manufacturers when purchasing cocoa beans.
https://www.sciencedirect.com/science/article/pii/S0308814613014374
In-Line Measurement of Tempered Cocoa Butter and Chocolate by Means of Near-Infrared Spectroscopy – Bolliger, Zeng, Windhab, JAOCS, Vol. 76, no. 6 (1999)
Tempering is one of the main process steps for determining product quality in chocolate manufacturing. The objective is to produce cocoa butter crystal nuclei in the preferred modification for ideal texture and melting point. It has been shown that in a shear crystallizer, the mechanical energy input has a significant influence on viscosity, enthalpy, and slope (defined as the second point of inflection of a temper curve). Defined relationships exist between rheological data and temper curve measurements but obtaining this rheological data in real-time is impractical. NIR spectroscopy was examined as a method for determining viscosity, enthalpy, and slope in pre-crystallized cocoa butter. A crystallizer was set up using the standard tempering method for the study. Mass flow, rotor speed, and outlet temperature were all set and monitored through the process. The constant cooling temperature was varied during the runs. Samples were pulled directly from the process and NIR spectra were immediately collected after a crystal had nucleated. Samples were scanned from 1000 nm to 2500 nm using a reflectance probe. There was a 5 mm gap between the end of the probe and reflection surface where the samples were placed. After the NIR spectra were collected, viscosity, enthalpy, and temper curve values were obtained using standard reference methods. Partial Least Squares (PLS) regression models were created using the NIR spectra and reference values for the parameters of interest.
| Viscosity | R² = 0.970 |
| Enthalpy | R² = 0.975 |
| Slope | R² = 0.945 |
Correlation for all three parameters was excellent and the models were tested in a new set of experiments using a constant outlet temperature of 25°C. Both the viscosity and enthalpy were shown to increase as the rpm of rotor speed accelerated during the tempering process, which is the expected result. At 700 rpm, a peak was reached. Similar results were shown for the slope measurements. It is suggested that the results here indicate that NIR spectra can be correlated with microstructural information related to the size, shape, and quantity of cocoa butter crystals. Further statistical analysis such as selective wavelength ranges correlating to the known regions for overtone vibrations of cocoa butter molecules would help further prove the validity of the correlation. The results here do show the potential for monitoring the tempering process in chocolate manufacturing using NIR spectroscopy.
https://link.springer.com/article/10.1007%2Fs11746-999-0157-5
The post Cocoa & Chocolate Analysis appeared first on NIR-For-Food.
]]>The post Coffee Analysis appeared first on NIR-For-Food.
]]>Introduction

Coffee is one of the most heavily consumed beverages in the world. Quality is closely examined and is a key consideration in commercial trade. It is segmented based on many factors, including source type (Arabica, Robusta, and Liberica), flavored and non-flavored, product types such as whole-bean, powdered, instant, and others, and caffeinated and non-caffeinated. The principal quality parameters include moisture, blend ratio, roasting degree, and caffeine. Moisture content in green coffee beans is strictly regulated in most countries that import and export coffee as improper content can cause quality deterioration and even fungal or mycotoxin contamination that can present a danger to human health. Coffee blending is important to achieve a final product with a given flavor and aroma and this process usually occurs before roasting. Roasting initiates complex chemical changes in coffee beans that are crucial to forming the desired final product. The color of the beans is an important marker in the roasting process and is an indicator of volatile compounds that determine aroma and flavor. Caffeine is an important parameter in coffee as its physiological and psychoactive properties are a big reason why coffee is one of the most popular beverages in the world market. It is also an important compound along with similar alkaloids in determining the quality of coffee. Adulteration is considered a large problem in the food and beverage market and especially so in coffee due to its popularity as well as the range of factors that come into play when determining the desired product to fit consumer demands. Adding adulterants in coffee not only causes financial loss, it can be a threat to consumer health as well. There is a need to measure and determine these quality parameters at all stages of the coffee manufacturing process, from the initial analysis of green coffee beans all the way to determining if the final product of coffee is what is actually being labelled and marketed. Currently methods for testing these parameters such as HPLC are expensive, laborious, and time-consuming, especially when implemented in a process setting. There is a need for fast, cost-effective, and real-time monitoring of parameters at all stages of the coffee manufacturing process. One such method that has been examined is NIR spectroscopy.
Analytes
- Moisture
- Caffeine
- Theobromine
- Instant Coffee
- Plant Fat
- Sugar
- Adulterant % and Identification
- Species Classification
- Defective and Non-Defective Classification
- (Beans and Roasted & Ground Coffee)
- Sensory Properties Scores
- Weight Loss
- Density
- Antioxidant Capacity of Spent Coffee Grounds
- Antioxidant Capacity of Spent Coffee Grounds
- Ethanolic Extracts
- Total Flavonoids
- Total Phenolics
- Color
- Arabica Content (Blend Ratio)
- % Corn Adulterant
Summary of Published Papers, Articles, and Reference Materials
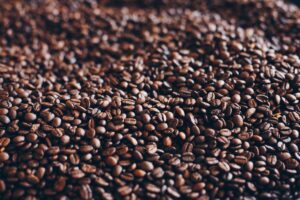 Measurement of chemical parameters in coffee has been studied using NIR spectroscopy and the results of most studies have demonstrated the potential of using NIR as a replacement for expensive and time-consuming wet chemistry methods. A comprehensive review paper is presented discussing various studies and applications for using NIR spectroscopy as a quality control tool for coffee. Topics include prediction of coffee composition, authentication, sample classification, defective and non-defective sample discrimination, sensory properties, roasting degree, and coffee residue analysis. The first step in coffee manufacturing is to ensure the quality of the green coffee beans before roasting and moisture is considered a crucial component in coffee beans. One study examined the feasibility of measuring moisture in green coffee beans with the best results coming from a model using a selective wavelength algorithm to determine the best wavelength ranges for correlating the spectral data with moisture. Species and origin of coffee are of vital importance as well, especially when comparing the higher quality and more expensive Arabica species to the Robusta species. Roasting color is important as well because it is directly related to the sensory properties of the final coffee product and one study examined simultaneously measuring color and blend ratio in roasted coffee. Results were considered good for an initial study, but more data and calibration work would be necessary to apply the models for quality control purposes in an on-line setting. Another study examined the effect of roasting degree on classifying Arabica and Robusta coffee samples, showing excellent results. Caffeine content is not only directly related to coffee quality, but its physiological and psychoactive properties are a big reason why coffee is one of the most popular beverages in the world market. One study examined determining not only caffeine in ground coffee, but two other significant alkaloids as well: theobromine and theophylline. Decent correlation was obtained for caffeine and theobromine, but the detection limit for the concentration of theophylline was below the detectable level of measurement for NIR spectroscopy. Another study used NIR spectra of Arabica coffee samples, reference values for caffeine, and various data pre-treatments and selective wavelength algorithms to optimize regression models for determining caffeine. Results were greatly improved using the best pre-treatment and selective wavelength algorithm, proving the feasibility of using this model to determine caffeine content in Arabica coffee. Adulteration is a huge problem in the food and beverage industry and coffee is no exception to this problem. One study examined determining the percentage of corn adulterant in Brazilian coffee samples by correlating the tocopherol profile to the percentage of corn present in the samples and then creating a regression model from the NIR spectra. Results were excellent and provide a basis for further study that would encompass using different species of coffee and various other adulterants.
Scientific References and Statistics
Application of Infrared Spectral Techniques on Quality and Compositional Attributes of Coffee: An Overview – Barbin, Felicio, Sun, et al., Food Research International 61 (2014) 23-32
This review of infrared spectral analyses and applications in the coffee industry discusses studies which reveal the potential in using these techniques to obtain information about the chemical composition and related properties of coffee. Infrared analysis not only has the ability to quantify and characterize coffee quality attributes from moisture, lipids, caffeine, quality grading, sensory properties, and other important constituents, it can do so in a rapid manner with little sample preparation and while measuring multiple constituents simultaneously. Potential benefits of widespread development of such analysis are discussed as well as the latest research and developments. Below is a breakdown of quality parameters and analysis from the research discussed in the review.
Prediction of Coffee Composition
Several studies have investigated the potential of using spectral applications to measure physical, chemical, and quality parameters of coffee. Moisture content is an important parameter in green coffee beans and raw coffee. Water above 12.5% in coffee beans causes a number of undesirable consequences, such as mycotoxin formation, microbial growth, altered sensory quality, and unstable production conditions. One study examined determining moisture in raw coffee with results acceptable enough for screening purposes.
| Moisture | R² = 0.818 | RMSEP = 0.298 g/100 g |
Caffeine is a very important component in coffee and has been studied in several investigations. Ground Arabica samples at varying roasted levels were analyzed by NIR spectroscopy using spectral data, HPLC reference values for caffeine, and various data treatments and chemometric methods. The best model proved the feasibility of using at-line application to determine caffeine content in unknown roasted coffee samples. Another study measured roasted coffee for multiple alkaloids in both Arabica and Robusta liquid coffee samples after discrimination of the green coffee beans to classify the samples. Liquid Chromatography and Mass Spectrometer reference values were used to correlate the NIR spectra with caffeine, theobromine, and theophylline. Good correlation and prediction values were found for caffeine and theobromine, but the detection limit for theophylline was too low for the NIR calibration model to be acceptable for real use. Another study used diffuse reflectance NIR spectra of liquid coffee beverages as predictors for the three main ingredients in liquid coffee: instant coffee, plant fat, and sugar. Excellent correlation was obtained for all three parameters, proving that NIR spectroscopy can be used to determine these ingredients in liquid coffee.
| Caffeine (Arabica) | R² = Unknown | RMSEP= 0.378 mg/g |
| Caffeine (Arabica & Robusta) | R² = 0.86 | RMSEP= 0.07 mg/g |
| Theobromine (Arabica & Robusta) | R² = 0.85 | RMSEP= 0.10 mg/g |
| Instant Coffee | R² = 0.9897 | RMSEP= 2.12 mg/g |
| Plant Fat | R² = 0.9994 | RMSEP= 0.72 mg/g |
| Sugar | R² = 0.9918 | RMSEP= 2.01 mg/g |
Authentication
Food authentication has become a major issue in recent years and the growth of the coffee market has made coffee a target for many different types of adulteration. Adulteration in coffee can take on multiple forms. A substance that is not coffee at all can be mixed in, such as chicory, malt, figs, cereals, caramel, starch, maltodextrins, or glucose. Coffee is often marketed as being distinct to a particular region and misrepresenting the origin of a coffee product is another form of adulteration. The Arabica coffee bean is considered superior to the Robusta bean and labeling a lower quality coffee product as a higher quality species or blend is also considered adulteration. Spectroscopic techniques have been studied as methods for identifying adulteration in coffee. One study used nine commercial roasted and ground coffee samples to identify differences in the NIR spectra as a basis for classification. Barley samples were then blended into the coffee at a range of 2% to 20% weight per weight of coffee to examine the feasibility of identifying barley adulterant in commercial coffee. Low prediction errors were obtained and the results show promise for future applications to identify and quantify adulterants in coffee. Another study used diffuse reflectance spectra of instant coffee samples and samples with various adulterants added, such as glucose, starch, and chicory. Various classification techniques were applied and an artificial neural network (ANN) model was able to classify adulterated and non-adulterated samples with a 100% success rate.
| Identifying Adulterated Samples (Instant Coffee) | 100% Correct Classification |
Classification of Samples According to Coffee Variety and Quality Features
In general, the Arabica coffee bean is considered superior to Robusta and is the more expensive and higher quality of the two beans. NIR spectroscopy has been examined in various studies as a method for discriminating and characterizing these two blends with relative success. A few studies have examined lyophilized and vacuum-dried samples for discrimination analysis. Notable spectral differences were discovered in the caffeine absorbing areas of the NIR spectrum, implying that there is a difference in caffeine between Arabica and Robusta that could be used to as a basis to classify the two blends. Classification rates were good enough to use this analysis for screening purposes. Another study used NIR spectra of various blends and Partial Least Squares (PLS) analysis to predict Robusta content, showing accurate results but as a limited study, more data encompassing the natural variety that exists in coffee (e.g. geographical origin, roasting degree) would be necessary to use this model in a practical setting. Another form of classification analysis that has been examined is classifying roasted coffee grain samples from different lots and producers in a given region using NIR spectra. One such study conducted in Brazil showed that NIR spectroscopy can be a useful tool in differentiating roasted coffee grains.
Classifying Arabica and Robusta Dried Beverage:
| Lyophilized | 87% |
| Vacuum-Dried | 95% |
Discrimination Between Defective and Non-Defective Samples
Assessing bean quality in coffee is based on discovering the relative amount of defective beans among non-defective ones. One methodology that has been studied to implement such a quality assessment using NIR spectroscopy compared two Arabica varieties and two Robusta varieties, all from different geographical regions, to determine the presence of defective beans in a batch. A Partial Least Squares (PLS) regression model relating the NIR spectra to the mass fraction of defective and non-defective beans showed correlation good enough for screening purposes. Likewise, Principal Component Analysis (PCA) was applied to spectra of roasted and ground coffee of four different groups (non-defective, black, dark sour, and light sour) to determine the feasibility of separating defective samples (both sour groups) from spectral data. Accuracy of the classification ranged from 95% to 100% depending on the particular model. A similar study used both PCA and cluster analysis to analyze the spectra, enabling separation into two distinct groups: non-defective/light sour and black/dark sour, indicating that the samples considered defective (black, immature, and dark sour) could be separated using spectral data.
| Prediction Error for Non-Defective/Defective Beans (2 Arabica and 2 Robusta varieties): | 5% |
| Classification Accuracy for Discriminating Defective and Non-Defective Roasted and Ground Coffee: | 95% to 100% (Depending on the exact classification grouping and model used) |
Prediction of Sensory Properties
Studies have been conducted to establish a relationship between sensory attributes of coffee, the chemical components of the coffee beans, and NIR spectra. Coffee beverage of roasted Arabica samples and NIR spectra were analyzed using chemometrics to establish a correlation between acidity, bitterness, flavor, cleanliness, body, and overall quality scores. Selective wavelength algorithms determined the relevant wavelength regions for each model. Good correlation was obtained for all models and confirmed the relationship between the chemical composition of the roasted grains and sensory properties is directly related to the NIR spectra of pure caffeine, trigonelline, 5-caffeeoylquinic acid, cellulose, coffee lipids, sucrose, and casein. All these components are related to the different sensory characteristics that were modelled. A similar study was conducted for espresso quality assurance using scores for perceived acidity, mouthfeel (body), bitterness, and aftertaste. Results of calibration models were comparable to evaluations provided by a trained sensory panel, proving the feasibility of using such calibrations as an evaluation tool for coffee sensory properties.
Degree of Roasting
Roasting color and quality parameters are attributes that have been studied using NIR spectroscopy with good results. One such study used spectral data to discriminate between medium and dark roasted commercial coffee samples, both caffeinated and decaffeinated. An external validation set was correctly predicted at a 100% rate. Chemometric analysis showed the wavelengths used for the model and predictions are related to caffeine and moisture, as decaffeinated coffee is known to have a higher moisture content. The relationship between coffee roasting variables like weight loss, density, and moisture and NIR spectra of green (raw) and coffee samples roasted at different levels was investigated in another study in order to predict roasting degree. Robust models were obtained with high correlation coefficients and prediction results were comparable to the reference analyses, proving the feasibility of this application as a tool for on-line analysis of the roasting process. A similar study focused on espresso and roasted coffee correlating NIR spectra to total acidity, caffeine content, chlorogenic acids, and roasted bean color. The regression models showed results good enough to be used for prediction of the listed quality parameters.
| Weight Loss, Density, Moisture | R² = 0.92 to 0.98 for all parameters |
Coffee Residues
Spent coffee grounds contain high levels of bioactive compounds, including flavonoids that have antioxidant properties. One study correlated NIR spectra to antioxidant capacity, total phenolics, and total flavonoids in spent coffee grounds samples. Partial Least Squares (PLS) regression modeling was used to correlate the spectral data to these parameters and results were excellent, with all parameters having a correlation coefficient well above 0.90. Another study used similar methods to measure various lignin components in coffee and banana residues. Correlation was lower than in the previously discussed study but the results did show potential for using NIR spectroscopy to measure these components in both coffee and banana residues.
| Antioxidant Capacity of Spent Coffee Grounds | R² = 0.93 |
| Antioxidant Capacity of Spent Coffee Grounds Ethanolic Extracts | R² = 0.96 |
| Total Flavonoids | R² = 0.95 |
| Total Phenolics | R² = 0.95 |
While conducted mostly on a laboratory scale, the studies documented in this review demonstrate the ability to use NIR spectroscopy for analysis of raw materials, intermediates, finished products, and as a process control tool in coffee. Increased demand for product control of coffee as well as many other liquid foods will require advanced analytical tools and NIR spectroscopy is a proven method for both on-line and at-line monitoring of coffee.
The development of new sensors has facilitated the implementation of NIR spectroscopy as a tool for monitoring the coffee process with successful results.
Rapid Prediction of Moisture Content in Intact Green Coffee Beans Using Near-Infrared Spectroscopy – Adnan, von Horsten, Pawelzik, Morlein, Foods 2017, 6, 38
Moisture is a very important quality parameter in green coffee beans and is strictly regulated by most countries that import and export coffee. The safe range for moisture is from 8% to 12.5% based on fresh matter. Moisture below 8% causes shrunken beans and an unwanted appearance. Moisture above 12.5% facilitates fungal and mycotoxin growth as well as the potential for problems during storage and the roasting process. NIR spectroscopy was examined as a method for measuring moisture content in both Arabica and Robusta green coffee beans. Twelve sets of samples were used for the study: Three Arabica species and four Robusta species of different origins for the calibration set and two Arabica species and three Robusta species of different origins for the validation set. NIR diffuse reflectance spectra were collected from all samples from 1000 nm to 2500 nm at 2 nm intervals. Each individual spectrum consisted of the average of 64 scans. Three replicates were acquired for each sample and these spectra were averaged as well, resulting in 108 total spectra of the 12 different samples. Reference values were obtained for moisture and these were used with the NIR spectra to create Partial Least Squares (PLS) calibration models for moisture content.
| Moisture (Full Wavelength Range) | R² = 0.9850 | RMSEP= 0.57% |
| Moisture (Selective Wavelengths) | R² = 0.9743 | RMSEP= 0.77% |
Two sets of PLS calibration models were created: one using the full wavelength range and the other using seven selective wavelengths that were chosen based on the correlation of the full range model. Some of these are moisture absorbing areas of the NIR spectrum and others correlate to organic compounds affected by a change in moisture: 1155 nm, 1212 nm, 1340 nm, 1409 nm, 1724 nm, 1908 nm, and 2249 nm. Prediction results on the validation set using both models proved the feasibility of the measurement. Results were comparable for both models and either could be applied in an on-line setting to determine moisture in green coffee beans.
Simultaneous Determination by NIR Spectroscopy of the Roasting Degree and Arabica/Robusta Ratio in Roasted and Ground Coffee – Bertone, Venturello, Giraudo, et. Al, Food Control 59 (2016) 683-689
The roasting color of coffee beans and the varietal composition of blends are two crucial factors in sensory properties of brewed coffee. Color is a critical control parameter and is used to verify the performance of the roasting, as there is a direct relationship between color and the desired sensory characteristics of the final product. Blend composition is important because in general, the Arabica species shows better sensory characteristics than the Robusta species, resulting in a marked difference in the market price of the two species. NIR spectroscopy was examined as a method for simultaneously determining both of these important parameters in blended roasted and ground coffee. 130 commercial blends of roasted and ground coffee belonging to both Arabica and Robusta species were used for the study. The samples were of varying worldwide geographical origin and all harvested in the same season. They showed ten different levels of Arabica content ranging from 0% to 100% w/w. One hundred samples were used for the calibration set and thirty were used for a validation set. After roasting and milling, the samples were scanned using an FT-NIR spectrometer from 12500 cm-1 to 3500 cm-1. Spectral resolution was 16 cm-1 and 64 scans were averaged for each individual spectrum. Reference tests were conducted to determine color values and these were used along with the blend ratio values and NIR spectra to create Partial Least Squares (PLS) calibration models.
| Color | R² = 0.87 | RMSEP= 1.28 A.U. |
| Arabica Content | R² = 0.97 | RMSEP= 4.34% w/w |
The results obtained here are considered good enough to use this method as a quality control tool and for fraud identification, but a larger data set and more accurate prediction values would be necessary for application in an industrial setting. A wider data set incorporating more varieties of the two blends as well blends that are individually mixed to create more data points should improve model performance. It is also important to consider the variability between annual blends of coffee and incorporate multiple harvests into the calibration models before implementing such an application in an industrial setting.
Characterization of the Effects of Different Roasting Conditions on Coffee Samples of Different Geographical Origins by HPLC-DAD, NIR, and Chemometrics – De Luca, De Filippis, Bucci, et al., Microchemical Journal 129 (2016) 348-361
The effect of roasting conditions on both the NIR and HPLC profiles of coffee samples was evaluated using various classification algorithms to determine if the roasting degree had a marked effect on determining whether the samples were of Arabica or Robusta origin. Thirty-six samples of green coffee beans (twenty-three Arabica and thirteen Robusta) of different geographical origins were used for the study. Six were analyzed by HPLC while thirty were used for NIR spectroscopic analysis. Each sample was roasted in the laboratory under different conditions trying to reproduce the industrial roasting process. For each sample, NIR spectra were collected at the following roasting times: 0 minutes (green), twenty-five minutes, fifty minutes, and seventy-five minutes. Scan parameters were from 10000 cm-1 to 4000 cm-1 at a nominal resolution of 4 cm-1 and eighty-two scans per average. After data collection, both Partial Least Squares-Discriminant Analysis (PLS-DA) and Soft Independent Modeling of Class Analogies (SIMCA) classification algorithms were used to build models for determining the varietal origin of the coffee beans.
PLS-DA
| Arabica Classification | 100% |
| Robusta Classification | 95% |
SIMCA Specificity:
| Arabica Classification | 96% |
| Robusta Classification | 96% |
The results shown above prove that NIR spectra can be used to classify the species of coffee irrespective of the roasting degree at an accuracy level of 95% or higher. Similar analysis was conducted using the HPLC fingerprints of those samples and results were comparable. The NIR approach allows for authenticating the species of coffee beans with a rapid, low-cost, non-invasive technique and could be implemented as an application for the quality control of coffee beans at all levels of the roasting and manufacturing process.
Analysis of Caffeine, Theobromine, and Theophylline in Coffee by Near Infrared Spectroscopy (NIRS) Compared to High-Performance Liquid Chromatography (HPLC) Coupled to Mass Spectrometry – Huck, Guggenbichler, Bonn, Analytica Chimica Acta 538 (2005) 195-203
NIR spectroscopy was examined as a method for quantifying the three main alkaloids found in coffee: caffeine, theobromine, and theophylline. Eighty-three samples of roasted Arabica and Robusta coffee from different geographical origins were provided for the study and ground before NIR spectra collection. Scan parameters were from 9996 cm-1 to 4500 cm-1 using 12 cm-1 resolution and ten scans per average. Three separate spectra were collected for each sample for a total of two hundred forty-nine spectra. A portion of each sample was used for HPLC analysis to determine the reference values for caffeine, theobromine, and theophylline. Two separate LC analyses were performed: LC-UV (Liquid Chromatography – UV Detection) and LC-ESI-MS (Liquid Chromatography – Electrospray Ionisation Quadrupole Ion Trap Mass Spectrometry). LC-UV was chosen as the reference method for regression models using the NIR spectra to correlate to the three alkaloids of interest.
| Caffeine | R² = 0.86 | Range = 0.95-4.13 g/100 g | RMSEP= 0.40 g/100 g |
| Theobromine | R² = 0.85 | Range = 0.10-0.67 g/100 g | RMSEP= 0.10 g/100 g |
| Theophylline | Concentration below the limit detectable by NIR |
Calibration models for caffeine and theobromine showed correlation and prediction results comparable to the LC-UV reference method that can be considered suitable for screening purposes. In the case of theophylline, the lower limit of detection (LOC) for LC-UV is 0.244-0.60 ng/100 g while the LOD for the NIR method is 0.05 g/100 g, making the analysis of theophylline using NIR spectra impossible. However, the results for the other two alkaloids provide a potential alternative to the more expensive and time-consuming GC method.
Improvement of Near Infrared Spectroscopic (NIRS) Analysis of Caffeine in Roasted Arabica Coffee by Variable Selection Method of Stability Competitive Adaptive Reweighted Sampling (SCARS) – Zhang, Li, Yin, et al., Spectrochimica Acta Part A: Molecular and Biomolecular Spectroscopy 114 (2013) 350-356
NIR spectroscopy was examined as a method for quantitatively determining caffeine content in roasted samples of Arabica coffee. Seventy-two ground coffee samples were procured for the study. NIR spectra were collected from 10000 cm-1 to 4000 cm-1 using 8 cm-1 spectral resolution and thirty-two scans averaged per spectrum. This process was repeated three times for each sample with changing position in the sample holder for each run and all three spectra were then averaged to create one spectral data point. Likewise, the entire process was repeated for each sample, making a total of one hundred forty-four spectra that were used in the study. Sixty-two samples (one hundred twenty-four spectra) were used for the calibration set and ten samples (twenty spectra) were used for the validation set. HPLC-UV analysis was used to determine reference values for caffeine. Various data pre-treatments and selective wavelength analysis were performed on the NIR spectra in order to determine the best data set for Partial Least Squares (PLS) regression analysis.
Stability Competitive Adaptive Reweighted Sampling (SCARS) – PLS Model:
| Caffeine | R² = 0.918 | RMSEP= 0.375 mg/g |
Multiple PLS models were created and the best results came using the SCARS selective wavelength algorithm with a second derivative pre-treatment of the NIR spectra. Eighty-three total wavelengths were chosen for the caffeine correlation. All were concentrated in the following four regions: 4196 cm-1– 4018 cm-1, 5046 cm-1– 4412 cm-1, 6105 cm-1-5577 cm-1, 7706 cm-1– 6784 cm-1. These are all areas where the NIR spectrum of pure caffeine show distinct absorption peaks, indicating that the SCARS algorithm is choosing wavelengths which are in fact relevant to changes in the caffeine content. Validation set predictions confirmed the feasibility of the model as a method to quantitatively determine caffeine content in Arabica coffee.
Detection of Corn Adulteration in Brazilian Coffee (Coffea Arabica) by Tocopherol Profiling and Near-Infrared (NIR) Spectroscopy – Winkler-Moser, Singh, Rennick, et al., Journal of Agricultural and Food Chemistry, 2015, 63, 10662-10668
Coffee is considered a high-value commodity that is a frequent target for adulteration, as are many other food and beverage products. There is significant interest in developing and improving methods for detecting coffee adulteration and one such method that has been examined is NIR spectroscopy. Potential adulterants for coffee include corn, sticks, coffee husks, and other lower value crops. Fourteen different lots of green Arabica coffee beans from different cities and plantations in Brazil were procured for the study. All coffee samples were roasted as well as corn to be added as an adulterant. Both the coffee and corn were ground before mixing. Five different concentrations of corn adulterant were added and mixed with each sample ranging from 1% to 20% corn. In addition, the pure Arabica sample from each lot was used as well, making for a total of eighty-four samples. Samples were scanned using an NIR spectrometer from 400 nm to 2500 nm. Tocopherol content was chosen as a basis for determining the percentage of corn adulteration and reference values for tocopherol in the samples were determined using HPLC. The HPLC results and a Multiple Linear Regression (MLR) equation were used to correlate the tocopherol profile results to the percentage of corn adulteration. This correlation was then used as reference value to correlate the NIR spectra to % corn adulteration using Partial Least Squares (PLS) analysis.
| % Corn Adulterant | R² = 0.986 | RMSEP = 1.171% |
 Results of the calibration model showed good correlation and prediction values proved the feasibility of the model. Both the NIR and HPLC methods showed comparable results with about a 5% sensitivity, proving the potential of NIR spectroscopy as a fast, simple, and reliable method for detecting corn adulterant in ground coffee. The suggested next step is further studies incorporating different species of coffee with other kinds of adulterants to test the feasibility of a universal model for adulteration. Such a model would have to be continuously updated with new data as different types of adulterants are emerging all the time in the world food and beverage market.
The post Coffee Analysis appeared first on NIR-For-Food.
]]>The post Cola, Energy, and Tea Drinks Analysis appeared first on NIR-For-Food.
]]>Introduction
Along with coffee, cola, energy drinks, and tea are popular beverages in the market that come in a variety of flavors. One big reason why they are so popular is because of their physiological and psychoactive properties, mostly from caffeine content. In the case of cola and energy drinks, sugar or some form of artificial sweetener also provides a stimulating effect. Companies closely safeguard their recipes for manufacturing cola and energy drinks as well as their testing procedures for quality control. Tea is the second most consumed beverage in the world after coffee. It can be categorized into two types: black tea which accounts for 80% of world production and green tea which accounts for 20% of world production. Different fermentation processes produce more than three hundred types of tea worldwide. These can be classified into six main families based on the manufacturing process: full fermented black tea, non-fermented green tea, slightly fermented white tea, semi-fermented oolong tea, dark (red) tea, and post yellow tea. The main chemical constituents of tea are amino acids, polysaccharides, polyphenols, alkaloids, organic acids, volatile compounds, and proteins. Theaflavins are also an important component that contribute to the antioxidant effect in black tea. There are different quality parameters that need to be tested in these beverages, many relating to sugar, acidity, and alkaloid (such as caffeine) parameters. Current methods for testing these parameters such as HPLC are expensive, laborious, and time-consuming, especially when implemented in a process setting. There is a need for fast, cost-effective, and real-time monitoring of parameters at all stages of the cola, energy drinks, and tea manufacturing process. One such method that has been examined is NIR spectroscopy.
Analytes
- Taurine, Arginine, or Neither Energy Drink Classification
- Caffeine
- Sugar
- Amino Acids
- Theaflavins
- Water Extract
Summary of Published Papers, Articles, and Reference Materials
Measurement of chemical parameters in energy drinks and tea has been studied using NIR spectroscopy and the results of most studies have demonstrated the potential of using this method as a replacement for expensive and time-consuming wet chemistry methods. It must be noted that due to the strict guarding of recipes and quality control testing procedures by soft drink companies, there are few published studies using NIR spectroscopy to measure parameters in cola. However, many of the important quality parameters in soft drinks have been measured in other drinks. Two examples of this include Soluble Solids Content and pH. Energy drinks are manufactured in a manner similar to cola and are known for their stimulating effect which mostly comes from the high caffeine and sugar (or artificial sweetener content). One study examined classifying energy drinks based on taurine, arginine or containing neither using NIR spectroscopy as well as quantifying sugar and caffeine content. Classification results showed over a 95% correct prediction rate when classifying the three groups. Correlation was high between caffeine reference values and prediction values using validation NIR spectra. In the case of sugar, two sets of reference values were used: the Schoorl method and nominal values provided on the sample containers. Results were better using the nominal values and this likely occurred because multiple tests on the same sample using the Schoorl method showed a high standard deviation, indicating a large reference error. However, the RMSEP for the caffeine model is lower than the threshold of detection for this parameter using NIR spectroscopy and more validation work would be necessary to prove the feasibility of this model. Tea is the second highest consumed beverage in the world after water and two studies measured various parameters in tea. The first study used commercial samples of tea soft drink to measure SSC using reference values and NIR spectra. Calibration models were created using both the full wavelength range and selective wavelengths, both showing good results and proving the feasibility of the measurement. The second study used black tea powdered samples to measure various parameters important for quality control: amino acids, caffeine, theaflavins, and water extract. Four different modeling algorithms were used for the calibrations. Correlation coefficients were high and prediction results showed low error, indicating that these models can be used to measure these quality control parameters in black tea using NIR spectroscopy.
Scientific References and Statistics
Quantitative Determination and Classification of Energy Drinks Using Near-Infrared Spectroscopy – Racz, Heberger, Fodor, Analytical and Bioanalytical Chemistry, 2016, 408:6403-6411
 Energy drinks are one of the most popular functional beverages among commercially available soft drinks. They are known for high caffeine concentration and stimulating properties and are marketed based on distinctive color, flavor, and unique appearances. Energy drinks can also carry dangerous side effects due to high caffeine and sugar intake. Thus, it is important to analyze these parameters in energy drinks. There are also other components, such as taurine and arginine, which are important and are strictly regulated in some countries. Current reference methods for determining these components are time-consuming and expensive. NIR spectroscopy was examined as a method for classifying energy drinks based on either the presence of taurine, arginine, or neither as well as quantitative determination of caffeine and sugar. Ninety-one commercial energy drinks were procured for the study. Some of the drinks were mixed together to cover the examined concentration ranges for caffeine and sugar as uniformly as possible. FT-NIR spectra were scanned in transmission mode from 12500 cm-1 to 4000 cm-1. Spectral resolution was 8 cm-1 and thirty-two scans were averaged for each individual spectrum. This process was repeated three times for each sample and the three spectra were averaged to create one spectrum for each sample. Reference tests were performed on the samples for caffeine using HPLC-UV and for sugar using the Schoorl method. Principle Component Analysis (PCA) and Linear Discriminant Analysis (LDA) were applied to the spectra for classification analysis. Partial Least Squares (PLS) regression models were created using the NIR spectra and reference values for caffeine and sugar. In the case of sugar, both the HPLC-UV reference values and nominal values provided on the can were used to create regression models for sugar.
LDA Classification:
| Correct Classification for Arginine, Taurine, or Neither | 95.7% |
| Caffeine | R² = 96.63 | RMSEP= 13.4 ppm |
| Sugar (Measured Schoorl Concentration) | R² = 94.25 | RMSEP= 1.13 g/100 ml |
| Sugar (Nominal Concentration Shown on Drink Containers) | R² = 99.75 | RMSEP= 0.29 g/100 ml |
For classification, PCA was conducted first and the score values from the analysis were used as a basis for LDA. Validation results from the LDA showed over 95% correct classification of the samples. This could be an important analytical test in countries that do not allow the presence of taurine in energy drinks and replace it with either arginine or nothing at all. The caffeine PLS model showed good correlation and the RMSEP is slightly greater than 5% of the total range of caffeine values in the samples used for calibration (120 ppm to 340 ppm). In the case of sugar, the nominal reference values showed better results than the reference values obtained using the Schoorl method. This likely occurred because the Schoorl method has large bias and error, a conclusion proven by the 12.4% standard deviation when performing the analysis on duplicate samples. Despite these results, it must be noted that the RMSEP for caffeine is considered to be below the detectable threshold limit for NIR spectroscopy for this parameter. It is possible that the model is correlating indirectly to a parameter affected by a change in caffeine. An indirect correlation is acceptable for a PLS regression model, but the results need to be carefully examined and validated before using such a model in a real-time setting. Therefore, more work and study would be necessary to determine the validity of the caffeine measurement from NIR spectra made in this study.
https://link.springer.com/article/10.1007%2Fs00216-016-9757-8
Nondestructive Measurement and Fingerprint Analysis of Soluble Solid Content of Tea Soft Drink Based on VIS/NIR Spectroscopy – Li, He, Wu, Sun, Journal of Food Engineering 82 (2007) 316-323
| SSC (PLS) | R² = 0.981 | RMSEP= 0.57 °Brix |
| SSC (MLR) | R² = 0.975 | RMSEP= 0.69 °Brix |
The PLS model was created over the full range from 400 nm to 1000 nm and showed excellent correlation between the spectral data and reference SSC values. Predictions on the validation set proved the feasibility of the model. Based on statistical analysis of the latent variable inputs from the wavelengths for the calibration, five statistically significant wavelengths were selected: 490 nm, 498 nm, 554 nm, 929 nm, and 970 nm. These five wavelengths were used to create the MLR model, which showed comparable results to the PLS model. The potential of using both calibration models was demonstrated and VIS/NIR spectroscopy can be used as a method to predict SSC in tea soft drink.
https://www.sciencedirect.com/science/article/abs/pii/S0260877407001264
Prediction of Amino Acids, Caffeine, Theaflavins, and Water Extract in Black Tea Using FT-NIR Spectroscopy Coupled Algorithms – Zareef, Chen, Ouyang, Analytical Methods, Issue 25, 2018
Tea is the world’s second highest consumed beverage after water and is categorized into two types: black tea and green tea. Black tea accounts for about 80% of world tea production and green tea accounts for the other 20%. Various fermentation processes are used to produce over three hundred different types of tea worldwide. The main chemical constituents of tea are amino acids, polysaccharides, polyphenols, alkaloids, organic acids, volatile compounds, and proteins. Theaflavins are also an important component that contribute to the antioxidant effect in black tea. FT-NIR spectroscopy was examined as a method for analyzing the following four components in black tea: amino acids, caffeine, theaflavins, and water extract. Ninety-five black tea powder samples from multiple countries were procured for the study. FT-NIR spectra were collected from 10000 cm-1 to 4000 cm-1 at 3.86 cm-1 intervals. Thirty-two scans were collected and averaged into one spectrum for each data point. This process was repeated three times for each sample, with the sample cup rotated 120° two subsequent times after the first spectrum was collected. Reference values for the parameters of interest were collected using traditional methods and various pretreatments were applied to the spectral data for model optimization. Four different chemometrics algorithms were used to correlate the NIR spectra to the parameters of interest: Partial Least Squares (PLS), Synergy Interval PLS (Si-PLS), Backward Interval PLS (Bi-PLS), and Genetic Algorithm PLS (GA-PLS).
PLS
| Amino Acids | R² = 0.9396 | RMSEP= 0.219 mg/g |
| Caffeine | R² = 0.9195 | RMSEP= 0.192 mg/g |
| Theaflavins | R² = 0.9056 | RMSEP= 0.204 mg/g |
| Water Extract | R² = 0.8886 | RMSEP= 1.53 mg/g |
Si-PLS
| Amino Acids | R² = 0.9426 | RMSEP= 0.207 mg/g |
| Caffeine | R² = 0.9216 | RMSEP= 0.184 mg/g |
| Theaflavins | R² = 0.9439 | RMSEP= 0.156 mg/g |
| Water Extract | R² = 0.9192 | RMSEP= 1.27 mg/g |
Bi-PLS
| Amino Acids | R² = 0.9446 | RMSEP= 0.19 mg/g |
| Caffeine | R² = 0.9328 | RMSEP= 0.171 mg/g |
| Theaflavins | R² = 0.9454 | RMSEP= 0.154 mg/g |
| Water Extract | R² = 0.9172 | RMSEP= 1.33 mg/g |
GA-PLS
| Amino Acids | R² = 0.9506 | RMSEP= 0.197 mg/g |
| Caffeine | R² = 0.9274 | RMSEP= 0.182 mg/g |
| Theaflavins | R² = 0.9172 | RMSEP= 0.19 mg/g |
| Water Extract | R² = 0.9264 | RMSEP= 1.26 mg/g |
The PLS modeling algorithm uses the full wavelength range to correlate the spectral data. Both Si-PLS and Bi-PLS use interval selection analysis to select wavelength ranges to optimize the models. GA-PLS is also a variable selection method based on principles of natural and genetic selection of the data. Multiple runs are often necessary to achieve good results using this method. All four methods showed good results with correlation coefficients well above 0.9 for all parameters. GA-PLS showed the best results for caffeine and theaflavins while Bi-PLS showed the best results for caffeine and theaflavins. The results of this study prove the feasibility of measuring amino acids, caffeine, theaflavins, and water extract using NIR spectroscopy and calibration models.
The post Cola, Energy, and Tea Drinks Analysis appeared first on NIR-For-Food.
]]>The post Cooking Oil Analysis appeared first on NIR-For-Food.
]]>The post Cooking Oil Analysis appeared first on NIR-For-Food.
]]>The post Corn Analysis appeared first on NIR-For-Food.
]]>Introduction
Corn is not only an important staple food for human consumption but is used to create many different types of products and by-products. These include animal feed, biofuel, corn starch, corn oil, and many different forms of corn syrup. More corn is produced than any other cereal plant worldwide. Sweet corn has become particularly appealing to consumers for its good taste and high nutritional content. Corn is comprised of four parts: endosperm, germ, pericarp, and tip cap, all showing distinct characteristics and containing different portions of the precursors of corn products. There are many different biotypes that can be grown in different parts of the world under varying climate conditions. Demand for corn is increasing rapidly and market growth is expected to be strong over the next decade, especially for animal feed and corn starch products. Corn is processed by either wet milling or dry milling. Wet milling separates the corn into separate components which can then be processed into various products. Dry milling is similar to wheat flour production and is used mostly for producing flour and as the precursor for processing corn into ethanol. Genetic engineering of corn has been going on for decades and always remains the subject of great debate. Many transgenic varieties have been created with traits like herbicide, pest, and drought resistance. Research continues to be conducted at a fast pace to improve the quality of corn and its products. With demand continuing to grow and research moving forward at a rapid pace, there is a need for new testing methods to meet the challenges of optimizing corn breeding, harvesting, growing, and processing. Traditional methods are often expensive, time-consuming, and impractical for use on a large scale. One method which has shown potential for measuring parameters of interest in corn that is fast, non-invasive, and able to be implemented for large-scale testing is NIR spectroscopy.
Analytes
- Sweet corn cultivar sorting
- Viable and non-viable supersweet corn seed sorting
- Effects of varieties, producing areas, ears, and ear positions of single maize kernels on NIR spectra
- Non-Structural Carbohydrates (NSC)
- Water Soluble Carbohydrates (WSC)
- In Vitro Organic Dry Matter Digestibility (IVOMD)
- Organic Matter (OM)
- Crude Protein (CP)
- Neutral Detergent Fiber (NDF)
- Acid Detergent Fiber (ADF)
- Starch
- Nutritional value of silage from Brazil
- Corn seed germination rate
- Detection of fusarium infused diseased maize grains
- Gross Calorific Value (GCV)
- Cell wall residues
- Degradability
- Lignin content
- Lignin structure
- p-Hydroxycinnamic acids
- Structural sugars
- Transgenic vs. non-transgenic discriminant analysis
- Macronutrient content as a tool for breeding selection
Summary of Published Papers, Articles, and Reference Materials
Cultivar Classification of Single Sweet Corn Seed Using Fourier Transform Near-Infrared Spectroscopy Combined with Discriminant Analysis
 The sweetness of sweet corn is a major factor in consumer satisfaction and breeders are always working to breed sweeter cultivars. It is usually consumed when immature because of high nutrition and increased sweet flavor. A uniform maturity time is important to choose the optimal harvest time and then to obtain a good shelf-life time as the sweet flavor changes quickly after harvesting. Different cultivars of sweet corn vary in the maturity cycle, even when planted under the same conditions. Mixing of cultivars is undesirable for a number of reasons, such as differences in maturity cycle times, variation in nutritional value, and resistance to diseases and pests. The purity of a seed cultivar is defined as the ratio of seeds belonging to a cultivar to the total tested seeds. Improving purity maximizes quality and yield, leading to increased economic benefits but traditional methods for determining cultivar purity like protein electrophoresis and DNA molecular markers are expensive, time-consuming, and impractical for large-scale use. FT-NIR spectroscopy was examined for distinguishing between different cultivars of single-kernel sweet corn seeds. Three hundred and eighty sweet corn seeds from each of two separate cultivars were procured for the study. Initial examination was done by scanning a few seeds on both the embryo side and endosperm side of the seeds. After visual examination of the NIR spectra, it was determined that the embryo side spectra would be used for the study. All seeds were scanned from 10000 cm-1 to 4000 cm-1 at 4 cm-1 intervals. Thirty-two scans were collected per reading and averaged into one spectrum per sample for a total of seven hundred and sixty spectra. Various pre-processing methods were applied to the NIR spectra before chemometric analysis. Principle Component Analysis (PCA) was performed for outlier detection and to determine differences in the spectral data. After PCA, a genetic algorithm (GA) was applied to determine the feature wavelengths in spectral differences and one hundred and twenty-six wavelengths were selected. Four separate classification algorithms were used with various wavelength ranges for modeling: K-Nearest Neighbor (KNN), Soft Independent Modeling of Class Analogy (SIMCA), Partial Least Squares Discriminant Analysis (PLS-DA), and Support Vector Machine Discriminant Analysis (SVM-DA). The spectra were split into two groups: two-thirds for a calibration group and one-third for a validation group.
SVM-DA
| Full Wavelength Range | 99.59% Correct Classification |
| Featured Wavelengths | 99.19% Correct Classification |
The best results were obtained using the SVM-DA algorithm and as shown, there was over 99% accuracy using both the full wavelength range and featured wavelength range for the models. This study proved the feasibility of classifying different corn cultivars using FT-NIR spectroscopy and the SVM-DA classification algorithm. Using a classification model like this could be a method used in seed sorting machinery to select high-purity seeds of the same cultivar, helping to optimize product quality and yield in sweet corn.
https://elibrary.asabe.org/abstract.asp?aid=50687
Single-Kernel FT-NIR Spectroscopy for Detecting Supersweet Corn (Zea mays L. Saccharata Sturt) Seed Viability with Multivariate Data Analysis
 Sweet corn has become a very popular vegetable in many countries because of pleasant flavor and high nutritional value. However, low germination rate and seedling vigor of sweet corn seed have limited the development of the sweet corn industry. High soluble sugar content and lower starch cause seeds to rapidly deteriorate compared to other corn seeds. This likely occurs because less starch means less endosperm tissue can be reserved as an energy source for seed metabolism. This effect is magnified with supersweet corn seeds and the high soluble sugar content also inhibits the drying of the seed crop in the field, often necessitating artificial drying after harvesting. Proper temperature is essential during drying as it has a strong effect on germination and storability. The sensitivity of supersweet corn seeds creates a need for determining seed quality to prevent non-viable seeds from entering the market and ultimately the planting and sowing process. However, conventional methods like the germination test and tetrazolium test are time-consuming, expensive, destructive to samples, and impractical for implementing for large-scale testing. NIR spectroscopy was examined as a method for determining viability in supersweet corn seeds. Three hundred supersweet corn seeds from Huameitian No. 8, a well-known variety in China were procured for the study from South China Agricultural University. More seeds were provided but three hundred seeds that were not cracked, broken, or discolored were chosen. It is assumed that deterioration of supersweet corn seeds is caused by either excessive heating during the drying process or improper storage conditions. In order to simulate this, one hundred seeds were subjected to deterioration by tempering the moisture to 20%, placement in a plastic bag and treating by incubation for seven days, and then dried back to the 20% moisture content. This process simulates artificial aging. Another one hundred seeds were subjected to microwave treatment. Both groups exhibited no changes to the naked eye and the remaining one hundred seeds had no treatment. All seeds were scanned using an FT-NIR spectrometer from 10000 cm-1 to 4000 cm-1 at 4 cm-1 intervals on both the embryo and endosperm side. Thirty-two scans were collected per reading and averaged into a single spectrum per sample. After scanning, germination rate was checked for all seeds using the standard germination test method. Seeds in the control group had a germination rate as high as 98% while the treated seeds had a 2% rate for the deterioration group and 5% for the microwaved group. In reality, these seeds are considered non-viable because of their weak roots which would be unable to support healthy seedlings. Various pre-processing methods were applied to the spectral data before chemometric analysis. Six separate Partial Least Squares Discriminant Analysis (PLS-DA) models were created: Artificially Aged vs. Control, Heat-Damaged vs. Control, and All Damaged vs Control (for both embryo and endosperm spectra).
| Heat Damaged vs. Control (Embryo) | 100% Viable | 96.0% Non-Viable Classification |
| Heat Damaged vs. Control (Endosperm) | 99.3% Viable | 98.0% Non-Viable Classification |
| Artificially Aged vs. Control (Embryo) | 100% Viable | 98.0% Non-Viable Classification |
| Artificially Aged vs. Control (Endosperm) | 99.3% Viable | 94.0% Non-Viable Classification |
| All Damaged vs. Control (Embryo) | 99.6% Viable | 98.7% Non-Viable Classification |
| All Damaged vs. Control (Endosperm) | 99.1% Viable | 98.7% Non-Viable Classification |
The prediction models determined that FT-NIR spectroscopy and PLS-DA classification models can be used to accurately detect non-viable supersweet corn seeds damaged by overheating and artificial aging. Results were similar for both the embryo and endosperm sides of the seeds. Results can be explained by the physical and chemical changes caused by the deterioration process. There are other reasons that can cause seeds to be non-viable that have not been examined and published in an NIR spectroscopy study yet, such as frost damage during growth and natural aging. Further work would entail examining some different types of seed damage as well as encompassing a larger sample set with different varieties and batches of seeds. There is great potential to use NIR spectroscopy as a sorting tool for viable and non-viable corn seeds.
Effects of Varieties, Producing Areas, Ears, and Ear Positions of Single Maize Kernels on Near-Infrared Spectra for Identification and Traceability
 Maize is an important source of food and industrial materials and demand for seeds is high, especially in China. The quality of a maize seed is related to varieties and producing areas and identification of seeds is important to prevent adulteration. Seeds from different provinces exhibit different characteristics even among the same variety, usually related to environmental factors like climate, daylight conditions, and soil. While successful studies using NIR spectroscopy for identifying different varieties of maize seeds and wheat of the same species cultivated in different areas have shown distinct differences in NIR spectra that are sufficient for identification, no comprehensive study examining different factors and their degree of influence on NIR spectra of maize seeds has been conducted until now. In this study, NIR spectroscopy was used to determine the degree of influence of genetic and environmental factors on large amounts of maize seeds of different varieties and from different producing areas. A total of one hundred and thirty maize inbred lines harvested from Hainan and Beijing in China were procured for the study, all from the same harvest year. Five ears were randomly selected from each inbred line harvested from Hainan. Five seeds were collected from each ear from each position: ear tip, middle of the ear, and bottom of the ear. For each line harvested in Beijing, twenty seeds were collected randomly. In total, twelve thousand three hundred and fifty seeds were procured for the study. Seeds were scanned with an FT-NIR spectrometer from 12000 cm-1 to 4000 cm-1 at 8 cm-1 resolution. Twenty scans were collected per reading and averaged into a single spectrum per seed. All seeds were scanned on the embryo side. Various pre-processing methods were applied to the spectral data and the wavenumbers from 12000 cm-1 to 9000 cm-1 were eliminated from the data because of noise. Principle Component Analysis (PCA) was first performed to examine differences in the NIR spectra. The NIR spectral difference was calculated to determine the degree of influence of varieties, producing areas, ears, and different ear positions on the NIR spectra. The one hundred thirty inbred lines from Hainan were used to calculate the influence from degree of variety. After pretreatment, the difference between the spectra of each inbred line and the average spectrum was calculated and the average of these differences was the influence of degree of variety on the spectra. Likewise, differences between the spectra from the two different producing areas was calculated to determine the degree of influence of producing areas. Spectral differences between the spectra of different ears and different ear positions from the Hainan samples were also determined. It was determined that wavelength bands from 1300 nm to 1470 nm, 1768 nm to 1949 nm, 2010 nm to 2064 nm, and 2235 nm to 2311 nm were strongly influenced by the producing area. The degree of influence for the four factors was as follows: 45.40% for variety, 42.66% for producing areas, 8.22% for ears, and 3.72% for ear positions. These results show that genetic differences among maize inbred lines are the main factor in differences in NIR spectra, with producing area accounting for a slightly smaller degree of influence. The results provide a basis for variety authentication and breeding optimization. Further study should be conducted on seeds from different harvest years to determine the degree of influence from year to year.
NIRS Determination of Non-structural Carbohydrates, Water Soluble Carbohydrates and Other Nutritive Quality Traits in Whole Plant Maize with Wide Range Variability
Forage maize is an important source of fodder for dairy farms in Spain, where the need for silage for cow feeding extends from five to seven months each year. The nutritional content of forage is extremely important in determining the end product of cow milk as even small differences in nutritional content of forage can change the output and nutritional content of milk. These parameters include non-structural carbohydrates (NSC), water soluble carbohydrates (WSC), in vitro organic dry matter digestibility (IVOMD), organic matter (OM), crude protein (CP), neutral detergent fiber (NDF), and acid detergent fiber (ADF). NSC has a strong influence on the utilization of other nutrients while WSC is the substrate for growth of lactobacilli needed for acid lactic fermentation. The other parameters are all important for energy and digestibility in cow forage. Current methods for testing these parameters are time-consuming, expensive, and impractical for implementation on a large scale. NIR spectroscopy was examined for determining components of forage maize. Maize whole plant samples were collected over an eight year period from different locations in Spain and in diverse environmental conditions. To further expand the diversity of the sample set, samples were also collected from different genetic diversity sources, different countries, different tillage systems, and different maturity stages. Over three thousand samples were scanned using an NIR spectrometer from 1100 nm to 2500 nm. Various preprocessing methods were applied to the NIR spectra before chemometric analysis. All samples were analyzed for the parameters of interest using traditional methods. In total, four hundred and fifty samples were chosen for a calibration set and eighty-seven were chosen for a validation set. Sample selection was based on expanding the variability of the spectra by adding appropriate outlier samples to previous calibrated equations after determination of reference values. Partial Least Squares (PLS) calibration models were created to correlate the NIR spectra to the parameters of interest. Results are shown below.
| OM | R² = 0.91 | SEC= 0.23 g/100 g Dry Matter |
| CP | R² = 0.93 | SEC= 0.29 g/100 g Dry Matter |
| NDF | R² = 0.91 | SEC= 1.61 g/100 g Dry Matter |
| ADF | R² = 0.92 | SEC= 0.98 g/100 g Dry Matter |
| IVOMD | R² = 0.77 | SEC= 2.30 g/100 g Organic Matter |
| WSC | R² = 0.90 | SEC= 1.34 g/100 g Dry Matter |
| NSC | R² = 0.87 | SEC= 2.57 g/100 g Dry Matter |
| Starch | R² = 0.90 | SEC= 2.67 g/100 g Dry Matter |
The independent validation set was used for predictions to validate the models and out of the parameters, WSC and NSC showed the best results with good accuracy obtained in the predicted results. Starch, NDF, ADF, OM, and CP showed accurate results as well. The prediction results for IVOMD were not as good as the rest of the parameters and it was speculated that error in the reference method may have contributed to the higher prediction error. Still, the results were considered sufficient for screening purposes and to distinguish between high and low values for IVOMD. This study proved the feasibility of using NIR spectroscopy to determine nutritive components in forage maize and the potential to replace traditional time-consuming and expensive reference methods for determining these parameters.
463-471_3316-391-12_NIRS (ciam.gal)
Nutrition Value of Silage from Corn Hybrids in the State of Mato Grosso, Brazil
Rainfall in the Brazilian savanna between October and March causes considerable seasonality in forage production and thus difficulties in maintaining product regularity and income of producers. Evaluating the chemical composition of silage of corn cultivars is very important because it determines the food quality available for animal intake, especially in the case of neutral detergent fiber (NDF) because reduced NDF increases dry matter (DM) digestibility. In this practical application, NIR spectroscopy was used to determine the nutritional value of corn silage from different hybrids cultivated on an experimental farm in Brazil. Twenty-three different hybrid corn varieties from different seed companies of three repetitions each were planted for the study. Harvesting and slicing of corn plants for ensiling occurred one hundred days after plant emergence when the grains were at the hard flour stage. Forage was cut at an average particle size between two and three cm and placed in sealed silos for ninety days. After opening the silos, samples were collected from the middle of each silo. A portion of each sample was set aside for pH and ammoniacal nitrogen tests. Samples were scanned using an NIR spectrometer and calibration models were used to determine dry matter (DM), crude protein (CP), neutral detergent fiber (NDF), acid detergent fiber (ADF), and the minerals Ca, P, K, and Mg rates from the NIR spectra. From these parameters, rates of total digestible nutrients (TDN), net lactation energy (NLE), net energy gained (NEg), net energy for maintenance (NEm), digestibility in vitro of DM (DIVDM) and dry matter intake (DMI) were calculated. All pH and ammoniacal nitrogen tests showed expected values. Twelve of the hybrids showed lower NDF and thus higher estimated DMI values. This practical application showed the benefits of using NIR spectroscopy as a tool to determine variation in corn hybrid silage as performing traditional reference tests to determine the parameters of interest in this study would have been expensive, time-consuming, and required the use of expensive chemicals and solvents.
https://www.scielo.br/j/asas/a/5gWjXTymZX6TjdhshwFW5wQ/?format=pdf
Near Infrared Reflectance Spectroscopy and Multivariate Analyses for Fast and Non-Destructive Prediction of Corn Seed Germination
Seed viability and germination rate are crucial parameters in planning agricultural production. It can be significantly influenced by both ecological factors, biochemical metabolism of the seed, and improper storage after harvesting. Traditional methods for determining these parameters include tetrazolium, conductivity, immunoassay, and germination tests which are not only expensive, time-consuming, and require the use of toxic chemicals and solvents but can also be very dependent on the experience and sensitivity of the technicians performing the tests. There is a need for a fast, non-invasive, and cost-effective testing method to determine corn seed germination rate and NIR spectroscopy was examined for this purpose. Eighteen different commercial samples of corn seed were procured for the study. Fourteen of the eighteen samples belonged to the same genotype of various ages that were stored for periods ranging from three months to two years under uncontrolled room conditions. Samples were scanned using an FT-NIR spectrometer from 10000 cm-1 to 4000 cm-1 using 4 cm-1 resolution. Thirty-two scans were collected per reading and averaged into one spectrum. This process was done three times per sample for a total of fifty-four spectra. Germination rate of the seeds was determined using a standard International Seed Testing Association (ISTA) method. Seeds were placed in moist germination paper, rolled, placed in a plastic container, and incubated at 25°C for seven days. When the emerging radicle was at least 2 mm, the seed was considered germinated. A significant variation was detected between corn genotypes in terms of germination rates and made the effect of seed storage period clear on germination rate. Rates varied from 0% for a non-viable seed to 18% for the slowest germinating seed to 100% germination. A Partial Least Squares (PLS) calibration model was created correlating the germination rate to the NIR spectra. Results are shown below.
Germination Rate R² = 0.98% SEP= 4.61%
The results of this study show promise for determining the germination rate of corn genotypes using NIR spectroscopy and a calibration model. However, it must be noted that the sample set is very limited and in order to use this model in a practical setting, more samples and multiple genotypes must be added to the calibration set. With such a small sample set, it is unclear exactly what parameters the calibration model is using to determine the basis for the correlation. It is recommended that a sample set with a minimum size of one hundred samples using multiple genotypes be used before using this application in a practical setting.
An Approach for Identification of Fusarium Infected Maize Grains by Spectral Analysis in the Visible and Near Infrared Region, SIMCA Models, Parametric and Neural Classifiers
Fusarium is a genus of fungi that is widely distributed in soil and associated with plants. While most species are harmless, some produce mycotoxins in cereal crops that can be toxic to humans and animals if consumed. Fusarium spp. Fusarium verticillioides is one such disease and it is important to determine that maize grains are free of this disease before entering the food chain. Traditional testing methods typically involve chromatography and while accurate, they are expensive, time-consuming, and impractical for large-scale testing use. Fluorimetric testing can be used as well but this method still takes about fifteen minutes to examine one single seed. A need exists for a fast, non-invasive testing method that can test large amounts of maize grains for disease and NIR spectroscopy was examined for this purpose. A total of nine hundred grains from the most popular variety of corn in Bulgaria were procured for the study. Samples were sorted into healthy and diseased grains and were scanned on both the endosperm and embryo sides. NIR spectra were collected using an NIR spectrometer from 400 nm to 2498 nm at 2 nm intervals. Each sample was scanned three times for a total of twenty-seven hundred spectra. Sample spectra were divided into a calibration set and validation set with six hundred samples chosen for calibration and three hundred for validation. Various preprocessing methods were applied to the spectral data before chemometric analysis. Three different classification algorithms were used to classify the grains based on NIR spectra: Soft Independent Modeling of Class Analogy (SIMCA), K-Means, and Probabilistic Neural Network (PNN).
Endosperm
| SIMCA | Healthy – 98.7% | Diseased – 96.0% |
| K-Means | Healthy – 95.3% | Diseased – 90.6% |
| PNN | Healthy – 99.3% | Diseased – 98.7% |
Embryo
| SIMCA | Healthy – 99.3% | Diseased – 93.3% |
| K-Means | Healthy – 94.6% | Diseased – 92.0% |
| PNN | Healthy – 99.3% | Diseased – 99.3% |
Best results were obtained using the PNN algorithm with the NIR spectra of the embryo side of the seeds. Spectra of the validation set were used with the classification algorithm to validate the model. However, it must be noted that the threshold of detection of mycotoxin concentration is far too low to directly detect it using NIR spectroscopy. It is quite possible that the mycotoxin concentration is affecting chemical and physical parameters in the seeds that can be detected using NIR spectroscopy and the results of this study reflect the changes in these parameters that occur in diseased maize grains. In order to properly validate a study of this nature, a thorough examination of the wavelengths showing differences in the NIR spectra of the two groups of seeds and tests on the nutritional content of the two groups of seeds is recommended.
www.clbme.bas.bg/bioautomation/2010/vol_14.2/files/14.2_03.pdf
Gross Calorific Value Estimation for Milled Maize Cob Biomass Using Near-Infrared Spectroscopy
Maize cob is the waste product after the maize seed is removed. While it has been used as a fertilizer, it takes a long time to decompose and is not popular among farmers for this reason. However, maize cob can be used as a biofuel. When burned, it has a calorific value of approximately 17,000 kJ/kg and has a long burning time as well. An important measurement in waste residues for biofuel use is gross calorific value (GCV), the total energy released in the burning process. This particular measurement takes the latent heat of vaporization of water into account during the combustion process. The traditional method for determining GCV is a bomb calorimeter which is expensive and takes about thirty minutes per sample, making it impractical for large-scale testing. A need exists for a fast, non-invasive, and cost-effective method to determine GCV in maize cob and NIR spectroscopy was examined for this purpose. Sixty samples of maize cobs were collected from different growing areas for the study. After harvesting, samples were crushed and dried to a constant weight in an oven. Samples were scanned using an FT-NIR spectrometer from 12500 cm-1 to 3600 cm-1 at 8 cm-1 resolution. Each sample was scanned thirty-two times per reading and the scans were averaged into a single spectrum per sample. Out of the sixty sample spectra, fifty were chosen for the calibration set and the remaining ten for a validation set. After scanning, reference tests were performed on 0.5 g of each sample using a bomb calorimeter to determine GCV values. Various pre-processing algorithms were applied to the NIR spectra before chemometric modeling. A Partial Least Squares (PLS) calibration model was created correlating the NIR spectra to GCV. Results are shown below.
| GCV | R² = 0.83 | RMSECV= 91 J/g |
Modeling results showed good correlation and the independent validation set was used to confirm the validity of the model. The RMSECV is quite low considering that each sample has a GCV in between 17000 J/g and 18000 J/g. It is possible that using only 0.5 g for the reference tests contributed to a lower correlation coefficient as the variation between that sample size used for the reference test and the sample scanned with the spectrometer may have been significant. The sample set was limited and before using this model in a practical setting, more samples from different growing areas and different varieties of maize cob should be added to the calibration set to make the model more robust and confirm the validity of the calibration. Overall, the results show promise for using NIR spectroscopy as a fast, non-invasive, and cost-effective method for determining GCV in maize cob with the potential to replace traditional time-consuming and expensive reference methods.
Water Deficit Responsive QTLs for Cell Wall Degradability and Composition in Maize at the Silage Stage
In order to use lignocellulosic biomass for animal feed or biorefining, optimization of the degradability of the material is required. Much work is put into adapting biomass crops to changing climate and in particular to drought resistance. Lignocellulosic biomass consists primarily of cell wall polymers. Few studies have been conducted that use quantitative trait loci (QTL) to determine agronomical and cell-wall related traits related to water deficit. In this study, the mapping power of a maize recombinant inbred line population was combined with NIR spectroscopy calibration models to track the response to water deficit of traits associated with biomass quality. Over three separate years, the inbred line population was cultivated under two contrasted water regimes and harvested at silage stage. NIR predictive equations were established for various biochemical cell wall related traits, such as cell wall residues, degradability, lignin content, lignin structure, p-Hydroxycinnamic acids, and structural sugars. Results showed that cell wall degradability and β-O-4-linked H lignin subunits were increased in response to water deficit, while lignin and p-coumaric acid contents were reduced. A mixed linear model was fitted to map QTLs for agronomical and cell wall-related traits. These QTLs were categorized as “constitutive” (QTL with an effect whatever the irrigation condition) or “responsive” (QTL involved in the response to water deficit) QTLs. Fifteen clusters of QTLs encompassed more than two-thirds of the two hundred and thirteen constitutive QTLs and thirteen clusters encompassed more than 60% of the one hundred and forty-nine responsive QTLs. The results showed that water deficit favors cell wall degradability and that breeding of varieties that show improved resistance to drought and biomass degradability is possible. NIR spectroscopy proved to be a powerful tool in this study by enabling the quick analysis of the various traits needed to determine the effect of water deficit on the maize samples.
Screening of Transgenic Maize Using Near Infrared Spectroscopy and Chemometric Techniques
Plant breeding uses molecular biology to produce new crop varieties and lines by using genetic engineering to introduce desirable traits into plants. One important technique in breeding is selection, the process of effectively propagating plants with desirable traits and eliminating those with less desirable traits. Breeders must screen large populations of crops to find plants with desired traits. Traditional screening methods used for this purpose are DNA and protein based, such as polymerase chain reaction (PCR) and microarrays. Such methods are time-consuming, expensive, and impractical for use when studying large numbers of samples, especially in the procedure of leaf DNA extraction. NIR spectroscopy was examined for the purpose of classifying transgenic and non-transgenic maize plants. Seeds of transgenic maize created with both herbicide and insect tolerant traits along with seeds from its parental line were procured for the study. Seeds were sown and grown in a greenhouse for two months. The second or third leaf that formed from each plant was selected for NIR sampling. Before NIR scanning, PCR was used to check the integrity of the copies of the genes introduced during the breeding phase. In total, one hundred and sixty-three of each of the transgenic and non-transgenic leaves were chosen for NIR scanning. Samples were scanned using an NIR spectrometer from 900 nm to 1700 nm. Each leaf was scanned three times and the three scans were averaged into one spectrum. Various pre-processing methods were applied to the spectral data before chemometric analysis. Principle Component Analysis (PCA) was performed on the NIR spectra to analyze spectral differences and wavelength ranges that were relevant to differences in the spectra. A total of five separate classification algorithms were applied to build discrimination models that can separate the transgenic and non-transgenic samples using the NIR spectra. Models were created using both the full wavelength range and sensitive wavelengths identified from PCA. The best results are shown below:
| Extreme Learning Machine (ELM) | 95.20% |
In order to validate the models, cross-validation was performed by removing sample spectra from the models and then classifying the samples based on the spectra that were removed. The best results were obtained with the ELM algorithm using the full wavelength range. The sensitive wavelength range models showed worse results. It is common for natural products to show variations in NIR spectra that are not related to the parameters of interest and models using the full wavelength range for agricultural products in particular need a large wavelength range to be robust and predict accurately. The potential was demonstrated for using NIR spectroscopy as a screening tool for transgenic plants that could replace expensive, time-consuming, and slow traditional reference methods.
Grain Quality of Drought Tolerant Accessions Within the MRI Zemun Polje Maize Germplasm Collection
Maize is among the three most widely grown crops in the world. Breeders are conducting research to identify superior genotypes, particularly in relation to drought tolerance as drought is one of the most important factors that limits production of maize. Even in areas where the average rainfall is sufficient for maize growing, the distribution of rainfall can be insufficient and causes yield loss in the crops. The incorporation of genetic research in breeding programs that can create lines that are more drought resistance and thus having most stable yields is growing rapidly, but current testing methods for determining genetic lines with these traits are impractical for large-scale use. In this study, NIR spectroscopy was used as a tool for determining nutritional content of forty different accessions that were created from an elite drought tolerant core gene bank from multiple inbred lines, introduced populations, and landraces. The purpose was to determine if macronutrient content gain among the different generic groups could be correlated to genetic gain and thus identify these groups as potentially favorable sources for a specific trait, in this case drought tolerance. The forty different accessions from the core were grown, multiplied, and at least eighty ears of maize were collected per multiplied population. Samples were scanned using an NIR spectrometer and calibration models were used to determine values for oil, protein, and starch. It was noted that the oil, protein, and starch contents were significantly higher in the introduced populations than for the landraces. Oil in particular showed the greatest progress from the selection based on the expected genetic gain at 14.74%, indicating that the greatest progress in breeding could be determined from increased oil content with accessions from an unknown group. The potential was shown in this study to use NIR spectroscopy as a tool for determining macronutrient content in maize which can then be used to identify accessions with favorable traits to assist breeders in selecting plants with desirable qualities for improved breeding.
The post Corn Analysis appeared first on NIR-For-Food.
]]>