The post Adulterant Overview appeared first on NIR-For-Food.
]]>Introduction
Adulteration is a legal term meaning a food product fails to meet legal standards. It indicates the intentional, fraudulent addition of extraneous, improper, or cheaper ingredients to a product or the dilution or removal of a valuable ingredient with the intention of increasing profits, ultimately compromising quality and resulting in the sale of substandard foods. Economically Motivated Adulteration (EMA) is estimated to cost the food and beverage industry between $10 billion to $15 billion per year. The increasingly global nature of the food supply chain as well as the massive size and scope of the food and beverage industry makes combating EMA a very daunting task. The UK Food Standards Agency (FSA) defines two main types of food fraud: the deliberate misdescription of food and the sale of food that is unfit and potentially harmful, although a combination of these can exist for certain incidents. The FSA estimates that approximately 10% of all food on UK supermarket shelves is adulterated in some form. In the United States, the Federal Food, Drug, and Cosmetic (FD&C) Act was passed in 1938 and contains criteria for food adulteration. Criteria that make food adulterated include: a poisonous or deleterious substance that makes it unsafe in the food itself or container, an unsafe pesticide chemical residue, food additive, animal drug, or color additive, and a filthy, putrid, or decomposed substance as well as being prepared, packed, or held under unsanitary conditions. Improper irradiation, dietary ingredients that present a reasonable risk of illness or injury when consumed under the conditions recommended in labeling, and improper importing are included as well. The criteria for EMA is as follows: a valuable constituent that has been omitted in whole or in part replaced with another substance, concealing damage or inferiority, or the addition of a substance that has been added to increase the bulk or weight, reduce quality or strength, or make it appear of greater value than it is worth. The FD&C has been amended numerous times and both the Federal Meat Inspection Act and Poultry Products Inspection Act contain provisions for adulteration as well. Some adulteration can be defined as incidental, meaning foreign substances can be incorporated into food from negligence or ignorance. This can occur during harvesting. Harvesting at the wrong time can also create adulteration by reducing nutritional value or having a product with an improper moisture level. Farmers may do this out of fear of theft or because they need money quickly. Intentional adulteration occurs with the intent to cause harm or create economic gain. Some forms of intentional adulteration are relatively innocuous, such as mispresenting the origin of a product. While this may entail a reduction in product quality, it does not present the potential for harm. In other cases, the intentional addition of toxic substances has resulted in illness and even death. In today’s social media environment, any reported incident of adulteration can have devastating consequences to the reputation and profits of food and beverage manufacturers and sellers, even if the adulteration was not their direct fault. One such example is the UK supermarket chain Tesco, which suffered a €300 million drop in market value in 2013 after horsemeat was discovered in burgers sold in their markets. Although no one was physically harmed, consumer anger led to the decrease in market value and a big hit to the company’s reputation. Brand confidence, company reputation, and the market economy can all suffer from publicized incidents of adulteration. New methods of adulteration are being developed all the time and present a big challenge to the food and beverage industry to detect and prevent adulteration.History and Incidents
The documented history of food fraud and adulteration goes all the way back to Assyrian tablets and Egyptian scrolls in biblical times. In the Middle Ages, high value imported spices were often combined with nutshells, seeds, juniper berries, and even stones and dust. Even today, spices are considered one of the most economically desired targets for adulteration because of a high value unit per mass and specificity of desired flavor characteristics. During the 18th and 19th centuries in the United States, chalk and plaster were used to water down and color milk as well as to bulk up flour. Lead was added to wine and beer. Dirt, sand, and leaves were added to coffee, tea, and spices. Preserved fruit and vegetables were artificially colored with copper salts. In more recent times, adulteration methods have become more advanced and sophisticated plus the expansion of global markets and the current social media environment have made the consequences for manufacturers and sellers of food and beverage even more pronounced. Some high-profile incidents have made global news in recent years. In 1994, ground paprika in Hungary was adulterated with lead oxide, leading to several deaths and dozens of illnesses. In 2005, Sudan I dye was discovered in Worcestershire sauce contaminated with adulterated chili powder. Sudan I dye is a known rodent carcinogen and is banned as a food additive. Herbal medicines have been adulterated with the withdrawn obesity medication sibutramine. Thirty-four products marketed as herbal supplements were recalled by the FDA in 2009 for containing sibutramine. More warnings have been issued in recent years for dietary supplements marketed as “natural”, “traditional”, or “herbal medicine”. Similar incidents have occurred in other countries. China was the location for two high-profile incidents of melamine adulteration. Melamine is a plasticizer that mimics high quality protein in routine quality tests. In 2007 it was discovered in pet food, leading to the deaths of thousands of dogs and cats and raising concerns about the safety of food imported from China. In China in 2008, melamine was added to milk and infant formula. The incident led to the hospitalization of around 54,000 infants, six deaths from kidney stones, and multiple criminal prosecutions including the execution of two of the conspirators. The horsemeat in burgers incident in England had tough consequences for the market. Sometimes the statistics of food can reveal adulteration just from analysis. In 2013, harvest statistics of the expensive Manuka honey from New Zealand revealed that only 1,700 tons of it were harvested per year, yet global sales of this honey were as high as 10,000 tons per year. Obviously, widespread fraudulent selling of ordinary honey as the more expensive Manuka honey occurred for this to happen. A test of dried oregano from English and Irish supermarkets revealed that nineteen out of seventy-eight samples contained other ingredients. These ingredients include olive and myrtle leaves and were present at levels ranging from 30% to 70%. In 2015, seven of Italy’s largest olive oil producers were under investigation for selling virgin olive oil as the higher quality extra virgin olive oil. Testing of twenty brands revealed that nine of them were found to not meet standards for extra virgin olive oil. On a larger scale, Operation Option IV was coordinated by Interpol and Europol at the end of 2014 and beginning of 2015. More than 2,500 tons of counterfeit and illicit foods were seized in forty-seven countries, including mozzarella cheese, strawberries, eggs, cooking oil, and dried fruit. These documented incidents underscore the large global scale of the food adulteration problem and the need for fast, cost-effective, and evolving methods for testing and monitoring of food fraud.Methods
Methods for food adulteration are always evolving and changing, making it difficult for testing and detection to keep up. Spices are a primary target of adulteration. They can be adulterated by adding a non-food substance, such as Sudan I dye or brick dust. Another method is to add a lower quality consumable substance. Examples of this include tomato skin in paprika, starches in onion powder, and buckwheat, millet, papaya seeds, and chili in black pepper. Black pepper is the most widely used spice in the world and thus is frequently subjected to adulteration. A substitution of a lower-quality product fits the definition of adulteration as well, such as adding Chinese Cassia cinnamon to the higher quality Ceylon cinnamon. Spent plant material added to the final product and exhaustively extracted material both qualify as adulteration. Sibutramine adulteration in herbal supplements falls under similar standards for adulteration. There have even been reports of selling road salt as food salt. Olive oil is another valuable food product that is frequently subjected to adulteration. Standards for extra virgin olive oil are strict and there are many ways to adulterate olive oil. Misrepresentation of geographical origin constitutes adulteration. A cheaper type of oil such as vegetable oil can be added. Poorer olive products such as pomace are another example. All edible oils can be subjected to adulteration but since olive oil is the most valuable, it occurs the most often in olive oil. Popular beverages have become very valuable in the market and adulteration can occur in them. Coffee is extremely popular in many parts of the world and has been adulterated by misrepresentation of geographical origin, lower quality beans, and cheaper foreign materials, such as husks and stems, chicory, grains like corn and barley, woody tissue, cocoa or soya beans, and acai berries. Alcoholic beverages are another popular beverage around the world that offer a tempting target for adulteration. Examples of adulterants in alcoholic beverages include excess water, ethanol not meant for human consumption (such as antiseptic or fuel additive) and the potentially toxic methanol in distilled beverages. Wine can be misrepresented by vintage and adulterated by adding sweetener, extra water, or other additives. Fruit juices are a valuable commercial product and can be subjected to saccharin adulteration, addition of low-quality sugars, and dilution with water. Likewise, honey is very valuable and is a target for adulteration with cheaper sugar products, such as corn syrup, sugar cane syrup, agave syrup (C4 sugars), rice, wheat, and beet syrup (C3 syrups) as well as misrepresenting higher quality honey with a lower quality brand. Sugar adulteration can occur by adding the cheaper sugar directly to the honey or feeding the bees with it, leading to lower quality honey. The dairy industry has many possibilities for adulteration. The value of milk varies depending on the animal of origin and lower value milk can be added to more valuable varieties of milk. For example, cow milk can be adulterated with buffalo, bovine, ovine, or caprine milk. Camel milk is one of the most valuable milks on the market and cow milk can be an adulterant in that case. Foreign proteins can be added as adulterants and this has proven to be dangerous, even in the case of other consumables like soy, pea, almond, wheat, and peanuts because they can cause food allergies in people. Peanut allergies are a common cause of food fatal and near-fatal allergies, making peanuts an especially dangerous adulterant if consumed by someone allergic to them. The high-profile cases of melamine adulteration in infant formula and pet food show the dangers of using a foreign toxic substance as an adulterant. Milk can be also be adulterated in its powdered form. Grains and flour are also potential targets for adulteration. In the case of cereals, the price is chiefly determined by protein content, starch content, and hardness which can vary greatly based on varieties and geographical origins. The same is true for rice. Both cheaper varieties and foreign substances like husk and sand have been added to adulterate cereals and rice. In the case of flour, durum wheat flour is considered to be superior in the manufacture of pasta products and is approximately 20% more expensive than common wheat, making durum wheat flour adulteration with common wheat flour a prime target. A more dangerous form of adulteration in flour is the addition of castor bean meal. Castor bean meal contains ricin, which is a toxic protein. Gluten free products have become a huge part of the food market in recent years and cross-contamination of gluten in products that are marketed as gluten-free is a form of adulteration. One example of this is adding the gluten source wheat flour to rice and corn-based products. The meat and seafood markets are extremely large across the globe and are likewise subjected to adulteration. Typical meat adulteration methods include the addition of water to increase weight and adding a lower quality meat to higher quality meat. The verification of a proper meat species is important for both ethical and religious concerns. Examples of meat adulteration include turkey meat in beef, lamb and beef with horsemeat, chicken, and pork, and veal with pork. In the case of seafood, the large global supply chain presents particular challenges in detecting adulteration. A cheaper product added as an adulterant is one form, such as mixing lower quality crab meat with higher quality. Crab meat is expensive and makes a prime target for adulteration. Other forms of seafood adulteration can be very difficult to detect. Freshly caught fish have a higher nutritional value than farm-bred fish, making fresh fish more valuable in the market. Representing farm fish as freshly caught constitutes adulteration. Frozen-thawed cycles are defined as the number of times a fish is thawed and frozen before consumption. Repeated frozen-thawed cycles will decrease the nutritional value of fish and thus can be constituted as a form of adulteration if a fish has lost nutritional value after being thawed and re-frozen multiple times. The multiple methods of adulteration that are continuously emerging present a tremendous challenge when it comes to testing and monitoring for adulteration.Monitoring and Testing
Testing for food adulteration has become a big part of food quality control. Visual examination to detect adulteration is usually insufficient for multiple reasons. In most cases, the amount of adulterant added to make an economic difference in the product is small enough that it can not be visually detected. The concentration of a toxic adulterant that is enough to make a product dangerous for human consumption is usually small enough that visual detection is impossible (such as melamine in dairy products). Adding water to meat, fresh fish vs. farm-bred fish, and multiple frozen-thawed cycles are other examples where visual detection is impossible. Thus, many methods have been developed for detecting adulteration in food and beverage products. Such analysis can vary from analyzing the headspace gases around a sealed product to free flowing, turbid, and viscous liquids to intact solid products. Headspace gas analysis is done by gas chromatography (GC). It measures the volatiles emitting from the sample and can detect the presence of inappropriate compounds, indicating the possibility of adulteration. Mass spectrometry (MS) is an effective tool for identifying the composition and structure of chemicals in a compound. GC and MS are often used in combination to identify different substances in samples and separate compounds into individual components. High-Performance Liquid Chromatography (HPLC) is often used for liquid analysis and has proven to be an effective tool in detecting many forms of food adulteration. Wet chemistry tests can be used as well and these are good for determining adulteration by measuring composition of components in food. Examples of this are acid hydrolysis and solvent extraction for fat and the Kjehdahl method for protein. These tests can be inadequate for some types of adulteration, as will be shown in the analysis of melamine adulteration in dairy products and animal feed. Morphological, microscopic, and DNA tests can be used as well depending on the food or beverage being analyzed. While these methods are usually effective, they have numerous drawbacks. They are time-consuming, expensive, and require the use of both chemicals that must be carefully handled and skilled technicians. These tests are also impossible to implement on a large scale as they are far too expensive to test multiple portions of the same batch. Sample preparation can be an extensive process and the tests may not be representative of what is occurring in a large batch of food or beverages. There is a need for fast, non-invasive testing methods for food that are cost-effective and can be representative of a large batch of food or beverage. One category of methods that fit these criteria is infrared spectroscopy. In recent years, infrared spectroscopic methods such as visible (VIS), mid-infrared (Mid-IR), and near-infrared (NIR) have shown potential for the verification of the authenticity of food and beverage products. Vibrational spectroscopy has proven to be effective in determining composition analysis, product quality assessment, and production control. Spectra can provide a global fingerprint which when combined with the application of chemometric techniques can be used to extract compositional characteristics that are not easily detected by traditional chemical analysis. Work is required to interpret the complex spectra obtained but once effective calibrations are created, they can be a very powerful tool for both qualitative and quantitative analysis of a product. There are numerous advantages over traditional techniques. Spectroscopic methods are easy to use in routine operations, environmentally friendly, cost-effective, and can be used to test a large portion of any food or beverage batch in a reasonable amount of time. They also possess the advantage of being able to measure multiple constituents in products with a single acquisition of a spectrum, provided that calibration models have been created for each parameter of interest. Out of VIS, Mid-IR, and NIR, NIR has proven to be the most effective of these three methods. NIR requires minimal if any sample preparation, can test a large portion of a sample, and has light penetration deep into the sample. VIS and Mid-IR are both inferior to NIR when it comes to sample preparation time and testing a large portion of a sample. The potential savings in the form of reduced time and cost of analyses have positioned NIR spectroscopy as not only an attractive technique with a bright future in food and beverage adulteration analysis, but for analyzing all kinds of natural products as well. Application studies have proven the effectiveness of NIR spectroscopy as a technique for adulteration detection. There is a clear role for spectroscopic techniques in the production plant and at critical points in the food and supply chain that will continue to evolve with more work as the 21st century moves forward.Analytes
Spices
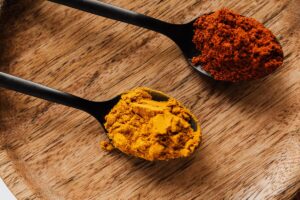
Products: Paprika, Chili Powder, Chinese Shanyao, Onion Powder, Black Pepper, Cinnamon, Goldenseal, Herbal Medicines Adulterants: Sudan Dye, Tomato Skin, Brick Dust, Starch, Buckwheat, Millet, Papaya Seeds, Chili, Spent Material, Lower Grade Cinnamon, Exhaustively Extracted Material, Yellow Root, Yellow Dock, Oregon Grape, Coptis, SibutramineOlive Oil
Products: Extra Virgin Olive Oil Adulterants: Lower-Grade Oils – Soybean, Sunflower, Corn, Canola, Hazelnut, High Oleic Acid Safflower, Peanut, Palm Olein, Refined Olive Oil Misrepresentation of Provenance of OriginSoybean and Palm Oil
Products: Soybean Oil, Palm Oil Adulterants: Transgenic vs. Non-Transgenic, LardHoney
Products: Honey Adulterants: Fructose: Glucose Mixture, High Fructose Corn SyrupAlcoholic Beverages
Products: Whiskey, Brandy, Rum, Vodka Adulterants: Water, Ethanol, MethanolNon-Alcoholic Beverages
Products: Fruit Juice, Lime Juice, Coffee Adulterants: Saccharin, Natural vs. Synthetic, CornDairy
Products: Milk, Milk Powder, Cheese, Butter, Yogurt Adulterants: Melamine, Cow Milk in Camel Milk, Dicyandiamide, Aminotriazole, Biuret, Soy Protein Isolate, Pea Protein Isolate, Calcium Carbonate, Maltodextrin, Sucrose, Authentic Origin Designation, Tallow, Edible Gelatin, Industrial Gelatin, Soy ProteinAnimal Feed
Products: Soya Bean Meal Adulterants: MelamineFlour
Products: Durum Wheat, Flour, Gluten-Free Food Adulterants: Bread Wheat, Castor Bean Meal, Caffeine, Cane Sugar, Corn Meal, GlutenMeat
Products: Lamb, Beef, Veal Adulterants: Pork Meat, Pork Fat, Chicken, Lidia Breed Horsemeat, Foal Meat, TurkeyFish and Seafood
Products: Crabmeat, Sea Bass, Tilapia Adulterants: Origin, Fresh Caught vs. Farm Bred, Frozen-Thawed CyclesSummary of Published Papers, Articles, and Reference Materials
 Thirty-nine research papers on using NIR spectroscopy to detect food fraud and adulteration in numerous segments of the food and beverage industries were examined and summarized. Food and beverage products examined were spices, edible oils, honey, alcoholic and non-alcoholic beverages, dairy, animal feed, flour, meat, and seafood. Some topics were research concerning well-publicized incidents, such as melamine in dairy products, sibutramine in herbal medicines, and horsemeat in beef. Others were more anticipating of potential adulteration in the future. The types of adulterants examined ranged from relatively innocuous to potentially fatal. Misrepresentation of origin or substituting a cheaper quality product (in most cases) constitute adulteration that may have market consequences but little threat to human health. Contamination with peanut products or gluten are two examples of a product substitution that could create health issues. Adulterants that can have severe consequences to human health include melamine, sibutramine, Sudan I dye, methanol, industrial gelatin, and castor bean meal. Some studies compared different sampling methods and types of instruments, with an emphasis on practical advantages and disadvantages in a real setting. The feasibility of using NIR spectroscopy to replace current expensive and time-consuming methods for detecting food adulteration and food fraud was presented in all studies and the results are summarized in the individual sections.
References
Recent Trends on the Use of Infrared Spectroscopy to Trace and Authenticate Natural and Agricultural Food Products – D. Cozzolino, Applied Spectroscopy Reviews, Volume 47, 2012 – Issue 7 https://www.tandfonline.com/doi/abs/10.1080/05704928.2012.667858 Non-Destructive Detection of Food Adulteration to Guarantee Human Health and Safety – Posudin, Peiris, Kays, Ukrainian Food Journal, 2015, Volume 4, Issue 2 http://ekmair.ukma.edu.ua/bitstream/handle/123456789/4214/Posudin_Non_destructive.pdf Adulterated Food Law and Legal Definition https://definitions.uslegal.com/a/adulterated-food/ Food Adulteration, Types of Food Adulteration and Mitigation Measures https://www.publichealthnotes.com/food-adulteration-types-of-food-adulteration-and-mitigation-measures/ Food Fraud Costs the Global Food Industry $10-15 Billion Annually https://www.ifis.org/blog/global-food-fraud Economically Motivated Adulteration: Is Your Brand At Risk? https://www.manufacturing.net/article/2012/09/economically-motivated-adulteration-your-brand-riskThe post Adulterant Overview appeared first on NIR-For-Food.
]]>The post Spices Adulterant Analysis appeared first on NIR-For-Food.
]]>Introduction
Spice adulteration goes back to ancient times and has been documented throughout history. Spices are considered a high value target and methods have evolved over time from the simple addition of undesirable components to increase mass to deliberate and calculated adulteration meant to mask the presence of adulterants in quality control tests. Some high-profile incidents in recent years have highlighted the need for fast and cost-effective monitoring of spice adulteration. Examples include lead oxide in paprika and Sudan I dye in chili powder, which was used in contaminated Worcestershire sauce. In the case of the withdrawn obesity medication sibutramine as an adulterant in herbal medicine, the sibutramine acts as an appetite suppressant but presents serious side effects and cardiovascular risks. While there are effective analytical methods for monitoring for spice adulteration, they are often expensive, time-consuming, and difficult to implement as a large-scale quality control method. One method that has been examined for spice adulteration monitoring is NIR spectroscopy and a summary of some research studies is presented below, including one study on herbal medicine adulteration.
Analytes
Products: Paprika, Chili Powder, Chinese Shanyao, Onion Powder, Black Pepper, Cinnamon, Goldenseal, Herbal Medicines
Adulterants: Sudan Dye, Tomato Skin, Brick Dust, Starch, Buckwheat, Millet, Papaya Seeds, Chili, Spent Material, Lower Grade Cinnamon, Exhaustively Extracted Material, Yellow Root, Yellow Dock, Oregon Grape, Coptis, Sibutramine
Scientific References and Statistics
Fast Detection of Paprika Adulteration Using FT-NIR Spectroscopy – Galaxy Scientific, Inc., Oct. 17, 2016
Spice adulteration goes back thousands of years and can take on different forms which are always evolving. Many forms of adulteration are relatively harmless in a health sense but have can have economic consequences, such as misrepresentation of the geographical origin of a product. However, when adulteration involves contamination with toxic products, the consequences can be deadly. One real-life incident was the discovery of the carcinogenic and banned food additive Sudan I dye in Worcestershire sauce, which was added by way of adulterated chili powder. Food adulteration is at the top of the list when it comes to safety concerns and there is a need for fast, non-invasive testing for adulterants as current methods are time-consuming, expensive, and often require the use of wet chemistry. One method that has been examined is NIR spectroscopy, offering the advantages of no sample preparation, high speed, and ease of use without chemicals.
 A study was conducted at Galaxy Scientific in Nashua, NH for the purpose of using FT-NIR spectroscopy to determine the presence of adulterants in paprika using tomato skin, red brick dust, and Sudan I dye. Four different paprika samples were purchased: McCormick Paprika, McCormick Gourmet Hot Hungarian Paprika, Morton & Bassett Paprika, and Spice Chain Pride of Szeged Hungarian Style Paprika. Sudan I with a dye content greater than 95% was purchased from Sigma Aldrich. Red brick was obtained from Home Depot and ground into fine powder. Tomato was purchased from a local market and the skin was peeled, dried, and ground into fine powder. Samples were mixed in the following concentrations of each adulterant:
| Sudan I Dye | 0.11 | 0.62 | 0.88 | 4.58 | 10.32 (% w/w) |
| Tomato Skin | 0.11 | 0.52 | 1.23 | 5.54 | 10.86 (% w/w) |
| Brick Dust | 0.1 | 0.68 | 1.04 | 4.77 | 14.12 (% w/w) |
Two different Galaxy Scientific QuasIR 3000 spectrometers were used to collect FT-NIR spectra of the adulterated samples as well as of each pure paprika and adulterant sample. Samples were stored in 25 X 95 mm glass vials and placed on top of the 23 mm sample window of the integrating sphere for scanning. FT-NIR spectra were collected from 10000 cm-1 to 4000 cm-1 using 4 cm-1 resolution and two hundred scans per average. Each sample was scanned twice using each spectrometer and the vial was shaken between each measurement. Spectra were averaged for each sample before visual examination and chemometric analysis.
Visual examination of the NIR spectra for all four paprika samples and all three adulterants showed distinct absorbance bands except in the case of brick dust, which was expected because it is an inorganic material. The main absorbance band in brick dust is an O-H band due to moisture. Sudan I dye has distinct absorbance bands around 4600 cm-1 and 6000 cm-1. Because both are natural organic products, the spectral features of tomato skin are very similar to paprika. The Advanced ID CLS algorithm was used to analyze the NIR spectra of the paprika and adulterant mixtures for chemometric analysis
| Sudan I Dye | R² > 0.95 for 0.11%, 0.62%, 0.88%, 4.58%, and 10.32% samples |
| Tomato Skin | R² > 0.93 for 0.52%, 1.23%, 5.54%, and 10.86% samples |
| Brick Dust | R² > 0.95 for 4.77% and 14.12% samples |
The Advanced ID algorithm extracts a spectrum from a mixture using the spectra of each individual component of the mixture. Clear differences were observed in the spectra of the paprika mixed with different concentrations of the Sudan I dye, especially in the distinctive absorbance region for Sudan I dye between 6200 cm-1 and 5800 cm-1. The high correlation coefficient shown by the algorithm indicates that Sudan I dye adulterant in paprika can be detected at a concentration as low as 0.1%. In the case of tomato skin, first derivative processing of the spectra was used because the absorbance spectra are so similar. Good correlation was shown if the tomato skin concentration was above 0.5% and this is the sensitivity for detecting tomato skin adulterant in paprika. The lack of distinctive absorbance features in NIR spectra of brick dust made it more difficult to detect low concentrations of adulteration, but results still showed good correlation for samples with 5% or higher amounts of brick dust adulterant. In practice, any real adulteration contamination will be at a high concentration to make sense economically, so the FT-NIR spectra and Advanced ID algorithm can be used as a fast screening tool to detect adulteration in Paprika with no sample preparation or use of wet chemistry.
FULL PAPER: https://galaxy-scientific.com/wp-content/uploads/2016/10/GS-A-Paprika-1.1EN.pdf
Galaxy Scientific QuasIR and Other Products: https://galaxy-scientific.com/products/
The Feasibility of Using Near Infrared and Raman Spectroscopic Techniques to Detect Fraudulent Adulteration of Chili Powders with Sudan Dye – Haughey, Galvin-King, Ho, et al., Food Control 48 (2015) 75-83
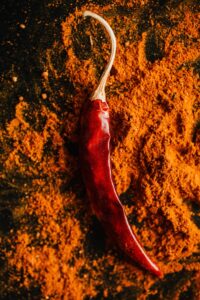 Chili powder is a valuable and globally traded commodity which has been found to be adulterated with Sudan I dye. Sudan I dye is classified as a Class 3 carcinogen and banned as a food additive. One known incident was the discovery of contaminated Worcestershire Sauce, which was made from chili powder adulterated with Sudan I Dye. Methods of adulteration are continually evolving and thus there is a demand for new testing methods that are fast and require little or no sample preparation. Both NIR and Raman spectroscopy were examined as screening tools for detecting the adulteration of chili powder with Sudan I dye. Commercial chili powder samples were purchased from local markets for the study. Different samples were spiked with Sudan I dye at the following w/w concentrations: 0.1%. 0.2%. 0.5%, 1%, 2.5%, and 5%. Pure unadulterated samples were used as well and in total, one hundred and twelve samples were procured for the study. NIR spectra were collected using a FT-NIR spectrometer operating in reflectance mode. Samples were scanned from 12000 cm-1 to 4000 cm -1 at 8 cm-1 resolution. Sixty-four scans were collected per reading and averaged into one spectrum. This process was repeated three times for each sample. In order to make the Raman spectrometer suitable for sample collection, a custom sample compartment was constructed that allowed a longer focal length collection lens to be fitted and a larger area of the sample to be scanned using a rotating sample holder. Spectra were acquired with an integration time of 5 seconds from 2000 cm-1 to 200 cm-1 at 10 cm-1 resolution. Two different chemometric software packages were used for both qualitative and quantitative multivariate analysis of both sets of spectra. Various pretreatments were applied to the NIR and Raman spectra before chemometric analysis. Principle Component Analysis (PCA) and Partial Least Squares Discriminate Analysis (PLS-DA) were used for qualitative analysis while Principal Components Regression (PCR) and Partial Least Squares (PLS) were used for quantitative analysis. The results shown below are the best obtained from the different pre-treated spectral data.
PCA (NIR and Raman)
Clear scores plot separation between pure and adulterated samples
| PLS-DA (NIR) | R² = 0.883 | |
| PLS (NIR) | R² = 0.993 | RMSEP= 0.141% |
| PCR (Raman) | R² = 0.971 | RMSEP= 0.592% |
The scores plot of a PCA shows grouping between data points and separation between two groups indicates the spectral data can be used to distinguish between the two groups. Likewise, PLS-DA uses an arbitrary grouping number for both sets of data and quantitatively predicts the number to choose the proper grouping from the data. PLS analysis of the NIR spectra showed the best results with Standard Normal Variate (SNV) and first derivative pre-processing, with high correlation and a very low RMSEP. PCR analysis of the Raman spectra showed the best results with Standard Normal Variate (SNV) and second derivative pre-processing. Correlation was still high but the RMSEP was over four times higher than the prediction error from the NIR spectra model. Results for both sets of spectra are considered good enough to use these models for screening for Sudan I Dye adulterant in chili powder, but the NIR method would be better applied in a real-time setting because of the lower prediction error and no need for a modified sample presentation method, which was the case when using the Raman instrument.
https://www.sciencedirect.com/science/article/pii/S0956713514001728
Rapid Authentication of Starch Adulterations in Ultrafine Granular Powder of Shanyao by Near-Infrared Spectroscopy Coupled with Chemometric Methods – Ma, Wang, Chen, et al., Food Chemistry 215 (2017) 108-115
Shanyao is a Chinese yam (not to be confused with the American and Canadian misnomer for sweet potato) rich in many nutritional properties. In herb form, it is used as a dietary supplement as well as a traditional Chinese medicine. Consumption of the ultrafine granular powder of Shanyao (UGPSY) is extensive and has high market demand, subjecting it to adulteration with cheaper materials such as cornstarch and wheat starch. Such adulteration degrades nutritional, physiochemical, and medicinal properties as well as creating economic loss and potential health hazards. Current methods for detecting adulteration in UGPSY include microscopic identification, HPLC, mass spectrometry, and DNA-based marker systems. These methods are often laborious, expensive, time-consuming, destructive, and difficult to implement on a large scale. NIR spectroscopy was examined as a method for determining the presence of cornstarch and wheat starch adulterants in UGPSY. Two batches of forty samples of UGPSY and locally purchased cornstarch and wheat starch were procured for the study. All samples were dried in an oven overnight and adulterated samples were prepared after drying. Adulterated samples were prepared using both types of starch and UGPSY at w/w% ranging from 10% to 95% adulterant. Pure samples were also set aside and all samples were sieved through a mill to make them homogenous. In total, one hundred and ninety-two samples were prepared. NIR spectra were collected in reflectance mode from 1100 nm to 2300 nm at 2 nm intervals. Thirty-two scans were collected for each reading and averaged into one spectrum. Various pre-processing treatments were applied to the NIR spectra before chemometric analysis. Discriminant analysis was performed using Principle Component Analysis (PCA) and Orthogonal Partial Least Squares Discriminant Analysis (OPLS-DA). Quantitative analysis of starch adulterant was performed using Partial Least Squares (PLS), Interval PLS (iPLS), and Synergy Interval PLS (siPLS). All types of samples were separated into a training set and test set in order to validate the models.
| OPLS-DA | ||
| siPLS (Cornstarch) | R² = 0.998 | RMSEP= 1.634% |
| siPLS (Wheat Starch) | R² = 0.997 | RMSEP= 2.045% |
PCA was unable to distinguish between pure samples and those adulterated with both cornstarch and wheat starch, especially at lower concentration. OPLS-DA helps interpret discriminant variation by selective wavelength analysis that removes wavelength ranges that are not correlated to class separation. The model showed that not only pure and adulterated UGSPY samples could be separated using the NIR spectra, but the cornstarch and wheat starch adulterated groups can be separated as well. Analysis of the test set samples showed that 100% correct classification was achieved from the OPLS-DA model. Both iPLS and siPLS use interval and selective wavelength analysis to improve results from a normal PLS model. The best results were shown using siPLS from the wavelengths that were chosen from the OPLS-DA model. Good correlation and low prediction error were shown for both adulterant models and the validity of the models was proven from prediction results using the test set samples. Overall, the results of this study prove the feasibility of detecting both cornstarch and wheat starch adulterants in UGSPY using NIR spectra and calibration models. These models show potential to replace the current expensive and time-consuming methods used for adulterant detection.
https://www.sciencedirect.com/science/article/pii/S030881461631189X
Detection of Starch Adulteration in Onion Powder by FT-NIR and FT-IR Spectroscopy – Lohumi, Lee, Kim, et al., Journal of Agricultural and Food Chemistry, 2014, 62, 9246-9251
Current methods that are used to authenticate spices are based on morphological, microscopic, chemical, or DNA-based characteristics. These methods are often inconvenient for routine sample analysis and can be time-consuming, expensive, and require a degree of expertise to perform the analysis. Chemical standards that are used for such analysis can be difficult to obtain or lack identifiable markers. Both FT-NIR and FT Mid-IR spectroscopy were examined to determine the feasibility of detecting starch adulteration in onion powder. Pure onion powder and 95% cornstarch were procured for the study. Before mixing, samples were dried in an oven for two hours to equilibrate the moisture since spectroscopic measurement is highly sensitive to differences in moisture. Pure samples of onion powder were set aside and adulterated mixtures were prepared by w/w% ranging from 1% to 35% starch adulterant. Ten samples of each of the pure and adulterated samples were prepared, making a total of one hundred and eighty samples. NIR spectra were collected in reflectance mode from 10000 cm-1 to 4000 cm-1 at 4 cm-1 intervals. Thirty-two scans were collected for each reading and averaged into one spectrum. Mid-IR spectra were collected using an ATR background from 4000 cm-1 to 650 cm-1 at 4 cm-1 intervals. Thirty-two scans were collected for each reading and averaged into one spectrum. Various pre-processing treatments were applied to both sets of spectra. Principle Component Analysis (PCA) was applied to determine wavelengths of interest and Partial Least Squares (PLS) analysis was performed to correlate the spectral data to the amount of starch adulterant in onion powder. Before chemometric analysis, seven types of each sample were separated into a calibration set and the remaining three types of each sample were set aside as a training set for validation analysis.
| PLS (FT-NIR) | R² = 0.98 | RMSEP= 1.18% |
| PLS (FT-IR) | R² = 0.90 | RMSEP= 3.12% |
Examination of PCA proved that the basis for visual differences in both sets of spectra were related to wavelengths known to absorb in chemical regions that make up the composition of starch. Likewise, the relevant wavelengths for the PLS regression models were contained in the same regions. Predictive analysis of the training set sample proved the validity of the models. The model from NIR spectra showed a much better predictive ability than the model from the Mid-IR spectra as well as much higher correlation and a lower RMSEP. The likely reasons for this is the ability of NIR light to penetrate far deeper into a sample than light in the Mid-IR region and a larger sampling area when using NIR. NIR light can penetrate several millimeters into a sample while Mid-IR penetration is typically measured in micrometers. The results here prove the feasibility of using spectroscopic data to monitor starch adulteration in onion powder, with NIR spectroscopy proving to be more accurate than Mid-IR spectroscopy. Similar models could be created for other types of spices using the same process to create calibrations, as it was shown that changes in starch clearly have an effect on both NIR and Mid-IR absorption that can be used to monitor for starch adulteration.
https://pubs.acs.org/doi/abs/10.1021/jf500574m
Near Infrared and Mid-Infrared Spectroscopy for the Quantification of Adulterants in Ground Black Pepper – McGoverin, September, Geladi, and Manley, Journal of Near Infrared Spectroscopy, 20, 521-528 (2012)
 The development of reliable methods to detect adulterants in food has received considerable interest in recent years. Spices in particular are considered economically worthwhile targets for adulteration due to both a high value per unit mass and specific desired flavor attributes. Vibrational spectroscopic methods are considered attractive techniques for detecting adulteration as they are information rich, fast, require little sample preparation, and are environmentally friendly. Both NIR and Mid-IR spectroscopy were examined as methods for determining the adulteration level of both buckwheat and millet in powdered black pepper. Four different batches of whole black pepper kernels were obtained from four different spice companies for the study. Whole kernels of buckwheat and millet were obtained as well. Before mixing, all samples were milled and oven dried. Each separate batch of black pepper was mixed with nineteen amounts of buckwheat and nineteen amounts of millet at 5% w/w intervals, resulting in samples from 5% to 95% of each type of adulterant. Pure amounts of each sample type were set aside as well. NIR hyperspectral data were collected using an imaging system. Images were acquired from 1000 nm to 2500 nm at 6.3 nm intervals and a spatial resolution of 300 µm x 300 µm. The images of all samples were examined to determine the heterogeneity. The spectra from each sample were averaged, resulting in a data set of one hundred and sixty-four samples with one spectrum per sample. Mid-IR spectra were collected using a diamond crystal background from 3999 cm-1 to 550 cm-1 using a spectral resolution of 4 cm-1 and a sampling interval of 1.42 cm-1. Thirty-two scans were collected per reading and averaged into one spectrum. Two duplicate spectra were collected per sample and averaged into a single spectrum. Various pre-processing treatments and selective wavelength ranges were used for both the NIR and Mid-IR spectra during chemometric analysis. Partial Least Squares (PLS) regression models were created correlating the spectral data to the percentage of adulterant in black pepper. All samples using three of the types of black pepper were used as a training set to create the calibration models and the fourth set was kept out of the model for a test set that was used to validate the models.
| NIR | R² = 0.99 | RMSEP= 2.70% |
| Mid-IR | R² = 0.96 | RMSEP= 7.25% |
The results shown above were the best obtained for each set of spectra and show that NIR spectroscopy is a much better suited technique to detect adulteration in black pepper than Mid-IR. The NIR PLS model used the wavelength range from 1100 nm to 2500 nm with Standard Normal Variate (SNV) and first derivative pre-processing. The Mid-IR model used the wavenumber ranges from 3050 cm-1 to 2800 cm-1 and 1770 cm-1 to 550 cm-1 with Multivariate Scatter Correction (MSC) pre-processing. The poorer correlation and prediction error in the Mid-IR model are a direct result of low light penetration, sample heterogeneity, and insufficient sampling area. The NIR modeling results are good enough to be used for process control purposes. NIR spectroscopy and calibration models can be used as a real-time, fast, and accurate tool for detecting both buckwheat and millet adulteration in ground black pepper requiring no sample preparation. This method has the potential to replace the time-consuming and expensive methods that are currently used for such analysis.
The Feasibility of Applying NIR and FT-IR Fingerprinting to Detect Adulteration in Black Pepper – Wilde, Haughey, Galvin-King, and Elliott, Food Control 100 (2019) 1-7
Black pepper is the most widely used spice in the world. It is cultivated in approximately twenty-six tropical countries, with India, Vietnam, and Indonesia being the main producers. It is estimated that in 2016, 430,000 tons were consumed worldwide with about 63,000 tons of that exported to Europe. The high value and complex supply chain of black pepper makes it especially vulnerable to adulteration. Two possible black pepper adulterants are papaya seeds and chili. Papaya seeds are cheap, widely available, and structurally resemble black pepper. Chili was discovered in market samples of black pepper during one study. Another form of adulteration that has been pointed out by the FDA in their guidance on authenticity of herbs and spices is extraneous matter from the same plant, referred to as spent, defatted, and depleted material. Current testing methods for black pepper adulterants are not only expensive and time-consuming, they lack the scope to adequately detect multiple forms of adulteration in the large global black pepper market. Spectroscopic methods have been shown to be low-cost, rapid, and comprehensive compared to traditional methods. The feasibility of using NIR and Mid-IR spectroscopy to detect economically motivated adulteration of black pepper was examined. After research and discussion with industry insiders, papaya seeds, chili, black pepper husk, and black pepper spent material were chosen as the adulterants for the study. A total of one-hundred and fifteen black pepper samples from six different countries were procured for the study. At least two different types of each adulterant were acquired. All samples were ground to a homogeneous powder before mixing. Three separate pepper pools were prepared by mixing different combinations of the black pepper samples. For each pool, pure samples were set aside and the remaining samples were spiked with each of the four adulterants from 10 g/100 g to 40 g/100 g to make the spiked samples. For both methods, spectra were collected of the pure black pepper samples, pure adulterant samples, and spiked samples. NIR spectra were collected from 12000 cm-1 to 4000 cm-1 at 8 cm-1 resolution. Thirty-two scans were collected per reading and averaged into one spectrum. Three replicates of each sample were scanned and averaged before data pre-processing. Mid-IR spectra were collected from 4000 cm-1 to 400 cm-1 using an ATR accessory. Thirty-two scans were collected per average at 4 cm-1 resolution. Different pre-processing methods were applied to both sets of data before chemometric analysis. Principle Component Analysis (PCA) was first conducted to analyze the differences in spectra of pure black pepper with different geographical origins as well the differences in pure black pepper vs. adulterated samples. The pure black pepper and pure adulterant spectra were used to create a binary classification Orthogonal Projections to Least Structures Discriminant Analysis (OPLS-DA) model. Forty-eight spectra of the spiked samples and thirty spectra of the pure black pepper samples were used as a test set to validate the model.
| NIR | R² = 0.93 |
| Adulteration 0% | Correct Classification: 90% |
| All Adulterants 10-40% | Correct Classification: 100% |
| Spent/Husk 10-20% | Correct Classification 100% |
| Spent/Husk 20-30% | Correct Classification 100% |
| Papaya/Chili 10-20% | Correct Classification 100% |
| Papaya/Chili 20-30% | Correct Classification 100% |
| Mid-IR | R² = 0.83 |
| Adulteration 0% | Correct Classification: 93% |
| All Adulterants 10-40% | Correct Classification: 98% |
| Spent/Husk 10-20% | Correct Classification 100% |
| Spent/Husk 20-30% | Correct Classification 100% |
| Papaya/Chili 10-20% | Correct Classification 92% |
| Papaya/Chili 10-30% | Correct Classification 100% |
Classification results for the test set data were excellent for the NIR model, with a lower correlation and higher prediction error for the Mid-IR model but still good. The analysis above shows the threshold of sensitivity that the predictivity of the model could reasonably be expected to meet. In practice, an adulteration level less than 10% would provide little economic benefit while a level higher than 40% would be high enough to risk the discovery of the adulterant by visualization alone. The most important conclusion is that the classification will work simply from a model created from pure black pepper samples and pure adulterants. In practice, many more types of black pepper and adulterants would need to be added to make a universal model robust enough to accurately detect and classify any adulterants. The research here shows great potential for finding adulterants in black pepper using spectroscopic methods.
https://www.sciencedirect.com/science/article/pii/S095671351830639X
Rapid Authentication and Quality Evaluation of Cinnamomum Verum Powder Using Near-Infrared Spectroscopy and Multivariate Analyses – Shawky, Selim, Planta Med 2018: 84: 1380-1387
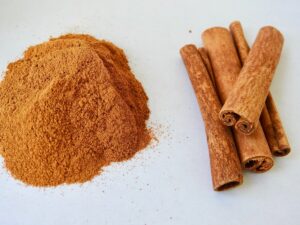 Ceylon Cinnamon is the inner bark of the tree of Cinnamomum Verum and is often referred to as “true cinnamon”. As well as being one of the tree species used for manufacture of high-quality cinnamon spice, it is widely incorporated in the medicinal and cosmetic industry. The bioactive content of cinnamon-based products has been of great interest to both manufacturers and consumers in recent years. Because Ceylon cinnamon is such a valuable product, it is often subjected to adulteration. Cinnamomum Cassia, known as Chinese Cassia, is closely related to Ceylon cinnamon but has a rougher, thicker, and less aromatic bark, making it a cheaper and lower quality product. Another method of adulteration is to add exhaustively extracted Ceylon cinnamon to genuine Ceylon cinnamon. In the case of Chinese Cassia, adulteration can be dangerous for human consumption because it contains high amounts of coumarin, a blood-thinning agent that can be toxic if consumed in excessive amounts. The only known methods that can distinguish between Ceylon cinnamon and Chinese Cassia are expensive and time-consuming, such as HPLC-MS. NIR spectroscopy was examined as a method for detecting both Chinese Cassia and exhaustively extracted Ceylon cinnamon adulterants in pure Ceylon cinnamon. Twenty-seven authenticated samples each of Ceylon cinnamon and Chinese Cassia were procured for the study. Samples were dried, powdered, and passed through a sieve. Exhaustively extracted samples were prepared by hydrodistillation from cinnamon barks and were subsequently dried and powdered. For both types of adulterant, samples were prepared by mixing with the pure samples from 5% to 95% at 5% intervals. Triplicate samples at each value were prepared in this fashion. NIR spectra were collected using an FT-NIR spectrometer from 8000 cm-1 to 4000 cm-1 at 16 cm-1 resolution. Sixty-four scans were collected per reading and averaged into one spectrum. This process was repeated three times for each sample and the three spectra were averaged into one spectrum before chemometric analysis. Standard Normal Variate (SNV) and first derivative pre-processing methods were used to eliminate baseline drift and enhance differences between the spectra. Principle Component Analysis (PCA) was used to analyze differences in the spectra between groups. A SIMCA classification model was created to determine the feasibility of separating pure Ceylon cinnamon, both adulterants, and the Ceylon cinnamon samples mixed with both adulterants. Partial Least Squares (PLS) regression models were created to correlate the NIR spectra to the amount of adulterant in the Ceylon cinnamon.
SIMCA:
100% correct classification of all samples
PLS:
| Chinese Cascia | R² = 0.988 | RMSEP= 0.041 %/g |
| Exhaustively Extracted | R² = 0.9871 | RMSEP= 0.048 %/g |
The results for the SIMCA model and both PLS models were excellent and proved the feasibility of using NIR spectra to identify and quantify both types of adulterants. Validation of the SIMCA model correctly classified all samples at a 95% confidence level. Cross validation of the PLS models provided independent predictions for all samples and confirmed the validity of the models. Most predictions had an error lower than 1% and no prediction had an error greater than 2%. NIR spectroscopy shows great potential for use as a screening tool to replace the current expensive and time-consuming methods for determining the presence of adulterant in the valuable Ceylon cinnamon.
FT-NIR Characterization with Chemometric Analyses to Differentiate Goldenseal from Common Adulterants – Liu, Finley, Betz, Brown, Fitoterapia 127 (2018) 81-88
Goldenseal is a native North American herb that has been popular since the 1970s and is mostly used for the antimicrobial properties of the roots and rhizomes. It is found in a wide range of products including eardrops, feminine cleansing products, cold and flu remedies, allergy relievers, laxatives, and digestion aids. In 2016, goldenseal had global sales over $31 million in the Nutrition Industry sector. It exists in both wild and cultivated form. The demand has led to a sharp reduction in wild goldenseal, even placing it on the endangered species list in some states, while cultivated goldenseal is both resource intensive and more expensive for both the producer and consumer. International trade requires a CITES (Convention for International Trade in Endangered Species of Wild Fauna and Flora) permit to ensure the plant is four years old and was legally obtained. Adulteration with visually similar but cheaper and more accessible plants has become prevalent. One test of market samples discovered that one in three goldenseal materials was mixed with the following plants: Oregon grape, yellow dock, yellow root, and coptis, all similar in morphology and phytochemistry to goldenseal. Visual inspection is often insufficient for discovering these adulterants, especially when the materials in trade have already been processed as biomass or extracts. Tests for some alkaloids that are unique to goldenseal are effective but expensive and time-consuming while requiring skilled technicians to implement them. NIR spectroscopy was examined as a method for detecting the presence of common adulterants in goldenseal. Plant materials of goldenseal, coptis, Oregon grape, yellow dock, and yellow root were purchased from the American Herbal Pharmacopeia and Chromadex. All varieties were authenticated using at least two methods outlined by authoritative references and verified by a Professor of Horticulture. All samples were ground into powder and twenty grams of each material was homogenized for the test. 1.5 grams were removed from each pool, sent for FT-NIR analysis, and returned to the pool. This process was replicated five times for each type of plant. NIR spectra were collected using an FT-NIR spectrometer from 8998 cm-1 to 4200 cm-1 using 8 cm-1 resolution and thirty-two scans per average. A theoretical adulteration was created using the goldenseal spectra and spectra of each adulterant. The 100% goldenseal spectrum was used with the 100% adulterant spectrum to create desired ratios. For example, 2% adulteration was calculated by the sum of 0.98 of the goldenseal spectrum and 0.02 of the adulterant spectrum. For each adulterant, this process created five spectra each at the following adulterant levels: 2%, 5%, 10%, 15%, 20%, 25%, 50%, 75%, and 95%. Various pre-processing algorithms were performed on the spectra before chemometric analysis. Three types of chemometric models were created for the purpose of differentiating pure goldenseal from the pure four adulterants and detecting the presence of an adulterant in goldenseal: Partial Least Squares (PLS), Soft Independent Modeling of Class Analogy (SIMCA), and Moving Window Principle Component Analysis (MW-PCA).
| All Three Models: | Successful separation of pure goldenseal and an adulterant amongst all adulterants |
| PLS: | Unable to accurately predict whether or not the tested materials were 100% target material or accurately quantify percentages of mixed materials |
| SIMCA: | Best results for detection of yellow root and Oregon grape – can detect both at 10% or higher |
| MW-PCA | Best results for detection of yellow dock and coptis – can detect yellow dock at 15% or higher and coptis at 5% or higher |
Analysis of all three models showed that they could successfully discriminate between the spectra of pure goldenseal and each adulterant. However, the results varied based on model type when attempting to classify an adulterated sample of goldenseal. PLS proved to be poor for quantifying the percentage of goldenseal and adulterant in an adulterated sample. Independent predictions of pure goldenseal using PLS ranged from 66% to 104%. Similar poor results occurred for predictions of pure adulterants and in the case of yellow root, the amount of goldenseal predicted was almost 20% despite no goldenseal being present in the sample. It is possible that the results will improve with more goldenseal samples in the calibration set and with actual mixing of the samples rather than calculating ratios of adulterant using the pure spectra of goldenseal and the adulterant. The study also did not attempt to create individual PLS models for each adulterant and golden seal. This analysis could potentially improve the results as well. Better results were obtained using the classification algorithms SIMCA and MW-PCA. Both types of models were analyzed for all four adulterants and as shown above, SIMCA gave better results for yellow root and Oregon grape while MW-PCA gave better results for yellow dock and coptis. The potential was demonstrated in this study to use NIR spectroscopy and chemometric modeling to detect adulteration in goldenseal but the results warrant careful analysis. As demonstrated by the varying results from different algorithms, the specific approach for creating models must be carefully evaluated and selected on a case-by-case basis if the desired results are to be achieved. Such models must be validated carefully before implementing them for real-time analysis.
https://www.sciencedirect.com/science/article/pii/S0367326X17316970
Near Infrared Spectroscopy Detection and Quantification of Herbal Medicines Adulterated with Sibutramine – da Silva, Honorato, Pimental, et al., Journal of Forensic Sciences, September 2015, Vol. 60, No. 5
There is an increasing demand for herbal medicines to treat obesity. The impression on consumers is that such medicines are safer than synthetic drugs for weight loss and have minimal side effects. However, a number of incidents have shown the detection of synthetic chemicals as an adulterant in herbal medicines. One such substance is sibutramine, an inhibitor of the neurotransmitters serotonin and norepinephrine which decrease appetite. Side effects include an increase in blood pressure and pulse rate as well as elevated risk of heart attack and stroke. Sibutramine has a difficult history including reports of health issues, studies showing the cardiovascular risks, and US Senate hearings, eventually resulting in the withdrawal of the product in the US market by its manufacturer Abbott Laboratories in 2010. In 2008 and 2009, the FDA both issued alerts and recalled products marketed as “herbal supplements” and “dietary supplements” for containing sibutramine. Similar incidents occurred in other countries. Despite the withdrawal of the product in the US market, sibutramine has continued to be found in dietary supplements as recently as 2018. Analytical methods have been developed and proven to be effective in detecting sibutramine adulteration. These include liquid chromatography with mass spectrometry (LC-MS), capillary electrophoresis (CE), and nuclear magnetic resonance (NMR). While effective, these methods are expensive, time-consuming, require the use of chemical reagents, destroy the samples tested, and are ill-suited to implement on a large scale for routine analysis. NIR spectroscopy was examined as a method for detecting sibutramine adulterant in herbal medicines which are intended for use as a weight loss supplement. Thirteen different commercial herbal medicine samples and pure sibutramine were procured for the study. A standard liquid chromatography method was employed to test the herbal medicines and sibutramine was found in four of them at the following concentrations (w/w): 0.018%, 0.033%, 0.358%, and 0.44%. For the nine pure samples, a portion was set aside of each and the rest were spiked with sibutramine at concentrations ranging from 1% to 6%. Both the originally adulterated and spiked samples were ground and homogenized. In total, fifty-five samples were used: nine pure herbal medicines, the four commercial samples found to be adulterated, and forty-two spiked samples. A FT-NIR spectrometer was used to collect NIR reflectance spectra from 14000 cm-1 to 4000 cm-1 at 2 cm-1 nominal resolution. One hundred twenty-eight scans were collected per reading and averaged into one spectrum. Each sample was collected in triplicate and the vial was removed and placed back in the sample holder before collecting a new spectrum. Various pre-processing methods were applied to the NIR spectra before chemometric analysis. Three separate modeling algorithms were applied. Partial Least Squares Discriminant Analysis (PLS-DA) was used to classify samples based on being pure or having an adulterant present. Partial Least Squares (PLS) and Multiple Linear Regression (MLR) were used to quantify the amount of sibutramine present in a sample.
| PLS-DA | 100% classification of validation set samples | |
| PLS | R² = 0.996 | RMSEP= 0.22% |
| MLR | R² = 0.996 | RMSEP= 0.18% |
All modeling results were excellent and proved the feasibility of using NIR spectroscopy and calibration models to detect sibutramine adulteration. PLS-DA assigns an arbitrary number to two groups and uses those numbers to classify the groups from NIR spectra. Ten adulterated and three non-adulterated samples were pulled from the model and their spectra were used as a validation set. All samples were classified correctly. PLS correlates a reference value to the NIR spectra and likewise, independent prediction results proved the validity of the model. In the case of MLR, selective wavelengths are chosen for the regression and the selected algorithm chose four individual wavelengths. Results were very similar to the PLS model and the difference can be considered statistically insignificant. The potential was shown for using NIR spectroscopy and calibration models as a real-time tool for the detection of sibutramine adulteration in herbal medicines. This method offers an alternative to traditional methods that are time-consuming, expensive, require the use of chemical reagents and skilled labor, and are unsuitable for implementing for large-scale testing.
https://onlinelibrary.wiley.com/doi/abs/10.1111/1556-4029.12884
The post Spices Adulterant Analysis appeared first on NIR-For-Food.
]]>The post Non-Alcoholic Beverages Adulterant Analysis appeared first on NIR-For-Food.
]]>Introduction
Non-alcoholic beverages are subject to adulteration in many different forms. Sugar-based drinks, especially fruit juice, are valuable and can be diluted with water or adulterated with cheaper sugar or saccharin. High carbohydrate foods and beverages can be difficult for adulteration detection because of similarities in carbohydrate profiles with commercial sweeteners. Dilution with sugar water and citric acid can be undetectable by standard tests. Purity assessments are important in all forms of non-alcoholic beverages. The coffee market has especially grown in recent years and there are many potential adulterants of coffee, such as corn, sticks, coffee husks, and in the case of Arabica which is the most valuable coffee bean, a cheaper variety of coffee. Current quality tests are often insufficient for proper adulterant detection as well as being expensive and time-consuming. NIR spectroscopy has been examined as a method for detection of adulterants in non-alcoholic beverages and the results of some studies are shown below.Analytes
Products: Fruit Juice, Lime Juice, Coffee Adulterants: Saccharin, Natural vs. Synthetic, CornScientific References and Statistics
Applications of FT-NIRS Combined With PLS Multivariate Methods For the Detection & Quantification of Saccharin Adulteration in Commercial Fruit Juices – Mabood, Hussain, Jabeen, Food Additives and Contaminants: Part A, 2018, Vol. 35, No. 6, 1052-1060 Detecting adulteration in foods that are high in carbohydrates can be difficult because there are a variety of commercial sweeteners that match the concentration profile of major carbohydrates. One potential method for detecting commercial sweetener adulterants in fruit juice is NIR spectroscopy and this study examined detecting and quantifying saccharin adulteration for this purpose. Six different commercial fruit juices were obtained for the study. Each sample was spiked with saccharin ranging from 0.10% to 2.00% w/v at varying intervals. The pure samples with 0% saccharin were used as well and in total, one hundred ninety-eight samples were used. Eighteen were pure juice samples and the remainder were spiked with saccharin. FT-NIR spectra were collected for all samples from 10000 cm-1 to 4000 cm-1 using a sealed cell at 0.20 mm pathlength and 2 cm-1 resolution. Various pretreatments were performed on the spectral data for model optimization. Three separate modeling algorithms were used: Principle Component Analysis (PCA) and Partial Least Squares Discriminant Analysis (PLS-DA) for classifying adulterated and non-adulterated samples and Partial Least Squares (PLS) for quantifying amount of saccharin present based on the NIR spectra and reference values for saccharin.PLS-DA Classification:
| R² = 0.979 | RMSEP= 0.067 |
PLS
| R² = 0.970 | RMSEP= 0.88% of 0% to 2% Saccharin range (w/v) |
| Principle Component Analysis (PCA) | Classification Accuracy 66% |
| Support Vector Machine (SVM) | Classification Accuracy 97% |
| Genetic Algorithm (GA) | Classification Accuracy 93% |
Coffee
Detection of Corn Adulteration in Brazilian Coffee (Coffea Arabica) by Tocopherol Profiling and Near-Infrared (NIR) Spectroscopy – Winkler-Moser, Singh, Rennick, et al., Journal of Agricultural and Food Chemistry, 2015, 63, 10662-10668 Coffee is considered a high-value commodity that is a frequent target for adulteration, as are many other food and beverage products. There is significant interest in developing and improving methods for detecting coffee adulteration and one such method that has been examined is NIR spectroscopy. Potential adulterants for coffee include corn, sticks, coffee husks, and other lower value crops. Fourteen different lots of green Arabica coffee beans from different cities and plantations in Brazil were procured for the study. All coffee samples were roasted as well as corn to be added as an adulterant. Both the coffee and corn were ground before mixing. Five different concentrations of corn adulterant were added and mixed with each sample ranging from 1% to 20% corn. In addition, the pure Arabica sample from each lot was used as well, making for a total of eighty-four samples. Samples were scanned using an NIR spectrometer from 400 nm to 2500 nm. Tocopherol content was chosen as a basis for determining the percentage of corn adulteration and reference values for tocopherol in the samples were determined using HPLC. The HPLC results and a Multiple Linear Regression (MLR) equation were used to correlate the tocopherol profile results to the percentage of corn adulteration. This correlation was then used as a reference value to correlate the NIR spectra to % corn adulteration using Partial Least Squares (PLS) analysis.
| % Corn Adulterant | R² = 0.986 | RMSEP = 1.171% |
The post Non-Alcoholic Beverages Adulterant Analysis appeared first on NIR-For-Food.
]]>The post Meat Adulterant Analysis appeared first on NIR-For-Food.
]]>Introduction
Meat products are a valuable and large portion of the worldwide food market. The quality and market pricing of different grades of meat can vary greatly, making meat a prime target for adulteration with lower-quality products. An incident in England where horsemeat was found in burgers at a prominent supermarket chain resulted in a large drop in market value for the company. Minced meat is difficult for adulteration detection by visual inspection, especially when the adulterant is in a low quantity, although any adulteration of a meat product is likely to be fairly high in order to obtain economic benefit. Lamb, veal, and certain grades of beef are some of the more valuable meat products. Potential adulterants of meat products include pork, chicken, cattle meat, foal meat, and turkey. NIR spectroscopy has been examined as a method for determining the presence of adulteration in meat products and the results of some studies are documented below.
Analytes
Products: Lamb, Beef, Veal Adulterants: Pork Meat, Pork Fat, Chicken, Lidia Breed Horsemeat, Foal Meat, Turkey
Scientific References and Statistics
Detection of Minced Lamb and Beef Fraud Using NIR Spectroscopy – Lopez-Maestresalas, Insausti, Jaren, Food Control 98 (2019) 465-473
Food fraud and adulteration have presented a significant challenge to both industry and government. Meat products especially present a challenge because it is not easy to identify fraud or incorrect labeling, both of which can result in severe consequences for manufacturers and the market. In some cases, these things can constitute a health risk as well. In 2013, an incident with the discovery of horsemeat in burgers led to a significant hit in profits and reputation of the UK supermarket chain Tesco, which suffered a 300€ million drop in market value. Typical cases of meat adulteration usually result in the substitution of a cheaper species in a higher quality and more expensive meat. While numerous studies have been conducted using NIR spectroscopy to identify adulteration in meat products, most of these have reported results for levels of adulteration over 2%. In this study, NIR spectroscopy was examined for detecting low levels of adulteration in both pure lamb and pure beef. Samples of lamb, beef, pork, Lidia breed cattle, foal meat, and chicken breast were procured for the study. All individual samples were trimmed to remove remaining skin and fat, minced, and homogenized before mixing. Each prepared sample weighed 4 g. For both pure lamb and pure beef, each adulterant was mixed with the pure meat at the following ratios by weight: 0%, 1%, 2%, 5%, and 10%. Replicates were made of all samples and after all the samples were mixed, there were two hundred total lamb samples (forty pure and one hundred sixty adulterated) and one hundred eighty-six total beef samples (thirty pure and one hundred fifty-six adulterated). NIR reflectance spectra were collected from 1100 nm to 2300 nm at 2 nm intervals. Fifty scans were collected per reading and averaged into one spectrum. This process was repeated five times for each sample, moving the sample each time before scanning. The five acquired spectra for each sample were then averaged, making one single spectrum per sample. Various pre-processing methods were applied to the NIR spectra. Principle Component Analysis (PCA) was performed to explore the structure of the data and identify any separation among the groups of samples. For each pure meat and adulterant, Partial Least Squares Discriminant Analysis (PLS-DA) was performed to classify pure meat and adulterated samples. Each group was separated into a training set to create the classification model and a test set for model validation.
PLS-DA
| Lamb and pork meat | Correct Classification – 90% |
| Lamb and chicken | Correct Classification – 79.16% |
| Lamb and Lidia breed cattle | Correct Classification – 86.36% |
| Lamb and foal meat | Correct Classification – 85% |
| Beef and pork meat | Correct Classification – 80% |
| Beef and chicken | Correct Classification – 78.95% |
| Beef and Lidia breed cattle | Correct Classification – 95.24% |
| Beef and foal meat | Correct Classification – 100% |
PLS-DA assigns an arbitrary value of 0 and 1 to two groups for classification purposes and predicts a value for the number from the model and NIR spectra. In this case, the best results were obtained for the pure beef adulterated with cattle meat and foal meat. The analysis in the study did not make it clear whether the incorrect classifications were obtained for the pure meat, lower level of adulterant, or higher level of adulterant. Despite the homogenized samples, in practice it is quite difficult to fully mix a small amount of adulterant in a meat sample. However, the results certainly prove the feasibility of detecting both cattle and foal meat adulterants in beef products and could be used as a screening tool for pork and chicken in beef and all four adulterants in lamb. Since an adulteration level of less than 20% is impractical for economic purposes and higher levels of adulteration would likely improve the results shown here, the study does show that NIR spectroscopy can be used as a method for detecting adulterants in lamb and beef products.
https://www.sciencedirect.com/science/article/pii/S0956713518306030
Methods for Detection of Pork Adulteration in Veal Product Based on FT-NIR Spectroscopy for Laboratory, Industrial, and On-Site Analysis – Schmutzler, Beganovic, Bohler, Huck, Food Control 57 (2015) 258-267
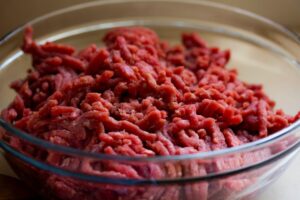 In today’s food market, controls are essential to check authenticity and protect from harmful frauds. Adulteration can have tough consequences for market confidence, especially in the high price segment. Regulations exist but testing methods are often expensive and time-consuming as well as ill-suited to implement on a large scale. There is a need for new and feasible analytical methods that can continually evolve to meet the changes and challenges that are presented when monitoring for food fraud and adulteration. One such method that has been examined is NIR spectroscopy in numerous verticals in the food and beverage markets. NIR spectroscopy offers numerous advantages over traditional analytical methods, such as speed, ease-of-use, little or no sample preparation, non-invasive measurements, and the ability to measure multiple parameters of interest with one reading once the proper calibrations are created. One consideration when using NIR spectroscopy is the proper location and ideal point of product creation and manufacturing for implementing measurements. This study compared methods for detecting pork adulteration in veal sausage using NIR spectroscopy and three separate sampling methods: laboratory, industrial, and on-site. The same FT-NIR spectrometer was used for the laboratory and industrial methods. The laboratory setting used a measurement cup for sampling and the industrial setting used a fiber optic probe. A laboratory instrument can be expected to optimize performance while an industrial instrument offers the advantage of non-contact measurements and the potential to measure in an on-line setting. The on-site setting used a handheld portable spectrometer, making it suitable for quick inspections and spot testing in shops and markets. The portability of handheld instruments offers advantages but they can have several drawbacks as well. A pure veal sausage product and both pork and pork fat as adulterants were procured for the study. The pork was added in 10% w/w increments up to 50% pure veal and 50% pork. The same process was repeated for the pork fat. Since the sausages contain 76% veal meat and 14.4% veal fat, there is a substantial difference in the actual weight added for the % adulterant between pork and pork fat. Samples were homogenized, divided into multiple portions, and a portion of each sample was placed in polymer packaging to be used in the industrial and on-site settings. For the FT-NIR spectrometer used in both the laboratory and industrial settings, scanning parameters were the same: 12500 cm-1 to 4000 cm-1, 8 cm-1 resolution, and thirty-two averaged scans per spectrum. Quartz cuvettes were used for the laboratory and no extra preparation was needed for the industrial. Seventy-two samples were scanned in total for the laboratory and eighty-four for the industrial. The additional twelve samples for the industrial were scanned through the polymer packaging. For the on-site setting, the following scanning parameters were used: 6267 cm-1 to 4173 cm-1, 21 cm-1 resolution, and six scans per average. Both the quartz cuvettes prepared for the laboratory and the polymer packaged samples were scanned using the handheld spectrometer. Various pre-processing treatments were applied to all NIR spectra before chemometric analysis. Both Principle Component Analysis (PCA) and Support Vector Machine (SVM) were developed to analyze the feasibility of classifying adulterated veal samples from all three sets of NIR spectra.
Pork Adulterant:
| Laboratory | 100% Correct Classification from 10% to 50% adulterant |
| Industrial with Quartz Cuvette | 100% Correct Classification from 10% to 50% adulterant |
| Industrial with Polymer Packaging | 100% Correct Classification from 20% to 50% adulterant, 91.7% Correct Classification for 10% Adulterant |
| On-site with Quartz Cuvette | 100% Correct Classification from 10% to 50% adulterant |
| On-site with Polymer Packaging | 100% Correct Classification from 20% to 50% adulterant, 83.3% Correct Classification for 10% Adulterant |
Pork Fat Adulterant:
| Laboratory | 100% Correct Classification from 10% to 50% adulterant |
| Industrial with Quartz Cuvette | 100% Correct Classification from 10% to 50% adulterant |
| Industrial with Polymer Packaging | 100% Correct Classification from 10% to 50% adulterant |
| On-site with Quartz Cuvette | 100% Correct Classification from 20% to 50% adulterant, 83.3% Correct Classification for 10% adulterant |
| On-site with Polymer Packaging | 91.7% Correct Classification for 50% and 40% adulterant, 83.3% Correct Classification for 30% Adulterant, 75% Correct Classification for 20% and 10% adulterant |
The results shown above warrant analysis to determine the advantages and disadvantages of using all three sampling methods to determine pork and pork fat adulteration in veal sausages. Both the laboratory and industrial settings showed 100% correct classification for both pork and pork fat adulterants, with the exception of the polymer packaging in pork with a 91.7% correct rate. Results were similar for pork for on-site but considerably worse for pork fat for on-site, especially when using the polymer packaging. In practice, the advantages gained from using a handheld spectrometer would not be applicable if the sample was placed in a cuvette. The poor results can be attributed to a much shorter wavenumber range and lower spectral resolution and signal-to-noise ratio. It also must be noted that the composition of the sausages is about 76% veal and 14.4% veal fat, meaning that a 10% w/w adulteration for the meat is considerably more than the same for fat, requiring a much higher sensitivity for detection of fat adulteration. Despite the poorer results with the handheld instrument, a real-life veal adulteration incident is likely to have a very high percentage of adulterant present and a handheld spectrometer could work as a screening tool. The results may improve for the handheld instrument with more samples and model optimization. Overall, the advantages and disadvantages of all three sample setups must be considered but it is clear that the FT-NIR spectrometer can provide much better results than a handheld spectrometer.
https://www.sciencedirect.com/science/article/pii/S0956713515002364
Identification and Quantification of Turkey Meat Adulteration in Fresh, Frozen-Thawed, and Cooked Minced Beef by FT-NIR Spectroscopy and Chemometrics – Alamprese, Amigo, Casiraghi, Engelsen, Meat Science 121 (2016), 175-181
Turkey Adulteration in Fresh, Frozen-Thawed, and Cooked Minced Beef Samples
In the past, meat was usually marketed as fresh and contained recognizable cuts, making adulteration difficult. With the advent of processing and mincing, meat has become a target for adulteration. Mincing, freezing, and cooking modify the morphological characteristics of meat, making it difficult to distinguish a mixed adulterant from the proper meat. NIR spectroscopy was examined as a method for determining turkey adulteration in fresh, frozen-thawed, and cooked minced beef samples. Eleven different batches of beef bottom round meat and eleven batches of turkey breast meat were minced separately and used to prepare mixtures with different percentages of turkey meat. All mixtures were scanned as well as the pure beef and turkey. All samples were frozen for six months, thawed, and scanned. After thawed, the samples were cooked in a microwave, cooled, and scanned once again.
| Fresh | R² = 0.925 | RMSEP = 8.09% |
| Frozen-Thawed | R² = 0.898 | RMSEP = 9.39% |
| Cooked | R² = 0.916 | RMSEP = 8.46% |
Both Partial Least Squares (quantification) and PLS-DA (classification) models were used for this study. Results show the potential of using NIR spectroscopy as a reliable tool for the rapid identification and quantification of turkey adulteration in all three types of samples. The classification model can distinguish between adulteration levels less than & greater than 20%. While the quantification models are unable to measure the adulteration level if it is less than 20%, this is not of practical importance in a real-time setting because any adulteration that is economically worthwhile is very likely to exceed 20% turkey meat.
https://www.sciencedirect.com/science/article/abs/pii/S0309174016301826
The post Meat Adulterant Analysis appeared first on NIR-For-Food.
]]>The post Honey Adulterant Analysis appeared first on NIR-For-Food.
]]>Introduction
Honey is a pure and valuable product that does not allow for the addition of any other substance. It is more expensive than other sweeteners and is thus subject to adulteration with cheaper sweeteners like cane sugar, beet sugar, and high fructose corn syrup. Another form of honey adulteration is misrepresentation of origin. Harvest statistics of the expensive Manuka honey from New Zealand have shown that only 1,700 tons are harvested per year, yet global sales have been reported as high as 10,000 tons per year. This clearly indicates a large misrepresentation of cheaper honey as Manuka. Effective testing methods exist for honey purity but they are expensive and difficult to implement on a large scale. NIR spectroscopy has been examined as a method for detecting adulteration of honey and the results of some studies are summarized below.
Analytes
Products: Honey
Adulterants: Fructose: Glucose Mixture, High Fructose Corn Syrup
Scientific References and Statistics
Detection of Adulterants Such As Sweeteners Materials in Honey Using Near-Infrared Spectroscopy and Chemometrics – Zhu, Li, Shan, et al., Journal of Food Engineering 101 (2010) 92-97
Honey is a sweet and viscous product derived from honey bees and the nectar of flowers. By definition, it is a pure product that does not allow for the addition of any other substance. It is naturally sweet, can be consumed by humans without processing, and has significant nutritional and medicinal benefits. The price of honey is much higher than other sweeteners, such as cane sugar, beet sugar, and corn syrup. Because it is such a valuable product, honey is subject to adulteration with cheaper sweeteners. Studies have been conducted using analytical techniques like isotopic methods, chromatographic methods, thermal analysis, and nuclear magnetic resonance (NMR) to detect adulteration in honey. While effective, these tests can be time-consuming, expensive, destructive of the analyzed product, and are ill-suited for large scale analysis. NIR spectroscopy offers a fast and less expensive alternative to traditional methods and the feasibility of using NIR spectroscopy for detecting honey adulteration was examined in this study. Sixty-eight honey samples from six floral origins were procured for the study. Before NIR spectra were collected, the samples were incubated overnight, stirred to ensure a uniform mixture, and adjusted to a standard solids content of 70° Brix to avoid variance in the spectra from naturally occurring differences in sugar concentration. Fructose: glucose mixtures were dissolved in distilled water at the following ratios: 0.7:1, 1.2:1, and 2.3:1. A portion of twenty-five honey samples were chosen and each was adulterated with the mixtures at the following ratios: 7%, 14%, 21%, and 28% (w/w). In all, sixty-eight of these were chosen for NIR spectra collection to keep the number of pure and adulterated samples even, as an uneven number of samples when doing classification analysis can risk overfitting of the model. NIR spectra were collected from 10000 cm-1 to 4000 cm-1 at 3.856 cm-1 intervals. Thirty scans were collected per reading and averaged into one spectrum. This process was repeated in triplicate for every sample and the three resulting spectra were also averaged. Smoothing and standard normal variate (SNV) were applied as preprocessing methods before chemometric analysis. The Kennard-Stone algorithm was used to divide samples into a training set (ninety-four samples) and test set (forty-one samples). Both Wavelet Transformation (WT) and Principle Component Analysis (PCA) were used to compress the spectral data and as a means for variable selection. Five different classification algorithms were used to assess classifying the samples into pure and adulterated groups from the training set NIR spectra. The test set NIR spectra were then used to predict a group for those samples.
The five modeling algorithms used were Least Square Support Vector Machine (LS-SVM), Support Vector Machine (SVM), Back Propagation Artificial Neural Network (BP-ANN), Linear Discriminant Analysis (LDA), and K-Nearest Neighbors (KNN). LS-SVM correctly classified over 95% of the test set samples with the other four algorithms ranging from 82.9% to 90.2%. In order to verify that this model is suitable for use in a practical setting, further analysis is warranted to determine that the calibration is actually detecting the cheap sugar adulterant and not the addition of distilled water. Water is very absorbing of NIR light and even small changes result in a change in the water absorbing wavelength ranges. Examination of which wavelength ranges are being used for the calibration will determine if this is the case but such analysis was not presented in the paper. Careful analysis of wavelength ranges of interest as well as the inclusion of more samples from different origins will be necessary before using this model in a real setting.
https://www.sciencedirect.com/science/article/abs/pii/S0260877410003043
Rapid Quantification of Honey Adulteration by Visible-Near Infrared Spectroscopy Combined with Chemometrics – Ferreiro-Gonzalez, Espada-Bellido, Guillen-Cueto, et al., Talanta 188 (2018) 288-292
Honey has been produced by bees since ancient times from flower nectar for its sweet taste, nutritional value, and health benefits. It is a rich source of sugar as well as organic acids, proteins, vitamins, enzymes, and biologically active compounds. The quality of honey is determined by its botanical and geographical origin. It is considered to be a pure product. The addition or removal of any other substance in honey is prohibited. Honey is expensive and thus subject to adulteration by cheaper sweeteners such as sugar, inverted beet syrup, maltose syrup, and high fructose corn syrup (HFCS). HFCS is a very common adulterant of honey because of its low price and similar chemical composition. Several techniques have been applied to detect and quantify HFCS in honey but they are time-consuming, expensive, destructive, and require the use of skilled labor, making them ill-suited for large-scale analysis. The feasibility of using NIR spectroscopy as a method for determining HFCS adulteration in honey was examined. Thirty-three pure multi-floral samples of honey were procured for the study. A mixture was prepared using all thirty-three pure samples to ensure homogeneity. Adulterated samples were prepared in duplicate at the following ratios: 10%, 20%, 30%, 40%, 50%, 60%, 70%, 80%, and 90% by weight. Both pure honey and pure HFCS were set aside for analysis as well. For model validation, five samples were prepared that were individual samples from the thirty-three samples and not part of the homogenized mixture at the following adulterant ratios: 0%, 5%, 15%, 25%, and 45%, all ratios that were not used for the training set with the exception of 0%. NIR spectra were collected from 400 nm to 2500 nm at 0.5 nm intervals. All samples were scanned twice and the two spectra were averaged into a single spectrum for each sample. The NIR spectra were smoothed before chemometric analysis. Linear Discriminant Analysis (LDA) was applied to create a classification model for separating pure honey and adulterated samples. A Partial Least Squares (PLS) regression model was created from the NIR spectra and reference values for % HFCS adulterant. Both models and the NIR spectra of the five samples created for the validation set were used to confirm the validity of the models.
| LDA | Correct Classification 100% |
| PLS | R² = 0.999 | RMSEP= 3.05% |
| Validation Set Predictions | Real Predicted |
| 0% | 0.69% |
| 5% | 5.27% |
| 15% | 14.85% |
| 25% | 24.31% |
| 45% | 42.63% |
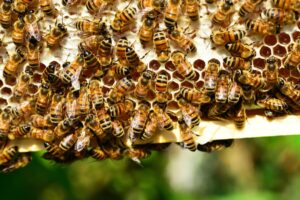 The results of this study were excellent and proved the feasibility of using NIR spectroscopy as a method for detecting and quantifying HFCS adulterant in honey. 100% correct classification was achieved using LDA. The PLS regression model showed high correlation and the RMSEP was slightly above 3%. Independent predictions all showed an error of less than 0.5% for samples at 15% adulterant or less and less than 1% error for the 25% adulterant. The prediction error was higher for the 45% adulterant but from a practical view, such a high adulteration level detection with more error would not be an issue in a real setting. The potential exists to replace traditional expensive and time-consuming methods for detecting honey adulteration with NIR spectroscopy. Future work could include adding more types of honey and adulterants to the model to increase the scope and robustness of this method.
https://www.sciencedirect.com/science/article/pii/S0039914018305976
The post Honey Adulterant Analysis appeared first on NIR-For-Food.
]]>The post Flour Adulterant Analysis appeared first on NIR-For-Food.
]]>The post Flour Adulterant Analysis appeared first on NIR-For-Food.
]]>The post Seafood Adulterant Analysis appeared first on NIR-For-Food.
]]>Introduction
Fish and seafood are considered valuable food products in the worldwide market. The specificity of different products in different regions of the world creates a large import market. Crabmeat is one especially valuable seafood product and the processing of it removes characteristics that can help in visual determination of a specific species. Varieties vary in market value and adding cheaper crab meat to a more expensive variety constitutes adulteration. In general, fresh caught fish have a higher nutritional value than farm bred fish, making fresh varieties more valuable. There are strict regulations for origin of seafood and misrepresentation of origin is a form of adulteration. Repeated frozen-thawed cycles of imported fish will reduce the nutritional value but this cannot be visually detected. There is a need for fast, non-invasive testing of seafood products for fraud and adulteration. NIR spectroscopy has been examined for this purpose and the results of some studies are documented below.
Analytes
Products:
- Crabmeat
- Sea Bass
- Tilapia
Adulterants:
- Origin
- Fresh Caught vs. Farm Bred
- Frozen-Thawed Cycles
Scientific References and Statistics
Detection and Quantification of Species Authenticity and Adulteration in Crabmeat Using Visible and Near-Infrared Spectroscopy – Gayo, Hale – Journal of Agricultural and Food Chemistry, 2007, 55, 585-592
Crabmeat is an especially expensive variety of meat and seafood, making it a prime target for adulteration. Processing of crab meat often removes morphological properties that allow the consumer to distinguish one variety from the other. A need exists for a fast, non-invasive methods to authenticate crab meat and NIR spectroscopy was examined for this purpose. Two different species (Atlantic Blue and Blue Swimmer) of crabmeat were used in the study. Atlantic Blue was the authentic species and Blue Swimmer was the adulterant due to its year-round availability, reduced cost, and import status. One hundred and ten samples of both the two pure species and mixtures ranging from 10% to 90% Blue Swimmer were homogenized using a blender. Ten absorbance spectra of each set were collected from 400 nm to 2498 nm at 2 nm intervals with an average of thirty-two scans per spectrum. Various pretreatment methods were performed on the collected spectra.
| Adulteration Content | R² = 0.988 |
The one hundred and ten samples were split evenly into a calibration and validation set. Classification analysis was performed and the data plot showed a clear pattern as the amount of adulteration increased in the samples. Quantitative analysis using a calibration model for measuring the percent adulterant was able to accurate predict the test set within 6% error. The results prove the ability to use NIR spectra and a calibration model to determine adulteration in crabmeat.
https://pubs.acs.org/doi/abs/10.1021/jf061801%2B
Use of Near-Infrared Spectroscopy for Fast Fraud Detection in Seafood: Application to the Authentication of Wild European Sea Bass – Ottavian, Facco, Fasolato, et al., Journal of Agricultural and Food Chemistry, 2012, 60, 639-648
Origin of seafood is strictly regulated by laws in the European Union. Mandatory information is required for species membership, geographic origin, and whether the product is farm or wild. It is understood that fresh caught fish will have higher nutritional value than farm bred fish and while there are different characteristics that indicate this to be the case, it is accepted that there is a marked difference in fatty acid (FA) content. Analyzing FA profiles is one way to determine the difference between fresh caught and farm bred fish, but such tests are expensive, time-consuming, and ill-suited for large scale QA tests. NIR spectroscopy was examined as a method for authentication wild European sea bass. Farmed and wild sea bass were collected from different distribution centers and different cities. A total of thirty-eight calibration samples with a determined (proven to be 100% accurate) attribution of production method and sixty-six validation samples with declared (not proven) methods of production (thirty-two declared wild and thirty-four declared farmed). Thirty-five chemical properties and morphometric traits were measured for each sample. NIR absorbance spectra were collected in reflectance mode from 1100 nm to 2500 nm. Thirty-two scans were collected per spectrum and averaged.
| Fat | R² = 0.98 |
| Moisture | R² = 0.99 |
| δ13C | R² = 0.67 |
Three different chemometric techniques were used to process the spectral data. Two used pure discrimination analysis and the third used a regression model based on the fat, moisture, and δ13C and subsequent discrimination analysis. All three methods showed comparable results to the chemical analysis techniques currently used to discriminate between wild and farmed sea bass. The validity of the analysis was confirmed by the statistics for the chemometric analysis, which showed that the most predictive spectral regions for classification were related to wavelength absorbing areas for fat, fatty acids, and water content.
https://pubs.acs.org/doi/abs/10.1021/jf203385e
Detection of Frozen-Thawed Cycles for Frozen Tilapia (Oreochromis) Fillets Using Near Infrared Spectroscopy – Wang, Chen, Tian, Liu, Journal of Aquatic Food Product Technology, 2018, Vol. 27, No. 5, 609-618
Repeated frozen-thawed cycles during the transport of frozen fish will result in quality changes that cannot be visually detected. Detection of reduced nutritional value from multiple frozen-thawed cycles requires expensive and time-consuming analysis of various quality parameters. NIR spectroscopy was examined as a method for detecting multiple frozen-thawed cycles in tilapia fillers. Sixty fillets from thirty tilapia fish were frozen at -18°C for twelve hours and thawed at 4°C for another twelve hours. This process is known as a frozen-thawed cycle. Fillets were then divided into six equal groups and each group went through the cycle again ranging from two to seven times. Tests were done for thawing loss, cooking loss, moisture, total volatile basic nitrogen (TVB-N), and texture analysis. NIR reflectance spectra were collected from 10000 cm-1 to 4000 cm-1 with 4 cm-1 resolution and thirty-two averaged scans per spectrum. Three spectra were collected for each sample and averaged into one spectrum. This process was done for both the dorsal and belly portion of each fillet. Every sample was scanned in this way for both the frozen and thawed state for all frozen-thawed cycles from one to seven.
 As expected, the reference testing showed moisture loss, protein degradation, and destruction of texture after the samples went through repeated frozen-thawed cycles. Visual examination of the spectral data of the reflectance spectra shows a clear distinction between the once frozen-thawed samples and those that went through the cycle multiple times. Various pretreatments were applied to the data and four separate qualitative models using Mahalanobis distance discrimination analysis for Thawed Dorsal (TD), Thawed Belly (TB), Frozen Dorsal (FD), and Frozen Belly (FB) were created. Validation set spectra for the FD samples showed the best results with the ability to detect repeated frozen-thawed cycle samples with an accuracy of 93.33%, proving the feasibility of using NIR spectra to classify single and multiple frozen-thawed cycle samples of tilapia fillets.
https://www.tandfonline.com/doi/abs/10.1080/10498850.2018.1461156?journalCode=wafp20
The post Seafood Adulterant Analysis appeared first on NIR-For-Food.
]]>The post Edible Oils Adulterant Analysis appeared first on NIR-For-Food.
]]>Introduction
Edible oils present an appealing target for adulteration because of their value, especially in the case of extra virgin olive oil (EVOO). Standards are strict for EVOO and market price is much more expensive than that of lower-grade olive oil. In 2015, seven of Italy’s largest olive oil producers were under investigation for selling virgin olive oil as the higher quality EVOO. One study tested twenty shelf brands of EVOO and nine of them did not meet standards. Adulteration methods can include adding a lower grade olive oil or a cheaper type of oil. Standards include proper representation of provenance of origin and misrepresentation constitutes adulteration as well. Visual inspection is usually insufficient for determining edible oil adulteration and more advanced methods are often expensive, time-consuming, and unsuitable for implementing large-scale quality control testing. NIR spectroscopy has been examined for determining the presence of adulterants in edible oils and the results of some studies are presented below.Analytes
Olive Oil
Products:- Extra Virgin Olive Oil
- Soybean
- Sunflower
- Corn
- Canola
- Hazelnut
- High Oleic Acid Safflower
- Peanut
- Palm Olein
- Refined Olive Oil
Adulteration by Misrepresentation of Provenance of Origin
Soybean and Palm Oil
Products:- Soybean Oil
- Palm Oil
- Transgenic vs. Non-Transgenic
- Lard
Scientific References and Statistics
Olive Oil
Novel, Rapid Identification, and Quantification of Adulterants in Extra Virgin Olive Oil Using Near-Infrared Spectroscopy and Chemometrics – Azizian, Mossoba, Fardin-Kia, et al., Lipids 2015 50:705-718 Three studies were conducted from 2015 to 2017 at the Food and Drug Administration, Center of Food Safety and Applied Nutrition to assess determining the authenticity of extra virgin olive oil (EVOO) using FT-NIR spectroscopy. Detecting adulteration of EVOO is an ongoing and always evolving concern for regulatory agencies. There are numerous established standards all over the world that grade olive oil by specifying chemical composition and quality parameters. Standards are continually upgraded and they also specify methods of analysis for assessing quality. Many of these standard methods are expensive, labor-intensive, time-consuming, and often require more than one method to achieve the desired results. Vibrational spectroscopy offers a fast and non-destructive alternative to these methods and this study evaluated using FT-NIR spectroscopy to rapidly authenticate EVOO, identify the nature of an adulterant in commercial products, and determine the concentration of the adulterant. A newly created FT-NIR index based on the relative intensities of two unique carbonyl overtones in EVOO spectra was proposed as a potential screening tool for the authenticity of EVOO. The absorption spectrum of EVOO shows two broad bands near 5280 cm-1 (attributed to volatiles) and 5180 cm-1 (attributed to non-volatiles).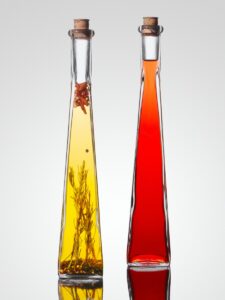 The following samples were acquired for the study: reference EVOO and refined olive oil from Sigma-Aldrich, several authentic EVOO samples from California, commercially available EVOO from Italy, various refined vegetable oils from local grocery stores, and two palm olein samples from Indonesia and Thailand. NIR spectra were collected using different FT-NIR spectrometers from the same vendor using a diffuse reflectance probe with a liquid attachment and a 2 mm pathlength. All spectra were collected at 8 cm-1 resolution and six replicate spectra were collected for each sample and averaged into one spectrum. Before calibration work, tests were conducted to assess the effects of external changes on the aforementioned absorption bands. The same EVOO sample was measured for over an hour at room temperature and it was noted that the absorption band at 5280 cm-1 decreased while the other band was unchanged. To confirm this change was because of temperature, an EVOO sample was heated at 50°C for ten minutes and spectra were acquired over the ten minute span. Next, two tests were run to see if the decrease in absorption was due to the loss in volatile compounds. A vacuum at 260 mBar was applied to an EVOO sample for 50 minutes and rescanned, showing a significant decrease in the 5280 cm-1 band. Likewise, bubbling nitrogen gas was passed through an EVOO sample for fifty minutes and after rescanning, a similar result was observed. A decrease in the 5280 cm-1 band was also observed after scanning spiked samples of EVOO with fully refined olive oil, corn oil, vegetable oil, and palm olein. The band at 5180 cm-1 showed little or no change with heat, vacuuming, bubbling with nitrogen gas, or the addition of other oils. The last test added 10 µL of water to an EVOO sample to ensure that changes in the two bands were not occurring because of changes in moisture. After scanning the sample, no spectral change was observed in the two bands of interest after the water added.
After the external tests were conducted, chemometric software was used to choose wavenumber ranges that included the characteristic features of the two bands of interest. In order to eliminate the need to measure and integrate the area of the two absorption bands, a Partial Least Squares (PLS) calibration model was created. For all samples, the normalized ratio of the two integrated band areas was calculated. The sample with the highest value (about 1.7 to 1) was arbitrarily assigned a value of 100 for FT-NIR index. California EVOO samples ranged from 100 to 92 on the scale. The certified EVOO sample from Sigma Aldrich was 90 while the refined olive oil was 40. Commercial EVOO from Italy ranged from 86 to 97. To expand the scale and more accurately estimate the lower end, a synthetic triolein was scanned and a very low FT-NIR index score of 5 was determined.
The second portion of this study used prepared gravimetric mixtures of authentic EVOO spiked with nine common adulterants. The adulterants used are: soybean oil, sunflower oil, corn oil, canola oil, hazelnut oil, high oleic acid safflower oil, peanut oil, palm olein, and refined olive oil. The first eight listed here were mixed in concentrations from 3% to 30% by weight adulterant and in the case of refined olive oil, up to 60% total weight was used. Initial analysis indicated that one universal PLS model for all adulterants was not feasible. However, the fatty acid profiles for all adulterants was examined and it was determined that spitting the adulterants into four groups based on fatty acid profiles might show better results. This was the case after creating four PLS models from the four groups. Shown below are the results for the FT-NIR index and four adulterant PLS models.
The following samples were acquired for the study: reference EVOO and refined olive oil from Sigma-Aldrich, several authentic EVOO samples from California, commercially available EVOO from Italy, various refined vegetable oils from local grocery stores, and two palm olein samples from Indonesia and Thailand. NIR spectra were collected using different FT-NIR spectrometers from the same vendor using a diffuse reflectance probe with a liquid attachment and a 2 mm pathlength. All spectra were collected at 8 cm-1 resolution and six replicate spectra were collected for each sample and averaged into one spectrum. Before calibration work, tests were conducted to assess the effects of external changes on the aforementioned absorption bands. The same EVOO sample was measured for over an hour at room temperature and it was noted that the absorption band at 5280 cm-1 decreased while the other band was unchanged. To confirm this change was because of temperature, an EVOO sample was heated at 50°C for ten minutes and spectra were acquired over the ten minute span. Next, two tests were run to see if the decrease in absorption was due to the loss in volatile compounds. A vacuum at 260 mBar was applied to an EVOO sample for 50 minutes and rescanned, showing a significant decrease in the 5280 cm-1 band. Likewise, bubbling nitrogen gas was passed through an EVOO sample for fifty minutes and after rescanning, a similar result was observed. A decrease in the 5280 cm-1 band was also observed after scanning spiked samples of EVOO with fully refined olive oil, corn oil, vegetable oil, and palm olein. The band at 5180 cm-1 showed little or no change with heat, vacuuming, bubbling with nitrogen gas, or the addition of other oils. The last test added 10 µL of water to an EVOO sample to ensure that changes in the two bands were not occurring because of changes in moisture. After scanning the sample, no spectral change was observed in the two bands of interest after the water added.
After the external tests were conducted, chemometric software was used to choose wavenumber ranges that included the characteristic features of the two bands of interest. In order to eliminate the need to measure and integrate the area of the two absorption bands, a Partial Least Squares (PLS) calibration model was created. For all samples, the normalized ratio of the two integrated band areas was calculated. The sample with the highest value (about 1.7 to 1) was arbitrarily assigned a value of 100 for FT-NIR index. California EVOO samples ranged from 100 to 92 on the scale. The certified EVOO sample from Sigma Aldrich was 90 while the refined olive oil was 40. Commercial EVOO from Italy ranged from 86 to 97. To expand the scale and more accurately estimate the lower end, a synthetic triolein was scanned and a very low FT-NIR index score of 5 was determined.
The second portion of this study used prepared gravimetric mixtures of authentic EVOO spiked with nine common adulterants. The adulterants used are: soybean oil, sunflower oil, corn oil, canola oil, hazelnut oil, high oleic acid safflower oil, peanut oil, palm olein, and refined olive oil. The first eight listed here were mixed in concentrations from 3% to 30% by weight adulterant and in the case of refined olive oil, up to 60% total weight was used. Initial analysis indicated that one universal PLS model for all adulterants was not feasible. However, the fatty acid profiles for all adulterants was examined and it was determined that spitting the adulterants into four groups based on fatty acid profiles might show better results. This was the case after creating four PLS models from the four groups. Shown below are the results for the FT-NIR index and four adulterant PLS models.
| FT-NIR Index | R² = 0.995 | RMSEP= 1.7 |
Group 1 Adulterants
Soybean, Sunflower, Corn, Canola (High Linoleic Acid)| R² = 0.999 | RMSEP= 0.9% w/w |
Group 2 Adulterants
Hazelnut, High Oleic Acid Safflower Oil, Peanut Oil (High Oleic Acid)| R² = 0.995 | RMSEP= 2.2% w/w |
Group 3 Adulterant
Palm Olein| R² = 0.999 | RMSEP= 1.0% w/w |
Group 4 Adulterant
Refined Olive Oil| R² = 0.976 | RMSEP= 3.7% w/w |
Origin Prediction Results:
| Ligurian Samples | 92.5% |
| Non-Ligurian Samples | 81.5% |
Vegetable & Other Edible Oils
 Rapid Characterization of Transgenic and Non-Transgenic Soybean Oils by Chemometric Methods Using NIR Spectroscopy – Luna, da Silva, Pinho, et al., Spectrochimica Acta Part A 100 (2013) 115-119
Genetic engineering of food has become advanced in recent years but in many parts of the world such food is considered undesirable, creating the need for rapid screening methods for proper labeling. Forty transgenic and forty non-transgenic soybean oil retail samples were procured for the study. Transmission spectra were collected from 1100 nm to 2500 nm at 1 nm intervals. Five spectra were collected per sample and averaged into one spectrum. Various post-processing algorithms were applied to the spectra and classification methods were performed to determine the best method for separating the two types of samples. The best results were obtained using Support Vector Machine-Discriminant Analysis (SVM-DA), a technique used for binary classification. This technique corrected predicted 100% of the non-transgenic samples and 90% of the transgenic samples in the validation set. Since there were no reference tests conducted on the samples and the classification was based strictly on what the retail label displayed, it is possible that some of the samples were misclassified to start. However, the results shown in this study are good enough for screening purposes to classify transgenic and non-transgenic soybean oils.
https://www.ncbi.nlm.nih.gov/pubmed/16131099
Classification and Quantification of Palm Oil Adulteration Via Portable NIR Spectroscopy – Basri, Hussain, Bakar, et al., Spectrochimica Acta Part A: Molecular and Biomolecular Spectroscopy 173 (2017) 335-342
Lard can produce cheap oil and can be mixed with other vegetable oils as an adulterant. A NIR spectrometer was set up to operate in both transmission and transflectance mode for comparative purposes. Samples were prepared of pure palm oil, pure lard, and mixtures at various increments of added lard from 0.5% to 50%. Absorbance spectra of all samples were collected in both modes from 950 nm to 1650 nm and exported for chemometric analysis. Classification analysis was performed on pure vs. adulterated palm oil and Partial Least Squares (PLS) regression models for quantifying lard in palm oil was created from both sets of NIR spectra.
Rapid Characterization of Transgenic and Non-Transgenic Soybean Oils by Chemometric Methods Using NIR Spectroscopy – Luna, da Silva, Pinho, et al., Spectrochimica Acta Part A 100 (2013) 115-119
Genetic engineering of food has become advanced in recent years but in many parts of the world such food is considered undesirable, creating the need for rapid screening methods for proper labeling. Forty transgenic and forty non-transgenic soybean oil retail samples were procured for the study. Transmission spectra were collected from 1100 nm to 2500 nm at 1 nm intervals. Five spectra were collected per sample and averaged into one spectrum. Various post-processing algorithms were applied to the spectra and classification methods were performed to determine the best method for separating the two types of samples. The best results were obtained using Support Vector Machine-Discriminant Analysis (SVM-DA), a technique used for binary classification. This technique corrected predicted 100% of the non-transgenic samples and 90% of the transgenic samples in the validation set. Since there were no reference tests conducted on the samples and the classification was based strictly on what the retail label displayed, it is possible that some of the samples were misclassified to start. However, the results shown in this study are good enough for screening purposes to classify transgenic and non-transgenic soybean oils.
https://www.ncbi.nlm.nih.gov/pubmed/16131099
Classification and Quantification of Palm Oil Adulteration Via Portable NIR Spectroscopy – Basri, Hussain, Bakar, et al., Spectrochimica Acta Part A: Molecular and Biomolecular Spectroscopy 173 (2017) 335-342
Lard can produce cheap oil and can be mixed with other vegetable oils as an adulterant. A NIR spectrometer was set up to operate in both transmission and transflectance mode for comparative purposes. Samples were prepared of pure palm oil, pure lard, and mixtures at various increments of added lard from 0.5% to 50%. Absorbance spectra of all samples were collected in both modes from 950 nm to 1650 nm and exported for chemometric analysis. Classification analysis was performed on pure vs. adulterated palm oil and Partial Least Squares (PLS) regression models for quantifying lard in palm oil was created from both sets of NIR spectra.
Transmission:
| Classification Accuracy | 0.95 |
| Lard PLS | R² = 0.9998 |
Transflectance:
| Classification Accuracy | 0.93 |
| Lard PLS | R² = 0.9996 |
The post Edible Oils Adulterant Analysis appeared first on NIR-For-Food.
]]>The post Dairy Adulterant Analysis appeared first on NIR-For-Food.
]]>Introduction
Dairy products have been the target of some high-profile incidents of adulteration, resulting in sickness and deaths by the addition of melamine to milk and infant formula. Melamine detection is difficult because it mimics high protein content in routine quality tests. While it can be detected by more advanced tests, those tests are expensive and difficult to implement on a large scale. Other adulterants of milk include non-fat solids and inorganic salts in milk powder as well as representation of a lower quality milk as a higher quality product. Some cheeses are strictly regulated by manufacturing standards and designation. Products that do not meet standards are considered to be adulterated. Butter and yogurt can also be targets for adulteration, often by impurities containing fat and protein that can cheat routine quality tests. There is a need for fast, non-invasive testing for adulteration of dairy products that can replace current methods. NIR spectroscopy has been examined for this purpose and the results of some studies are summarized below.
Analytes
Products:
- Milk
- Milk Powder
- Cheese
- Butter
- Yogurt
Adulterants:
- Melamine
- Cow Milk in Camel Milk
- Dicyandiamide
- Aminotriazole
- Biuret
- Soy Protein Isolate
- Pea Protein Isolate
- Calcium Carbonate
- Maltodextrin, Sucrose
- Authentic Origin Designation
- Tallow
- Edible Gelatin
- Industrial Gelatin
- Soy Protein
Scientific References and Statistics
Milk
 Melamine Detection by Mid- and Near-Infrared (MIR/NIR) Spectroscopy: A Quick and Sensitive Method for Dairy Products Analysis Including Liquid Milk, Infant Formula, and Milk Powder – Balabin, Smirnov, Talanta 85 (2011) 562-568
Melamine (2,4,6-triamino-1,3,5-triazine) is a nitrogen-rich chemical most frequently used in making plastics. In routine quality tests like the Kjeldahl and Dumas methods, the high nitrogen content increases the apparent protein content, making it a chemical that can be used for food adulteration mimicking high protein content. Melamine contamination has been reported in liquid and powdered milk, infant formula, frozen yogurt, pet food, biscuits, candy, and coffee drinks. Two high profile incidents resulted in recalls of pet and human food in 2007 and infant formula in 2008, creating a widespread global food safety scare. Ingestion of melamine may lead to reproductive damage, bladder or kidney stones, and bladder cancer. The current FDA method for detecting melamine in infant formula is liquid chromatography-triple-quadrupole tandem mass spectroscopy (LC-MS/MS). While effective with a limit of detection as low as 0.25 ppm, it requires extensive sample preparation and cleanup, skilled labor, and is time-consuming and expensive, making it ill-suited for testing large numbers of samples. Vibrational spectroscopy offers a cost-effective and fast alternative to current methods and both NIR and Mid-IR spectroscopy were examined for detecting melamine adulteration in infant formula, milk powder, and liquid milk.
The initial sample set consisted of sixty infant formula samples and seventy-two each of milk powder and liquid milk. All samples were first checked for the absence of melamine using HPLC. After verifying the samples to be absent of contamination, they were mixed in random proportions to create six hundred ninety infant formula samples and six hundred sixty milk powder and liquid milk samples. Four separate melamine brands from three different producers were used as the adulterant. The range of melamine concentration was set to be very low (0.11 ppm) to very high (2000 ppm). Between one gram to five grams were prepared for each sample and all samples were homogenized before spectra collection. Samples were scanned right after preparation to minimize experimental errors. NIR spectra were collected from 9000 cm-1 to 4500 cm-1 using 8 cm-1 resolution. Sixty-four scans were collected per reading and averaged into one spectrum. An 8 mm in diameter cylindrical glass cell was used and five spectra were collected per sample, rotating the cell between each collection. These five spectra were then averaged into a single spectrum per sample. Mid-IR spectra were collected from 4000 cm-1 to 500 cm-1 using 2 cm-1 resolution. Thirty-two scans were averaged per spectrum and an ATR background was used. This collection process was repeated between five to seven times for each sample and all spectra from each sample were averaged into a single spectrum per sample. Before calibration modeling, nine different preprocessing methods were applied to both sets of spectra. Fairly poor results were obtained using Partial Least Squares (PLS) and Orthogonal Projections to Latent Structures (OPLS), indicating the possibility that a non-linear relationship existed between both sets of spectra and melamine concentration. The non-linear regression methods Polynomial-PLS (Poly-PLS), Artificial Neural Network (ANN), Support Vector Regression (SVR), and Least Squares Support Vector Machine (LS-SVM) were analyzed. In order to keep the model unbiased towards the accurate prediction of samples with high melamine content, the data sets were split into a low set and high set. The low data set used samples with a melamine concentration of 17.3 ppm or lower and the high set used samples with a melamine concentration of 17.3 ppm to the highest concentration of 2000 ppm. The results listed below are averaged results for both NIR and Mid-IR.
Low Melamine Concentration (Infant Formula, Milk Powder, Liquid Milk):
| Average Error (PLS & OPLS) | RMSEP = 1.31 +/- 0.07 ppm |
| Average Error (Poly-PLS, ANN, LS-SVM, SVR) | RMSEP = 0.28 +/- 0.05 ppm |
High Melamine Concentration (Infant Formula, Milk Powder, Liquid Milk):
| Average Error (PLS, OPLS, Poly-PLS) | RMSEP = 15.0 +/- 6.0 ppm (Estimated) |
| Average Error (ANN, LS-SVM, SVR) | RMSEP = 6.1 +/- 0.9 ppm |
The desired detection threshold for melamine adulteration is 1.0 ppm or less for lower concentrations. Analysis of the non-linear calibration models showed that the threshold of detection was 0.76 +/- 0.11 ppm, making both NIR and Mid-IR acceptable methods in practice for determining melamine concentration in all three types of milk products. In the case of the high melamine concentration, prediction error was much higher for Mid-IR than NIR. The results of both sets of models were verified by an independent validation set chosen from the samples. Overall, statistics from the calibration models showed an ability to measure infant formula, milk powder, and liquid milk with equal efficiency. The results here appear good enough to use NIR spectroscopy as a screening tool to detect adulterated samples that can be passed on for more advanced tests if melamine is detected. However, these models would require more validation before being used in a real setting. NIR spectroscopy rarely has a threshold of sensitivity low enough to measure parameters at a ppm level, even in the case of water which is known to be a very strong absorber in the NIR. It is possible that the change in melamine is colinear with other changes in the dairy product, thus creating an indirect correlation in the calibration models. However, while an indirect correlation is acceptable in NIR spectroscopy, such models require careful validation and the wavelength ranges used for the correlation must be carefully examined. Such analysis was not presented in this study. With such low concentrations and a non-linear relationship between NIR spectra and melamine concentration, careful calibration work must be done to use NIR spectroscopy for melamine detection in other products. The potential was demonstrated in this study to use NIR spectroscopy and calibration models to measure melamine adulteration in milk products but more careful examination of the results is required. If properly validated, NIR spectroscopy offers a much quicker and less expensive alternative to traditional reference methods for monitoring melamine adulteration.
https://www.sciencedirect.com/science/article/pii/S0039914011003407
Detection of Melamine Adulteration in Milk by Near-Infrared Spectroscopy and One-Class Partial Least Squares – Chen, Tan, Lin, Wu, Spectroschimica Acta Part A: Molecular and Biomolecular Spectroscopy 173 (2017) 832-836
Melamine is a nitrogen containing compound that has been implicated in global food scares involving milk products. It contains 66.7% nitrogen by mass and is used as an adulterant to increase the apparent protein content. The traditional Kjeldahl test for protein does not measure protein directly but determines protein from the nitrogen content without considering the source. High doses of melamine in dairy products can result in kidney stones, renal failure, and has resulted in deaths of babies after consuming melamine-adulterated infant formula. The publicity from incidents of adulterated dairy products has resulted in the development of a number of testing methods. However, these tests are often expensive, time-consuming, require skilled labor and the use of toxic solvents, and are ill-suited to use as a large-scale quality assurance tool. An ideal analytical method to verify the quality and authenticity of food products requires speed with little sample preparation and low cost. NIR spectroscopy was examined as a method for determining melamine adulteration in milk. Milk powder was procured from a local supermarket for the study and was confirmed to be free of melamine. Sixty-two 100 ml samples of milk liquor were prepared over two days with a week interval in between. Forty-two of these samples were set aside as pure samples and the remaining twenty-two were prepared as adulterated samples. 99% pure melamine was procured from a vendor and different concentrations of melamine were dissolved in the remaining twenty samples of milk liquor. Melamine concentration ranged from 0.001 g/100 ml to 0.29 g/100 ml, which is the upper limit of solubility of melamine in water. NIR spectra were collected using an FT-NIR spectrometer from 10000 cm-1 to 4000 cm-1 at 3.856 cm-1 intervals. Thirty-two scans were collected per reading and averaged into one spectrum. One spectrum was collected for each pure milk sample. Three spectra were collected for each adulterated sample, making a total of one hundred two NIR spectra. A One-Class Partial Least Squares (OC-PLS) classification model was created by assigning a value of 0 to all pure milk spectra and 1 to all adulterated samples. A Variable Importance (VI) index was used to select the forty most important input variables for the classification. Samples were split into a training set to create the model and a test set for model validation.
OC-PLS
| Accuracy 89% | Sensitivity 90% | Specificity 88% |
The results shown above were determined from predictions using the test set spectra and prove the feasibility of using NIR spectroscopy and a classification model as a screening tool to determine the presence of melamine adulterant in milk. Future work should include more types of milk and different concentrations of melamine in order to increase the robustness of the model. Implementing NIR spectroscopy as a method for detecting melamine adulteration offers a less expensive and time-consuming alternative to current methods and can be used as a screening tool to find adulterated samples that can be sent for more advanced testing if melamine is detected.
https://www.sciencedirect.com/science/article/pii/S1386142516306473
FT-NIRS Coupled With Chemometric Methods As A Rapid Alternative Tool for the Detection & Quantification of Cow Milk Adulteration in Camel Milk Samples – Mabood, Jabeen, Hussain, et al., Vibrational Spectroscopy 92 (2017) 245-250
Camel milk is considered to have high nutritional value in comparison to milk produced by cows. It is a rich source of Vitamin A and C, has a high content of potent immunoglobins, and does not contain lactoglobulin and A1 casein, making it suitable for consumption by people with bovine dairy allergies. Thus, it sells for a higher market price and is subject to adulteration using cheaper forms of milk. FT-NIR spectroscopy was examined as a method for determining cow milk adulteration in samples of camel milk. Three samples of camel milk were procured for the study and prepared in triplicate form. Each separate camel milk sample was adulterated with different percent levels of cow milk adulterant: 2%, 5%, 10%, 15%, and 20%. Including the three pure samples, a total of fifty-four samples were created. 70% of the samples were used as a calibration set to create the model and the remaining 30% was used as a validation set. All samples were scanned from 700 nm to 2500 nm at 2 cm-1 spectral resolution using a 0.2 mm pathlength sealed cell. Two calibration models were created: Partial Least Squares Discriminant Analysis (PLS-DA) to determine the presence of the cow milk adulterant and Partial Least Squares (PLS) to quantify the amount of adulterant present.
PLS-DA
| Presence of Adulterant | R² = 0.973 | RMSEP= 0.0801 |
PLS
| Amount of Adulterant | R² = 0.926 | RMSEP= 1.32% |
Both calibration models showed good results and proved the feasibility of the measurement. In the case of PLS-DA, an arbitrary value of 0 was assigned to the pure camel milk samples and 1 to samples spiked with 10% cow milk adulterant. The model predicts a number and a threshold of 0.5 was chosen to determine the presence of adulterant. A predicted value less than 0.5 indicates no adulterant and a predicted value greater than 0.5 indicates an adulterant is present in the sample. The high correlation and low RMSEP show that this model can be used to determine the presence of cow milk adulterant in camel milk. In the case of PLS, the results show that the model can predict the amount of adulterant present within an accuracy of 1.32%. It must be noted that while the models showed good results, using them in a practical setting for different kinds of milk and adulterants would require a much larger sample set. Natural products often show variability in NIR spectra due to many factors, such as region of origin, different types of food fed to animals, different soil for plant growing, and so forth. Incorporating different samples encompassing any potential variability is important when building calibration models. Predictions performed on the validation set proved that the models could work in a real-time setting, using the PLS-DA model as a detection tool and the PLS model as a quantification tool, providing information that would be very difficult to find using conventional methods for adulteration detection.
https://www.sciencedirect.com/science/article/abs/pii/S0924203117300668
Non-Targeted NIR Spectroscopy and SIMCA Classification for Commercial Milk Powder Authentication: A Study Using Eleven Potential Adulterants – Karunathilaka, Yakes, He, et al., Heliyon 4 (2018) e00806.
NIR spectroscopy was evaluated as a method for rapid screening of commercial milk powder products as authentic or being mixed with known and unknown adulterants. Milk powder is a known target of adulteration, ranking only second to olive oil according to the USP database on food fraud and economic adulteration. Milk powder adulteration can cause adverse health effects, as highlighted by two incidents of milk and wheat gluten adulteration with melamine. One incident was linked to renal failure in cats and dogs due to pet food adulteration in the United States. The other was linked to infant formula in China, causing thousands of cases of renal complications in children as well as at least six confirmed deaths. A number of commercially available milk powder samples were procured for the study, representing manufactured products in sixteen different states and twenty-four different companies and brands. Eleven different milk powder adulterants were selected for the study based on their history or potential use as adulterants. These can be divided into four categories: 1. Low Molecular Weight, Nitrogen-Rich Compounds, 2. Plant Proteins, 3. Inorganic Salts, 4. Non-Fat Solids. Some of the adulterants were blended as well to increase the scope of the potential adulterants that could be used. Different levels of all adulterants were mixed with the pure milk powder samples before NIR spectra were collected. Three different spectrometers were used for the study: Two benchtop FT-NIR instruments and a handheld NIR device. Principle Component Analysis (PCA) was performed on all three sets of data and SIMCA classification models were created for determining the presence of an adulterant in the milk powder. After model creation, separate test sets of both pure and adulterated samples were scanned for model validation.
FT-NIR Spectrometer #1
Instrument Parameters:
12500 cm-1 to 4000 cm-1, sixty-four scans per average, 16 cm-1 spectral resolution
100% Correct Adulterant Classification and Concentration (%w):
| Melamine | 0.6% to 2.0% |
| Dicyandiamide | 2% |
| Aminotriazole | 0.4% to 2.0% |
| Biuret | 0.2% to 2.0% |
| Soy Protein Isolate | 5% to 20% |
| Pea Protein Isolate | 5% to 20% |
| Calcium Carbonate | 2% |
| Maltodextrin | 2% to 20% |
| Sucrose | 7% to 50% |
FT-NIR Spectrometer #2
Instrument Parameters:
10000 cm-1 to 4000 cm-1, thirty-two scans per average, 16 cm-1 spectral resolution
100% Correct Adulterant Classification and Concentration (%w):
| Melamine | 0.4% to 2.0% |
| Aminotriazole | 0.4% to 2.0% |
| Biuret | 0.2% to 2.0% |
| Cyanuric Acid | 2% |
| Soy Protein Isolate | 5% to 20% |
| Pea Protein Isolate | 2% to 20% |
| Maltodextrin | 5% to 20% |
| Sucrose | 10% to 50% |
Handheld Spectrometer
Instrument Parameters:
6266 cm-1 to 4167 cm-1, 10 scans per average, 11 nm optical resolution
100% Correct Adulterant Classification and Concentration (%w):
| Biuret | 0.4% to 2.0% |
Results for all three spectrometers are shown above. Both FT-NIR benchtop spectrometers showed 100% specificity and accuracy for determining the presence of an adulterant in milk powder if the adulterant was at a sufficiently high percentage, which varied based on the type of adulterant present. In the case of the handheld NIR device, results were much worse. This is most likely due to a narrower wavelength range and lower resolution than the benchtop FT-NIR instruments. The results here prove the feasibility of using FT-NIR spectrometers as a tool for determining the presence of adulterant in milk powder and show that FT-NIR spectrometers are much better suited for such analysis than handheld NIR spectrometers.
https://www.heliyon.com/article/e00806/pdf
Cheese
Screening of Grated Cheese Authenticity by NIR Spectroscopy – Cevoli, Fabbri, Gori, et al., Journal of Agricultural Engineering 2013; volume XLIV(s2):e53
 Parmigiano-Reggiano (PR) cheese is one of the oldest traditional cheeses produced in Europe and has a Protected Designation of Origin in Italy. It is manufactured exclusively from whole PR wheels that correspond to the production standard. Grated PR cheese must be matured for a period of twelve months and characterized by a rind content of less than 18%. NIR spectroscopy was examined as a method for determining the authenticity of PR grated cheese. Four hundred samples were procured for the study with the following classifications: Compliance PR, Non-Compliance PR, PR with Rind Content > 18%, and Competitors (various commercial brands of grated cheeses obtained from local markets). NIR spectra were collected using an FT-NIR spectrometer in diffuse reflectance mode from 12500 cm-1 to 4000 cm-1. Thirty-two scans were averaged per spectrum and 8 cm-1 spectral resolution was used. Three replicate spectra were collected per sample. Various pre-processing treatments were performed on the NIR spectra. Principle Component Analysis (PCA) was first performed as an exploratory tool to define discrimination between Compliance and Non-Compliance PR samples or Competitors. Artificial Neural Network (ANN) models were created using software to test the feasibility of predicting each specific class from the spectral data. Reference values of Rind % and Months of Ripening were used with the NIR spectra to create Partial Least Squares (PLS) regression models for predicting these values from the spectra.
ANN:
| Compliance PR Classification | 100% for Training Set | 100% for Validation Set |
| Competitors Classification | 100% for Training Set | 95.5% for Validation Set |
| Non-Compliance PR Classification | 100% for Training Set | 100% for Validation Set |
| Rind Content > 18% Classification | 100% for Training Set | 100% for Validation Set |
PLS:
| Rind % | R² = 0.982 | RMSEP= 1.473% |
| Months of Ripening | R² = 0.986 | RMSEP= 0.805 |
The results obtained in this study for both types of models were excellent and confirmed the ability of NIR spectroscopy to be used as a screening tool for determining grated cheese authenticity. The ANN model was able to 100% predict compliance or non-compliance in PR samples and detect competitor grated cheese at an accuracy above 95%. More competitor samples in the model will likely improve these results. In the case of PLS, the results were especially good considering there was some question in the reference values for rind %. A regression model can only predict within the error of the reference method and these results should improve as well with more accurate reference testing. Ripening can be predicted to within an accuracy of less than one month. NIR spectroscopy can be used as a fast, non-destructive screening tool for determining the authenticity of grated cheese.
Butter
Robust New NIRS Coupled With Multivariate Methods for the Detection and Quantification of Tallow Adulteration in Clarified Butter Samples – Mabood, Abbas, Jabeen, et al., Food Additives & Contaminants: Part A, 35:3, 404-411
Food adulteration has become a big problem on a global scale during recent years. Increased population, higher supply and demand for food, and less detectable methods of adulteration have all contributed to the problem. Food authenticity and detection of adulteration have become a priority for both food producers and consumers, as adulteration results in reduced profits, bad publicity, and in some cases, presents a health risk to the public. Dairy products are no exception to the adulteration issue and one potential adulterant in butter is tallow, an animal fat material which causes increased serum cholesterol and triglycerides levels when consumed. Tallow is even used to make candles and soap and is obviously an unsuitable substitute for butter at any concentration. Visual examination is difficult for determining the presence of adulterants and wet chemistry methods are time-consuming and expensive. NIR spectroscopy was examined as a fast method requiring little sample preparation for determining the presence of tallow adulterant in butter. Nine portions of pure butter samples with no tallow adulteration were set aside. Tallow was prepared by melting animal fat and collecting the oil portion poured out from the solid residue. Nine samples of each of the following tallow concentrations by weight in butter were prepared: 1%, 3%, 5%, 7%, 9%, 11%, 13%, 15%, 17%, and 20%. Including the nine samples with no tallow adulteration, a total of ninety-nine samples were used for the study. NIR spectra were collected in reflectance mode from 10000 cm-1 to 4000 cm-1 using 2 cm-1 resolution. A transflectance sample accessory with a total pathlength of 0.5 mm was used for collection. Various pre-treatments were performed on the NIR spectra, after which Principle Component Analysis (PCA), Partial Least Squares-Discriminant Analysis (PLS-DA), and Partial Least Squares (PLS) chemometric methods were used to build the models.
PLS-DA
| Predict Value (0 = no tallow, 1 = presence of tallow) | R² = 0.95 | RMSEP= 0.062 |
PLS
| Tallow % | R² = 0.973 | RMSEP= 1.537% |
The results presented were excellent and proved the feasibility of using NIR spectroscopy to determine the presence of tallow adulterant in butter as well as quantitatively measure the amount of tallow with reasonable prediction error. After various pre-treatments were performed, the wavenumber range from 7500 cm-1 to 4000 cm-1 using first derivative with fifteen smoothing points was used for the calibration models. Examination of the scores plot after PCA showed clear classification and separation between each group of samples, proving that changes to the NIR spectra occur as more tallow is added to the samples. PLS-DA uses the arbitrary values of 0 and 1 for classification purposes between two groups. The model generates a number based on NIR spectra. A number less than 0.5 classifies as the group assigned to 0 and a number greater than 0.5 classifies as the group assigned to 1. In this case, the RMSEP of 0.062 is more than accurate enough to classify the sample as non-adulterated or adulterated. PLS predicts a quantitative value from NIR spectra and a calibration model. The RMSEP shows a prediction accuracy with error slightly greater than 1.5% tallow, which is accurate enough for real-time use. In order to properly validate the model, 30% of the samples were removed from the PLS model, a new model was created without those samples, and the NIR spectra of those samples were used with the new model to predict the percentage of tallow adulteration. These results proved the validity of the model and all predictions showed an error of less than 2% tallow. More samples over the range of values encompassing different types of butter will improve the results and make the model robust enough for universal application for tallow adulteration screening of butter.
https://tandfonline.com/doi/abs/10.1080/19440049.2017.1418090?journalCode=tfac20
Yogurt
The Feasibility of Using Near-Infrared Spectroscopy and Chemometrics for Untargeted Detection of Protein Adulteration in Yogurt: Removing Unwanted Variations in Pure Yogurt – Xu, Yan, Cai, et al., Journal of Analytical Methods in Chemistry, Volume 2013, Article ID 201873
 In recent years, scandals involving dairy product adulteration have led to the development of new targeted analytical methods to detect the presence of adulterants. Melamine has especially been examined as a milk adulterant but new types of adulterants are being reported all the time. One such adulterant is different types of non-milk proteins in yogurt. Because of the evolving nature of adulterants, new types of untargeted analyses are needed to determine whether or not a product is pure and unadulterated, with the focus being on not necessarily identifying the specific adulterant but rather determining the presence of one. If a product is determined to be impure, further testing can be done to identify the adulterant. NIR spectroscopy was examined as a method for protein adulteration identification in yogurt. Yogurt was manufactured from milk and bacteria cultures using the standard method specifically for the study. The yogurt was divided into nineteen portions. Three portions were kept pure with no adulterant. Six portions were adulterated with edible gelatin ranging from 1% to 8% by weight. Five portions were adulterated with industrial gelatin ranging from 0.5% to 5% by weight. Five portions were adulterated with soy protein powder ranging from 0.5% to 5% by weight. In order to keep the thickness uniform in all the samples, pure water was added which is the common practice in protein adulteration. NIR spectra of both the pure and adulterated samples were collected from 12000 cm-1 to 4000 cm-1 in diffuse reflectance mode. Spectral resolution was 8 cm-1, scanning interval was 3.857 cm-1, and sixty-four scans were collected per reading and averaged into one spectrum. In total after dividing the portions, sixty spectra of pure samples and one hundred ninety-seven spectra of adulterated samples were collected. Spectrum of pure water was collected by averaging five measurements of water film on the reflectance background. In order to remove the influence of water variation, all NIR spectra of the pure and adulterated yogurt samples were orthogonally projected (OP) on the complement space of water spectrum using an algorithm, minimizing the influence of the water difference on the classification. Standard Normal Variate (SNV) processing was used as well to reduce scattering effects and correct interference caused by variations. The groups were divided into a training set and test set and the OCPLS class modeling algorithm was used to classify samples using the following sets of NIR spectra: raw spectra, OP, and SNV.
OCPLS Classification:
| Raw Spectra Test Set | 17/20 |
| Raw Spectra Training Set | 163/197 |
| SNV Spectra Test Set | 18/20 |
| SNV Spectra Training Set | 181/197 |
| OP Spectra Test Set | 18/20 |
| OP Spectra Training Set | 181/197 |
The results showed that both pre-processing methods had a positive effect on the models, with the OP spectra classification showing slightly better results than the SNV spectra classification. Because water has such a strong absorbance in the NIR wavelength range, it is possible that without pre-processing, the results for the raw spectra and SNV may be classifying based on the differences in water and not the presence of an adulterant. Careful analysis of the wavelength ranges used to determine the classification will show this, but such analysis was not performed in this study. One purpose of analyzing the classification in this manner was to determine the minimum threshold for each adulterant that could be detected from the NIR spectra. None of the non-adulterated samples were incorrectly classified as having an adulterant present. For the samples that were incorrectly classified as being pure while having an adulterant present, the concentration was 0.5% for edible gelatin, 1% for industrial gelatin, and 1% for soy protein powder. All samples with an adulterant concentration of 1% edible gelatin, 2% industrial gelatin, and 2% soy protein powder (or higher) were correctly classified. These can be considered the safe thresholds of detection that the models can accurately use to detect protein adulteration in yogurt. The potential was demonstrated to use NIR spectroscopy as a method for protein adulteration in screening of yogurt and further work with a larger sample set at lower concentrations of protein adulterants should improve the results.
The post Dairy Adulterant Analysis appeared first on NIR-For-Food.
]]>The post Animal Feed Adulterant Analysis appeared first on NIR-For-Food.
]]>The post Animal Feed Adulterant Analysis appeared first on NIR-For-Food.
]]>